
Abstract
In this chapter, we present an in situ hybridization protocol with radioactive probe that has been successfully and easily used on detecting mRNA expression level and patterns, in multiple tissue types and developmental stages. To detect behaviorally regulated, i.e., motor or sensory, mRNA expression of immediate early genes (IEGs) within cells and tissues in vivo, in situ hybridization is a powerful method for discovering neural activity correlations and novel neural structures. Compared with nonradioactive probe methods such as digoxigenin (DIG) labeling, the radioactive probe hybridization method provides a semi-linear relation between signal intensity and targeted mRNA amounts for quantitative analysis. Furthermore, this method allows us high-throughput mRNA expression analysis for 100–200 sides with 400–1,000 tissue sections simultaneously. This method allows identifying the possible significance and function of interested genes in the nervous system under specific behaviors.
Access provided by Autonomous University of Puebla. Download chapter PDF
Keywords
- Activity-dependent gene expression
- High-throughput in situ hybridization
- Immediate early genes (IEGs)
- Radioactive in situ hybridization
- Songbird
- Vocalization
1 Introduction
In nature, many types of behaviors are observed in a wealth of animal species at specific conditions and at specific developmental stages with species-specific features. To understand the neural basis of such behaviors, one critical step is to identify the specific neural circuits that are activated by production of the behavior. This first step can be achieved with activity-dependent genes, which serve as molecular markers of neural activity to map functional domains and cells of the brain. This “behavioral molecular brain-mapping approach” has been successively used to identify and characterize neural systems involved in perceiving and producing behaviors (Jarvis and Nottebohm 1997; Jarvis et al. 2000; Mello et al. 1992). Transcription of the early neural activity-induced genes, known as immediate early genes (IEGs), in the postsynaptic cell is initiated by presynaptic action potential firing and subsequent neurotransmitter and/or neuromodulator release, followed by binding to postsynaptic receptors (Clayton 2000; Worley et al. 1987). After binding, extracellular Ca+ influx or release of Ca+ from intracellular stores activates a signal transduction cascade, including several kinds of protein kinases, such as protein kinase A, mitogen-activated protein kinases, and calcium- and calmodulin-dependent kinases. These kinases regulate nuclear gene expression via phosphorylation of targeted specific transcription factors, including cAMP response element-binding protein (CREB)/activating transcription factor (ATF) family and serum response factors (SRFs). These transcription factors bind to promoter regions of IEGs and initiate the mRNA transcription of IEGs at several sites on chromosomes. This IEG transcription response occurs within a few minutes after neuron activation, because induction of IEG mRNAs does not require de novo protein synthesis (Guzowski et al. 1999).
The initial IEGs discovered were transcription factors that regulate other genes (Cole et al. 1989; Greenberg et al. 1986). Subsequent molecular studies discovered other types of IEGs, encoding a diverse range of functional proteins, including regulatory transcription factors, structural proteins, signal transduction proteins, growth factors, and enzymes (Loebrich and Nedivi 2009; Saffen et al. 1988; Wada et al. 2006). Thus, IEGs fall into two subcategories, the inducible transcription factors (ITFs) and all other molecules as inducible direct effectors (IDEs). There are at least two popularly studied ITFs, c-fos and egr1 (also named zif268, NGFI, Krox-24, or zenk), and one late effector, Arc [activity-regulated cytoskeleton-associated gene (Steward et al. 1998)] in vertebrates. Along with another direct effector we have studied, called dual specificity phosphatase 1 (dusp1), the combination of these four genes can be used to ensure identifying activation in all neuron types in the vertebrate forebrain (Horita et al. 2010). In invertebrates, especially in honeybees, some IEGs identified, such as kakusei, are induced in the mushroom body of reorienting bees and foragers (Kiya et al. 2007). Whether a transcription factor or direct effector, mRNA of most IEGs is usually induced and accumulated in the cellular cytoplasm at maximal level up to 30 min during repeated production of animal’s behavior repeated sensory stimulation.
To detect behaviorally regulated (motor or sensory) mRNA expression of IEGs within cells and tissues in vivo, in situ hybridization is a powerful method. It allows single-cell resolution in tissue sections after an animal has performed behavior and processed a sensory stimulus. In situ hybridization is also a useful approach to determine the spatial and temporal profile of the IEGs of interest, especially in the absence of an available antibody. In this chapter, we present an in situ hybridization protocol with radioactive probes that has been successfully and easily used on detecting mRNA expression level and patterns, in multiple tissue types and developmental stages including embryos (Chen et al. 2012; Haesler et al. 2004).
This protocol has four major steps: (I) obtaining and sectioning the brains from behaving animals under well-controlled conditions in Sects. 9.1–9.2, (II) synthesis of radioactive RNA probes from DNA plasmids in Sects. 9.3–9.4, (III) pre-hybridization and hybridization using an oil bath and washing steps in Sects. 9.5–9.6, and (IV) signal detection in Sect. 9.7.
This method allows for handling of hundreds of slides simultaneously and quantitative analyses of gene expression. Compared with nonradioactive probe methods such as digoxigenin (DIG) labeling, the radioactive probe hybridization method does not require multiple amplification steps using horseradish peroxidase (HRP) antibodies and/or tyramide signal amplification (TSA) to detect signals of target probes. Therefore, this method provides a semi-linear relation between signal intensity and targeted mRNA amounts for quantitative analysis. Furthermore, compared with combination study with laser capture microdissection (LCM) and qPCR, this method allows us high-throughput mRNA expression analysis for 100–200 sides (with 400–1,000 tissue sections) simultaneously. Using these advantages, our group and colleagues have succeeded in discovering neural activity correlations and novel neural structures (Burmeister et al. 2005; Jarvis et al. 1998; Jarvis et al. 1997; Mello and Clayton 1994; Mouritsen et al. 2005) and performing high-throughput expression analysis with hundreds of genes (Wada et al. 2006).
2 Behavioral Observation and Brain Sampling
-
1.
Using your behavioral paradigm of interest, keep animals in a quiet state for at least 2–3 h before performing the behavioral manipulations. Then, for at least 30 min, record the animal’s behavior, such as behavioral duration, frequency, and timing, and context (with other animals, especially opposite sex) of interest {Note *1}.
-
2.
Harvest fresh brain tissue within 5–10 min.
-
3.
Rinse the brain tissue with 1× PBS to remove blood and feather/hair, and carefully remove away extra 1× PBS from the brain.
-
4.
Embed the tissue into a pre-labeled plastic embedding mold [22 × 22 × 22 mm, PolyScience, cat# 18646A-1] and fill with OCT tissue compound [Sakura, cat#4583], avoiding air bubbles, and orientate the tissue as needed for sectioning.
-
5.
Quickly freeze the block by placing it into crushed powder of dry ice {Note *2}.
Note
-
*1: Information on observation time and day, animal’s developmental stage (i.e., post-birth day), housing condition, and experimental environments (new or familiar cage/room, or which field location) is also critical.
-
*2: This crushed dry ice powder and labeling of the plastic embedding mold should be prepared before collecting the animal brain. Do not let the animal hear extraneous noise, as this will cause IEG induction in auditory pathways. After behavior or sensory stimuli have been completed, then within the next 5–10 min, the animals should be sacrificed and the brain collected to avoid RNA degradation and handling time effect. Cooling speed should be quickened by adding ethanol as ethanol-dry ice bath.
-
3 Brain Sectioning and Stock
-
1.
Put the OCT frozen block on sectioning stage in a cryostat and equilibrate to −20 °C for 30 min (Fig. 9.1a).
Fig. 9.1 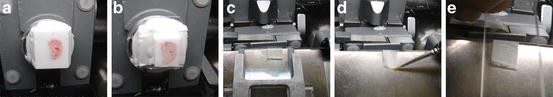
Brain sectioning in a cryostat. (a) Setting of OCT frozen block on sectioning stage. (b) Trimmed OCT frozen block. (c) Slicing of the sample. (d) Unfolding of sliced samples using a fine brush. (e) Mounting of frozen section on the slide
-
2.
Trim excess OCT by a razor blade (Fig. 9.1b).
-
3.
Slice the sample into 10–12 μm {Note *1} thick sections (Fig. 9.1c). For brain and embryonic tissue, the best cutting temperature is within the range of −18 to −20 °C {Note *2}.
-
4.
Mount frozen sections on the face of Superfrost Plus Microscope Slides [Fisher, cat#12-550-15] {Note *3} (Fig. 9.1d–e).
Note
-
*1: Optimal section thickness for obtaining good-quality sections depends on tissue types, age, and animal species. We recommend performing test sectioning and Nissl staining.
-
*2: It is critical to adjust the cryostat temperature for the appropriate tissue type. The position of the antiroll plate should allow space between the knife and glass plate and also not touch the block when cutting. A thin, firm brush allows unfolding and other manipulation of sections.
-
*3: Glass slides must be chemically coated, such as with silane, to reduce occurrence of detachment of tissue slices during procedures.
-

4 Generation of PCR Fragments from Plasmid DNA as a Template for RNA Probe Synthesis
-
1.
Amplification of PCR fragment that includes the gene of interest (GOI) and RNA polymerase binding sites, such as T7, T3, and Sp6 sequences, at both ends of GOI.
For this purpose, we regularly use pGEM-T Easy Vector that possesses T7 and Sp6 sites, M13For and Rev sites, and restriction enzyme cloning sites (Fig. 9.2).
Probe size, i.e., GOI size, can be adapted from 150 to 3,000 bp.
Fig. 9.2 
Flow chart for making RNA probe synthesis from DNA plasmid
-
2.
Perform PCR reaction.
-
2.1
PCR content
-
20 μL of distilled water (GIBCO, cat#10977)
-
1 μL (−0.1 μg) of DNA template, e.g., pGEM-T easy plasmid DNA including GOI {Note*1}
-
1.5 μL of M13Rev oligo primer (5′-ACAGGAAACAGCTATGACC-3′: 20 μM)
-
1.5 μL of M13For oligo primer (5′-TGTAAAACGACGGCCAGT-3′: 20 μM)
-
3 μL of 10× DNA polymerase buffer
-
2.5 μL of 2.5 mM each dNTPs (included with Taq polymerase kit)
-
0.5 μL of Taq DNA polymerase [5 unit/μL, Takara Ex taq cat#RR001]
-
Subtotal 30 μL in a tube × four tubes = total 120 μL
-
-
2.2
PCR condition
-
1st cycle: 94 °C 5 min
-
25–30 cycles: (94 °C 1 min +53 °C 1 min +72 °C 4 min) {Note*2}
-
Last cycle: 72 °C 7 min
-
-
2.1
-
3.
Electrophoresis on an agarose gel (1–2 %) {Note*3}.
-
4.
Apply 15–20 μL PCR product in each well, and cut gel pieces into tubes {Note*4}.
-
5.
Purify DNA fragments from agarose gel using a commercially available kit, such as GENECLEAN Kit [QBiogene, cat#1001-200] {Note*5}.
-
6.
Adjust volume to 100 μL with dH2O.
-
7.
Phenol extraction and ethanol precipitation.
-
7.1
Add 100 μL of PCI (phenol:chloroform:isoamyl alcohol 25:24:1) solution and vortex well.
-
7.2
Centrifuge at max speed of a benchtop centrifuge machine for 3 min, and pipette off aqueous solution without disturbing or removing the pellet.
-
7.3
Transfer supernatant solution into a new tube avoiding the phenol layer.
-
7.4
Add 5 μL of 5 M NaCl.
-
7.5
Add 250 μL of 100 % EtOH.
-
7.6
Incubate the tube at −80 °C at least for 15 min.
-
7.7
Centrifuge at max speed (at over 15,000 rpm) for 15 min, and get pellet.
-
7.8
Rinse with 200 μL of 70 % EtOH.
-
7.9
Centrifuge at max speed of a benchtop centrifuge machine for 3 min, and pipette off aqueous solution without disturbing or removing the pellet.
-
7.10
Add 20 μL RNase-free water, such as Pure Water (Invitrogen, cat#10977-015).
-
7.8
-
7.1
-
8.
Use 1 μL for checking of DNA concentration on an agarose gel.
-
9.
Take another 1 μL for DNA spectrometer, and adjust DNA concentration to 0.25 μg/μL {Note*6}.
-
10.
Store the tube in a −20 °C freezer {Note*7}.
Note
-
*1: Do not include more than 1 μg plasmid DNA. Nonspecific bands may be amplified.
-
*2: PCR cycles should be <30 to prevent amplifying nonspecific bands.
-
*3: Use thick and clean gels and fresh TAE buffer in the electrophoresis equipment.
-
*4: It is important to cut gel pieces including PCR bands on an UV illuminator as quickly to avoid DNA nicks by UV light.
-
*5: An alternative method to gel purification is the QIAquick PCR purification kit from Qiagen.
-
*6: If the concentration of the DNA solution is low, adjust to 0.25 μg/μL by evaporation or EtOH precipitation.
-
*7: It is possible to store the purified DNA solution for more than 3–4 years at −20 °C.
-

5 S35-RNA Probe Synthesis
-
1.
Use 0.5 mL tube or 0.2 mL PCR tube.
-
2.
Add and mix contents below.
-
1.0 μL of purified PCR DNA fragment (0.25 μg/μL)
-
1.0 μL of 10× Roche reaction buffer
-
0.3 μL of RNasin [40 U/μL: Promega, cat#N251B]
-
1.5 μL of 10 mM AGC mix solution {Note *1}
-
4.5 μL of S35-UTP [PerkinElmer, cat#NEG-039H] {Note *2}
-
0.7 μL of pure water
-
1.0 μL of T7, T3 or Sp6 RNA polymerase [20 unit/μL: Roche, cat#10881767001, 1031171001, 11487671001, respectively]
-
-
3.
Incubate the reaction tube immediately at 37 °C for 2 h {Note *3}.
-
4.
Fill up to 50 μL with 40 μL of pure water.
-
5.
Add 2.5 μL of 5 M NaCl.
-
6.
Add 125 μL of 100 % EtOH, and then mix very well.
-
7.
Incubate the tube at −80 °C or on dry ice at least for 15 min.
-
8.
Centrifuge at max. speed at 4 °C for more than 15 min, and discard supernatant.
-
9.
Wash pellet with 300 μL of 70 % EtOH and centrifuge again at max speed at 4 °C, and discard supernatant.
-
10.
Dissolve pellet with 10 μL of pure water by pipetting.
-
11.
Add 40 μL of hybridization solution {Note *4} and mix well (then store the solution at −20 °C).
-
12.
For checking radioactive counts, pipette 1 μL of S35-RNA probe solution into 1 mL scintillation cocktail in a plastic counting vial, and mix very well.
(Add 106 cpm of S35 cRNA probe solution for 100 μL hybridization solution.)
Note
-
*1: Preparation of 10 mM AGC mix solution.
Mix 2 μL of 100 mM ATP [Roche, cat#1140965], 2 μL of 100 mM GTP [Roche, cat#1140957], 2 μL of 100 mM CTP [Roche, cat#1140922], and 54 μL of pure water.
Stock mixed solution at −20 °C.
-
*2: Half-life of S35 radioactivity is 87.51 days. Therefore, it is better to use shipped S35-UTP solution within 1–1.5 months.
-
*3: To prohibit condensation formed on top of a tube that affects reaction efficiency, use a PCR machine with heat cover.
-
*4: Preparation of in situ hybridization solution.
For total 10 mL volume:
Mix 5 mL of 100 % formamide + 600 μL of 5 M NaCl + 100 μL of 1 M Tris–HCl pH 8.0 + 240 μL of 0.5 M EDTA pH 8.0 + 200 μL of 50× Denhart’s solution + 100 μL of 1 M DTT + 250 μL of 20 mg/mL tRNA [Roche, cat#109495] + 1 g of sodium dextran sulfate 500,000.
Finally, bring volume up to 10 mL with pure water.
Much time is needed to dissolve sodium dextran sulfate by shaking at room temperature.
Stock the solution in −20 °C.
-
6 Pre-hybridization and Hybridization
-
1.
Prepare appropriate amounts of 4 % paraformaldehyde/1× PBS {Note*1}, 1× PBS {Note*2}, and 2× SSPE {Note*3}, and set each container (Fig. 9.3).
Fig. 9.3 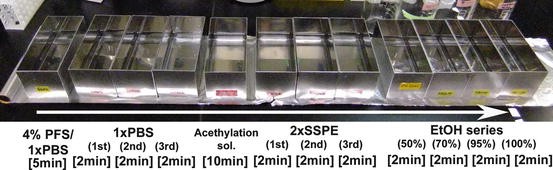
Solution series for pre-hybridization
-
2.
Immerse glass slides with tissue sections in 4 % paraformaldehyde/1× PBS for 5 min at room temperature (RT) {Note*4}.
-
3.
Rinse three times in 1× PBS in three separate containers, 2 min each, with occasionally gentle shaking.
-
4.
Put slides in 1 L of acetylation solution {Note*5} for 10 min.
-
5.
Rinse three times in 2× SSPE for each 2 min in three separate containers.
-
6.
Dehydrate through the alcohol series, 50 % EtOH, 70 % EtOH, 95 % EtOH, and then 100 % EtOH {Note*6}, for 2 min each.
-
7.
Let the slides dry under the hood on a paper towel.
-
8.
Calculate the total volume needed for all slides (plus a few extra), from 50 to 150 μl {Note*7} of hybridization solution per slide.
-
9.
Mix S35-cRNA probe and hybridization solution very well, but gently, avoiding generation of air bubbles (adjust 106 cpm S35-cRNA probe/100 μL hybridization solution).
-
10.
Incubate mixed solution at 65 °C water bath for 5 min to dissolve reagents, and then immediately chill on ice at least for 5 min.
-
11.
Put S35-cRNA probe/hybridization solution on a cover slip, and gently place a glass slide on it with the tissue sections facing the hybridization solution (Fig. 9.4a–e).
Fig. 9.4 
Cover slip procedure and hybridization in oil bath with radioactive RNA probe. (a) Setting of cover slip procedure. (b) Labeling sample information on glasses with a pencil. (c) Putting S35-cRNA probe/hybridization solution on a cover slip. (d & e) Placing a glass slide on a cover slip, then immediately flip the side to face up. (f & g) Placing the cover-slipped slides in a metal rack. (h)Placing the metal racks into the oil bath
-
12.
Place the cover-slipped slide in a metal rack, making sure the slides stay in a horizontal position (Fig. 9.4f–g).
-
13.
Carefully place each rack into the oil bath {Note*8} at 65 °C {Note*9} (Fig. 9.4h).
-
14.
Incubate slides overnight (12–15 h) {Note*10}.
Note
-
*1: Preparation of 3 % paraformaldehyde/1× PBS:
For 1 L solution:
Mix 30 g paraformaldehyde in 100 mL of 10× PBS + 900 mL deionized H2O (dH2O, no need to use DEPC-H2O), and add 320 μL of 10 N NaOH (to help paraformaldehyde to dissolve, adjustment of pH).
While stirring, heat the solution (~40 °C) under a hood on the hot plate.
-
*2: Preparation of 1× PBS:
ten times dilution from 10× PBS.
To make 10× PBS for 1 L, add 800 mL of dH2O to a large beaker.
While the water is stirring with a magnet on stir plate, add the following:
80 g NaCl
2 g KCl
29 g Na2HPO4-12H2O
2 g KH2PO4
Finally, fill up to 1 L.
-
*3: Preparation of 2× SSPE:
Ten times dilution from 20× SSPE. For making 5 L of 20× SSPE solution, mix 876.5 g of NaCl, 153.5 g of NaH2PO4-2H2O, and 37 g of EDTA, add 32.5 mL of 10 N NaOH, and fill up to5 L of dH2O (no need to use DEPC-H2O).
Store at RT.
-
*4: The incubation time in 4 % paraformaldehyde/1× PBS is critical for fixation, a condition that affects hybridization efficiency later.
-
*5: Preparation of 1 L of acetylation solution:
Mix 13.6 mL triethanolamine in1L dH2O (no need to use DEPC-H2O).
Right before you’re ready to use it, add 2.52 mL of acetic anhydride, mix well, and immediately pour the solution over the slides.
-
*6: These alcohol solutions can be reused at least 5–10 times, when processing ~60 slides each time.
-
*7: The amount of hybridization solution depends on how many tissue sections are attached on the glass slide.
-
*8: Mineral oil [Sigma, cat#330760] is used.
-
*9: Hybridization temperature: We recommend 65 °C as a default of hybridization and wash temperature. If high background signal was observed as a result of an RNA probe size (over 3 kbp) or high G/C % (over 70 %), it would be good to try 70 °C. Conversely, if a researcher wants to try cross-species hybridization with RNA probes generated from a different species’ cDNA sequence and does not obtain a strong enough, high-quality signal, then try lower hybridization and wash temperatures in steps of 5 °C (However, in such case, cloning and using the species-specific cDNA fragment of GOI is the better approach.).
-
*10: Hybridization time is one of the most crucial points to affect signal intensity and noise ratio.
-


We recommend using a standard hybridization time (−15 h) across experiments, if a researcher wants to compare the results from experiments performed on different days (but using the same S35 RNA probes). Over 20 h incubation usually generates high background. Although general signal intensity may be less, 6–9 h of incubation may generate a better S/N ratio.
7 Post-hybridization Washing Treatment
-
1.
Prepare solutions and set each container (Fig. 9.5).
Fig. 9.5 
Solution series for post-hybridization washing
-
2.
To remove mineral oil, immerse the metal rack into at least two consecutive chloroform washes. Between transfers of chloroform washes, dip the solution off the rack very well.
-
3.
Place the metal rack with slides into 2× SSPE + 0.1 % β-mercaptoethanol.
-
4.
Remove the cover slips from the slides with forceps while the slides are in this solution and quickly.
-
5.
Place slides into a metal rack in 2× SSPE + 0.1 % β-mercaptoethanol without letting the section dry {Note *1}.
-
6.
Incubate slides in 2× SSPE + 0.1 % β-mercaptoethanol for 30 min at RT with occasional shaking {Note *1}.
-
7.
Incubate slides in pre-warmed 50 % formamide/2× SSPE/0.1 % β-mercaptoethanol for 1 h at 65 °C with occasional (two to three times) shaking {Note *1}.
-
8.
Incubate in pre-warmed 0.1× SSPE/0.1 % β-mercaptoethanol for 30 min at 65 °C with occasional shaking {Note *1}.
-
9.
Repeat the same procedure (0.1× SSPE/0.1 % β-mercaptoethanol for 30 min at 65 °C) again in another new solution.
-
10.
Run through the alcohol series, 50 % EtOH, 70 % EtOH, 95 % EtOH, and 100 % EtOH, for 2 min each {Note *2}.
-
11.
Let the slides dry under the hood on a paper towel.
Note
-
*1: After rinsing, this 2× SSPE + 0.1 % β-mercaptoethanol must be handled as radioactive waste.
-
*2: These alcohol solutions can be reused over 10 times, with ~60 slides per time.
-

8 Signal Detection of S35-RNA Probe: Visualization of Radioactive Signal
Detection of Signal with X-ray Film:
-
1.
Place dry glass slides into a film cassette and expose the slides to X-ray film (Kodak, BioMax MR film) in a dark room for several days {Note*1} (Fig. 9.6a). Make sure that the slides face the emulsion side of the X-ray film {Note*2}.
Fig. 9.6 
Visualization of radioactive signal with X-ray film. (a) Setting of hybridized glasses on a film casette. (b) Developed X-ray film. Black color represents mRNA signals
-
2.
Develop the X-ray film in standard developer and fixer in a dark room {Note*3} (Fig. 9.6b).
-
3.
The hybridization signal shows up as black (exposed silver grains in the emulsion) on the film.
Note
-
*1: For test exposure, usually 1–2 days is enough. For regular exposure, 2–4 days should be fine.
-
*2: We do not recommend using regular X-ray film that has emulsion on both sides, because S35 radioactivity cannot go through opposite side of the X-ray film. Therefore, regular X-ray films cannot be enhanced with S35 in situ hybridization; rather, they cause a more diffused image.
-
*3: If needed to perform manual development of X-ray film, prepare one developer container, two tap water containers, and one fixer container in a dark room.
-

Under safelight conditions, put X-ray films in a developer container for 3 min, then transfer it to the first tap water container for 1 min to rinse out developer solution. Immerse films in a fixer container for 3 min, transfer it to the second tap water container for a few minutes rinsing very well, and then hang dry them (the later step can be at regular room light).
(Optional)
Detection of Signal with High Resolution by Silver Grain Dipping:
For Generating of Higher Resolution Signals with Cresyl Violet {Note *1}:
-
1.
Delipidize slides by incubating them in xylene (rack needs to be mettle) for 5 min at RT twice {Note *1}.
-
2.
Remove xylene and rehydrate 1 min each in 100 %, 100 %, 95 %, 95 %, 70 %, and 50 % EtOH and then in dH2O {Note *1}.
-
3.
Dry slides well under a hood for at least 2–3 h.
-
4.
Then, in the dark room under red-color safelight, scoop out needed amount of Kodak NTB2 emulsion into 50 mL tube with the same amount of dH2O to make 1:1 ratio solution.
-
5.
Incubate the emulsion solution in a 42°C water bath at least 15 min, occasionally gently mixing but not to make air bubbles.
-
6.
Dip glass slides into the diluted emulsion in the 42°C water bath.
-
7.
Dry dipped slides in a closed lighttight container with silica gel overnight in an oven at 37 °C.
-
8.
Transfer the slides into the black boxes containing silica gel {Note *2}.
-
9.
Seal the edges of the boxes with black electrical tape (avoiding generating static electricity) and wrap the boxes in aluminum foil.
-
10.
Store the boxes at 4 °C {Note *3} from several days to weeks {Note *4}.
For Developing Silver Dipping Slides:
-
11.
Warm up the slide boxes to room temperature for 1 h.
-
12.
In the darkroom, set five metal trays with two developer [Kodak, cat#1464593], one tap water, and two fixers [Kodak, cat#1971746] and a large plastic tray for final rinsing with tap water.
-
13.
Develop the dipped slides in Kodak D-19 developer at 16 °C for 3 min, twice.
-
14.
Wash the developed slides in tap water at RT for 1 min.
-
15.
Incubate the slides in fixer at 19 °C for 3 min, twice.
-
16.
Then, lights can be turned on.
-
17.
Wash the slides in running tap water at RT at least 10 min.
-
18.
While washing, with a razor blade scrape the emulsion off the backside of the slide that does not contain tissue sections {Note *5}, and rinse with tap water.
-
19.
Dry slides up slides at RT.
For Staining Tissues with Cresyl Violet:
-
20.
Stain tissue with 0.3 % cresyl violet in tap water solution for 15 min in a 37 °C water bath {Note *6}.
-
21.
Wash excess cresyl violet solution in fresh tap water for ~15 dips.
-
22.
Dehydrate the slides for ~15 dips each in alcohol solutions: 50 %, 70 %, 95 %, 95 %, 100 %, and 100 % EtOH.
-
23.
Incubate the slides in xylene (rack needs to be metal) for 5 min at room temperature twice.
-
24.
Place Permount medium [Fisher, cat#SP15-500] on the slide, cover slip with a glass cover slip, and dry the covered slide in the hood for overnight.
-
25.
The sections can be examined underneath the microscope within 1 day, but it takes about 72 h for the Permount to become hard enough to clean the slide without the cover slip coming off.
Note
-
*1: If not going to stain with cresyl violet, then delipidization is not necessary. It is necessary to delipidize before placing slides in emulsion as the lipids will not be removed easily after covering with emulsion.
-
*2: At this step, make sure the condition of the dipped slides is completely dry.
-
*3: Keeping dipped slides at 4 °C is critical to avoid mold growing on the glass slides during exposure of the S35 signal to the emulsion.
-
*4: Signal from 1 day on X-ray film is similar to 5 days under emulsion.
-
*5: The slide needs to be wet; otherwise the razor blade will scratch the slides.
-
*6: This step can be performed at RT. In the case, the incubation time should be longer.
-
9 Concluding Remarks
For visualizing radioactive probe signal on brain sections, there are major two ways, detection by X-ray films and by silver grains.
Detection by X-ray films provides a relatively quick result and analyses. Furthermore, the X-ray film data could be used for high-throughput quantitative analysis. The X-ray film also reveals broad anatomical resolution. It provides the ability to easily compare expression patterns among different brain sections on the same and different slides. For this purpose, it is very critical to pay close attention to obtaining a high signal-to-background noise ratio on the X-ray film. High background on X-ray films is usually caused by using old developer or fixer or with probe problem. Poor quality of riboprobes also generates high background. In our experience, probes generated with Sp6 RNA polymerase more than T7 and T3 RNA polymerases have a tendency toward such problems. In such case, we recommend to increase enzyme units for RNA synthesis. The oil creates an instant seal, allowing for rapid processing of many slides. Sometimes, mineral oil from the hybridization step remains on the slides and tissue sections, which will cause spotted dark background. For quantitative analysis, we recommend not to use overexposed films. It is critical to maintain a signal intensity that correlates linearly with actual mRNA expression levels. To show digital photo images of brain sections from X-ray film, there are two representative ways: regular bright-field image (in this case, signal is black in color: Fig. 9.7a top low) and inverted black/white image (in this case, signal is white color: Fig. 9.7a 2nd low). Inverted black/white images can be easily produced from regular bright-field images using “inverted color function” in an image software, such as Image J or Photoshop.

Photo images of radioactive signals. (a) whole brain in-situ hybridization images under silent and singing conditions, using X-ray film images under bright light (top panels; black = mRNA signal), inverted X-ray film images (2nd low; white = mRNA signals), silver grain dipped-cresyl violet stained images under regular bright light (3rd low; black = mRNA signals, blue/purple = cresyl violet stained cells), and silver grain dipped-cresyl violet stained images under polarized light in dark field (4th low; white = mRNA signals, purple/red = cresyl violet stained cells). Scale bar = 2mm. (b) Higher magnification of silver grain dipped-cresyl violet stained images under regular bright light. Developed silver grains are observed as black dots. Scale bars = 200μm
Detection by silver grains in the emulsion is produced by the pattern of decay emission from the radioactive probe. The emulsion results show tissue morphology and higher cellular resolution of gene expression. The emulsion contains light-sensitive silver salts placed over the tissue. After exposure and developing the emulsion, exposed silver salts are converted to metallic silver grains. The metallic silver grains block direct light through and appear as the black dots under bright-field view. In this situation, cells lable blue/purple in color after cresyl violet staining (Fig. 9.7a, 3rd low & b). The silver deposits over the cells represent mRNA gene expression and can be observed and measured qualitatively under a microscope. Gene expression can be quantified at the cellular level by counting the average number of silver grains over cells relative to the background silver grains elsewhere on the tissue or slide.
In dark field the silver grains reflect light coming from the side and appear as the white dots (Fig. 9.7a, 4th low). The cresyl violet stain appears as a purple/red color. In the dark field view, the hybridization signal is easier to visualize under lower magnification, and its image is commonly used to show the overall gene expression pattern.
References
Burmeister SS, Jarvis ED, Fernald RD (2005) Rapid behavioral and genomic responses to social opportunity. PLoS Biol 3:e363
Chen CC, Wada K, Jarvis ED (2012) Radioactive in situ hybridization for detecting diverse gene expression patterns in tissue. JVis Exp pii:3764
Clayton DF (2000) The genomic action potential. Neurobiol Learn Mem 74:185–216
Cole AJ, Saffen DW, Baraban JM, Worley PF (1989) Rapid increase of an immediate early gene messenger RNA in hippocampal neurons by synaptic NMDA receptor activation. Nature 340:474–476
Greenberg ME, Ziff EB, Greene LA (1986) Stimulation of neuronal acetylcholine receptors induces rapid gene transcription. Science 234:80–83
Guzowski JF, McNaughton BL, Barnes CA, Worley PF (1999) Environment-specific expression of the immediate-early gene Arc in hippocampal neuronal ensembles. Nat Neurosci 2:1120–1124
Haesler S, Wada K, Nshdejan A, Morrisey EE, Lints T, Jarvis ED, Scharff C (2004) FoxP2 expression in avian vocal learners and non-learners. J Neurosci 24:3164–3175
Horita H, Wada K, Rivas MV, Hara E, Jarvis ED (2010) The dusp1 immediate early gene is regulated by natural stimuli predominantly in sensory input neurons. J Comp Neurol 518:2873–2901
Jarvis ED, Nottebohm F (1997) Motor-driven gene expression. Proc Natl Acad Sci USA 94:4097–4102
Jarvis ED, Ribeiro S, da Silva ML, Ventura D, Vielliard J, Mello CV (2000) Behaviourally driven gene expression reveals song nuclei in hummingbird brain. Nature 406:628–632
Jarvis ED, Scharff C, Grossman MR, Ramos JA, Nottebohm F (1998) For whom the bird sings: context-dependent gene expression. Neuron 21:775–788
Jarvis ED, Schwabl H, Ribeiro S, Mello CV (1997) Brain gene regulation by territorial singing behavior in freely ranging songbirds. Neuroreport 8:2073–2077
Kiya T, Kunieda T, Kubo T (2007) Increased neural activity of a mushroom body neuron subtype in the brains of forager honeybees. PLoS One 2:e371
Loebrich S, Nedivi E (2009) The function of activity-regulated genes in the nervous system. Physiol Rev 89:1079–1103
Mello CV, Clayton DF (1994) Song-induced ZENK gene expression in auditory pathways of songbird brain and its relation to the song control system. J Neurosci 14:6652–6666
Mello CV, Vicario DS, Clayton DF (1992) Song presentation induces gene expression in the songbird forebrain. Proc Natl Acad Sci USA 89:6818–6822
Mouritsen H, Feenders G, Liedvogel M, Wada K, Jarvis ED (2005) Night-vision brain area in migratory songbirds. Proc Natl Acad Sci USA 102:8339–8344
Saffen DW, Cole AJ, Worley PF, Christy BA, Ryder K, Baraban JM (1988) Convulsant-induced increase in transcription factor messenger RNAs in rat brain. Proc Natl Acad Sci USA 85:7795–7799
Steward O, Wallace CS, Lyford GL, Worley PF (1998) Synaptic activation causes the mRNA for the IEG Arc to localize selectively near activated postsynaptic sites on dendrites. Neuron 21:741–751
Wada K, Howard JT, McConnell P, Whitney O, Lints T, Rivas MV, Horita H, Patterson MA, White SA, Scharff C et al (2006) A molecular neuroethological approach for identifying and characterizing a cascade of behaviorally regulated genes. Proc Natl Acad Sci USA 103:15212–15217
Worley PF, Baraban JM, Snyder SH (1987) Beyond receptors: multiple second-messenger systems in brain. Ann Neurol 21:217–229
Author information
Authors and Affiliations
Corresponding author
Editor information
Editors and Affiliations
Rights and permissions
Copyright information
© 2013 Springer
About this chapter
Cite this chapter
Wada, K., Chen, CC., Jarvis, E.D. (2013). Detecting Neural Activity-Dependent Immediate Early Gene Expression in the Brain. In: Ogawa, H., Oka, K. (eds) Methods in Neuroethological Research. Springer, Tokyo. https://doi.org/10.1007/978-4-431-54331-2_9
Download citation
DOI: https://doi.org/10.1007/978-4-431-54331-2_9
Published:
Publisher Name: Springer, Tokyo
Print ISBN: 978-4-431-54330-5
Online ISBN: 978-4-431-54331-2
eBook Packages: Biomedical and Life SciencesBiomedical and Life Sciences (R0)