
Abstract
Remote connectivity of today’s and future cars increases their capabilities of autonomy and safety, but also their attack surface, as reported by several research papers. In the automotive domain, the security has a direct impact on the user’s safety. Thus, the management of risk is becoming the main concern of automotive manufacturers, especially for the future fully connected and autonomous cars. A possible way to quantify the overall risk of a system is the systematic construction of attack graphs and attack trees. These formalisms are presented as one of the possible solutions in the new Cybersecurity Guidebook for Cyber-Physical Vehicle Systems (SAE-J3061). In this chapter we propose to use graph transformation to formally model the car architecture and its state evolution in order to study cyber-physical attacks against it. The resulting attacks are converted into attack trees which are used to estimate the overall risk of the system. Consequently, it becomes possible to study improvements while building a more secure architecture. The proposed method is designed to support the conceptual phase of the vehicle’s cyber-physical system. We illustrate the method on a small pedagogical example to show how it is possible to prove its efficiency.
Access provided by CONRICYT-eBooks. Download chapter PDF
1 Introduction
During the last 15 years, the automotive domain has been subject to many developments that allow car manufacturers to enhance most of features by digital processing assistance. These changes helped to build more robust, safer, more comfortable, and user-friendly cars. Later developments introduced the car to remote connectivity technologies that allowed even more advanced functionality to be integrated in the car. Wi-Fi and Bluetooth connectivity to smartphone and cellular connectivity offer a plethora of possibilities for the user. Unfortunately these technologies exposed the car to the outside world, and like every connected device, the car became one of the targets for hackers [6, 15]. Motivation of such hackers could go from a simple privacy violation where the goal is to steal private information from the car owner or the car manufacturer to a more dangerous scenario that could threaten user safety.
Since the car used to be a closed system, hypothesis about some trusted domains that used to be true in a not connected car is no longer valid, especially when it comes to the internal communication buses. An attacker may leverage these trust relations along with some code vulnerabilities to retrieve, compromise, and steal private information or, even worse, take control over the entire vehicle or some of its functionalities [4, 6, 15].
In fact, in the last years, some researchers began to report multiple important issues related to the design and implementation of the car architecture. In [8] an early work of Hoppe et al. pointed out the threats on in-vehicle bus networks based on characterizations carried out on a simulated bench. These conclusions have been further confirmed later in [12] and [4] that performed CAN frame injections on a real vehicle but with direct physical access to the communication bus of the car. In a more advanced attack, Miller et al. reported in [15] that the physical access to the vehicle is not necessary if an attacker can find some code vulnerability that allows him to reach these communication buses using another wireless attack vector. In general, the recent works performed in this area have shown that combinations of exploits and mis-configurations are the typical means by which an attacker breaks into a car communication bus. Facing this increasingly growing threat, car manufacturers have to guarantee a certain security level of the equipment embedded in the automobile. The obvious approach to this problem is to conduct a security assessment study. The goal of the security assessment is to identify the assets and the associated attack scenarios regarding availability, integrity, and confidentiality. There are available methods like EBIOS and TVRA that could be adapted to conduct such a study in the automotive domain. Ultimately the study will help the manufacturer decide where to best spend the security budget. To do so, the risk is evaluated relatively to each attack scenario based on its impact and its likelihood.
-
{sci} is the set of identified attack scenarios.
-
Impact is a function that evaluates the impact of a given scenario.
-
Pocc is the likelihood or the probability of occurrence of the given scenario.
While the impact of the attack scenario has to be defined by the security experts, determining what attack scenarios are likely to occur is a little more complex and strongly depends on the given architecture. Eventually security experts have to imagine every possible way the attacker can exploit the system in order to reach her objective. A fairly good way to model these attacks and to document them is to use attack trees or the attack graphs. Attack trees have been introduced in [21] as a useful way to document and understand attacks on a given system and most importantly is a way of making decisions about how to improve the security of the target system. The root node in an attack tree represents the attack goal (or attack scenario), and leaf nodes represent basic attacks. Each node in the tree is either an [AND] node or an [OR] node. An [AND] node has child nodes that represent different steps of achieving the goal, and an [OR] node has child nodes that represent different ways of achieving the goal. Attack graphs are also a good way to document attacks. They are composed of vertices (that represent the system states) and edges (that represent attacks performed on the system).
Attack trees are well designed to support risk assessment studies [13]. Nevertheless, the elaboration of attack trees can be a tedious task and error prone for large systems. This is why automated techniques to generate such representations of attacks have been proposed.
1.1 Attack Trees in the Automotive Domain
In the automotive domain, little work has been conducted in such direction. To the best of our knowledge, the work of Salfer et al. [19, 20] is the only one that proposes such approach. In [20], Salfer et al. present automated attack tree generation as a reachability problem of assets inside the cyber-physical architecture of the vehicle. Nevertheless, the proposed model focuses on scalability issue using heuristic techniques and does not address the exhaustivity of the attack paths.
Lugou et al. [14] and Apvrille et al. [3] use SysML-Sec modeling language to model safety and security aspects of the car architecture and formally prove safety (with Uppaal) and security (with ProVerif) properties. In [2] Apvrille et al. explain how to use an input attack graph modeled with SysML-Sec for the verification of a system. The issue of how to create such an attack graph is not addressed; in other words the attack scenarios are not automatically generated and need to be manually fed to the tool.
1.2 Attack Tree Generation
In contrast automated generation of attack trees has been addressed in other domains, especially in network security and enterprise security [1, 9, 11, 17].
In [17] Phillips et al. build an attack graph based on topology and vulnerability information; they also use the attack graph to identify attack paths with high probability or low cost. In [18] Ritchey et al. used a model checker to provide single attack scenarios to depict vulnerabilities due to the configuration of various hosts in a network. The pieces of information about the network are fed to a model checker and then assert that an attacker cannot acquire a given privilege on a given host. The model checker provides a counterexample (the attack steps) in case the assertion is false. As an extension of this work, in [22] Sheyner et al. present an automated method to analyze a network of hosts with known vulnerabilities and produce an attack graph that depicts all possible ways for the attacker to reach his goal. Later works focused on reducing the complexity of the approaches. In [1] Ammann et al. propose a scalable attack graph generation based on the monotonicity assumption (an exploit never invalidates another exploit). In [16] Ou et al. introduced a logic-based approach for network security analysis. The method relies on inference rules implemented on a modified version of the XSB inference engine to depict all attack paths combining vulnerabilities in a network. In [9] Ingols et al. use network configuration data to automatically compute network reachability, classify vulnerabilities, and build an attack graph used to recommend actions to improve network security. In [11] Jajodia et al. use topological information to analyze vulnerability dependencies and assess the impact of individual and combined vulnerabilities on overall security, then identify key vulnerabilities, and provide strategies for protection.
The problem has also been investigated for enterprise security domain [5, 10]. The goal is to implement enterprise security policy against possible “insider attack” or attacks that leverage certain “trust” relations and social interactions between actors (employees). Thus efforts focused on modeling trust relations and asset mobility. In [10] Ivanova et al. present a general framework of a model for enterprise security and how to transform this model to an attack tree that exploits possible trust relations between actors. In [5] only the modeling aspect of the problem is discussed and focuses also on trust relations and asset mobility.
Those generation techniques rely on models that are not suited for the automotive domain. However the general approach could be adapted. This approach is more or less the same for all of the presented works : first the real system is abstracted in a model that captures only the important aspects. Second the modeled system is expressed using the language of an inference engine (model checker, Horn clauses, etc.). It is then processed by the inference engine whose output is a set of possible attacks to be analyzed.
1.3 Contributions
In this chapter we first propose a method to model elements of the cyber-physical architecture of the vehicle using graphs. The model captures the security policy implemented as well as vulnerability information and access rights. Besides we consider an attacker model as a set of attacks originating from all the attack vectors (short range, long range, and indirect physical access). The system and attacker are modeled with behavioral rules using graph transformation system.
Second, we use the model to generate possible attack paths (combinations of actions) that can be used by the attacker to drag the system into a vulnerable state. Thus the generated attacks are more detailed and we can capture more information about the possible attacker actions. The simulation of this behavioral model will allow us to find all vulnerable states and to retrace attacker actions that allowed him to reach it. Using this information we generate an attack tree that summarizes all possible steps that allow the attacker to reach his goal.
Based on such model, we can try to answer questions like:
-
Is a vulnerable configuration/state reachable from an initial state? In other words is an attack scenario achievable on the proposed architecture?
-
Which sequence of basic attacks the attacker has to perform in order to reach such vulnerable state?
In what follows, Sect. 2 gives some preliminary notions and definitions in the automotive domain and introduces the formal modeling language used. In Sect. 3 we explain how to generate attack scenarios. Section 4 shows how to deduce the attack tree necessary risk assessment. The small example introduced in Sect. 2.2 helps the reader understand the methodology throughout the chapter. And finally Sect. 6 concludes the paper.
2 Background and Definitions
In this section we introduce to the reader some notions relative to the automotive domain that will be used in the reminder of the article, we introduce the modeling language that we used to build the model, and finally we present a small example that we will use in the following sections to illustrate the different steps.
2.1 Automotive Architecture
The cyber-physical architecture of the car is composed of multiple components that could be categorized in four main categories:
-
Sensors: these are components whose role is to report information about the state of the vehicle (speed, closed/open doors, break/acceleration,etc.) and its surroundings (vision radars, …). The data that produced by the sensors are sent to Electronic Control Units (ECUs) to be processed.
-
Actuators: these are the components that transform commands coming from different ECUs into actions (engine, wheel orientation, …)
-
ECUs: short for Electronic Control Units that are the most important part of the architecture. In general they are composed of hardware electronic components (memories, microcontrollers, etc.) that have a processing capacity and that embed algorithms (software) needed to ensure the control of every single functionality inside the vehicle from breaking to air-conditioning and more advanced functionality that ensure the user’s comfort (e.g., Internet connectivity, smart applications, etc.…)
-
Communication buses: they are an important part of the architecture as they represent the main medium of communication between the ECUs. Multiple technologies of buses could be found in today’s cars, e.g., CAN, FlexRay, Ethernet, and others. Each technology has some characteristics that justify its presence between certain ECUs: robustness, throughput, etc. For historical reasons and up until lately, these technologies (CAN protocol being on top of the list) did not implement security mechanisms as these communications were assumed to be “trusted.”
Some of the ECUs inside this architecture implement advanced services that open the whole architecture to the outside world. Examples of these services are internet connection, Bluetooth, Wi-Fi for smartphones, etc. Given the fact that automotive architecture used to be a closed system and that internal communication buses still used were not designed with security in mind, the new attack vectors expose the architecture to sophisticated attacks that leverage these “trusted” relations.
2.2 Architectural Graph
In this section we identify key elements of the automotive architecture introduced in Sect. 2.1 and the relations between them. Using these elements, we model the cyber-physical system of the car using graphs: the main idea is to model communication buses, hardware components of the ECUs (including the sensors and actuators), and the software components as graph nodes. Arcs in the graph model relations between the nodes. Figure 1 represents an example of an architectural graph.
-
Service node:
Automotive services are built around the notion of function blocks, which emphasizes the connection of inputs and outputs to core software modules. Those software modules are then mapped to different ECUs. Automotive software frameworks such as AUTOSAR are particularly designed to support such architecture. We base the model around this concept. A service is modeled as a node in the graph. To communicate data, services use read and write access to shared memory or to/from network hardware, sensors and actuators. These access rights are modeled with arcs directed to the corresponding hardware elements. Besides access rights, we also capture the vulnerability information of the modeled service.
-
Hardware node:
A hardware node is a special node that abstracts a hardware component: it is used to represent sensors, actuators, memory components, communication controllers, etc. Software nodes have access rights over the hardware nodes.
-
Communication node:
A communication node models communication mechanisms between hardware nodes that are used to exchange data. It is designed to model a bus communication between multiple hardware nodes as well as a point-to-point communication between only two hardware nodes.
-
Data node:
A data node models a data asset that can be located on a service node, a hardware node, or a communication node.


Small example
Running Example
To clarify the model, let us consider the example of Fig. 1. In this example we propose an architecture composed of three ECUs connected to the same CAN bus. The CAN bus is connected to the OBD port: ECU-1 contains a CAN transceiver that allows it to communicate over the CAN bus, a processing unit and a speed sensor. On the CPU runs a service whose job is to make the speed acquisition and send it over the CAN bus. This service has a read access to the sensor and a write access to the CAN transceiver. On ECU-2 we have also a CAN transceiver, a processing unit, and a screen. On this processing unit runs a service whose job is to read the speed information from the CAN bus and to pass it to the screen to be displayed. Thus it has a read access over the CAN transceiver and a write access over the screen hardware. ECU-3 is connected to both the CAN bus and the cellular network. We suppose that on the CPU of this ECU runs a vulnerable service that has a read/write access to the cellular hardware and a read/write access to the CAN transceiver. ECU-1 is supposed to sense the speed and send it over the CAN bus to be displayed by ECU-2 over the screen.
2.3 Graph Transformation
In this section we briefly introduce graph transformation system (GTS) as a rule-based modeling approach that allows to capture the structural as well as behavioral aspects of a system. We use it as the underlying formal modeling language supporting the methodology.
A graph transformation system is a formal approach for structural modifications of graphs via the application of transformation rules. A graph transformation system is thus a tuple (G, R) where G is a graph and R is a set of transformation rules. A typed GTS is a GTS where each element of the graph is assigned a type. Transformation rules are then type preserving. We consider typed graphs. A graph transformation rule consists of a left-hand side graph L, a right-hand side graph R, a Negative Application Condition (NAC), and a mechanism specifying how to transform L into R when the NAC is satisfied.
In general we model three types of transformation rules:
-
Transformation rules to describe the behavior of services (one or multiple rules for each service). This rule is conditioned by the availability of the input data. We assume that as soon as the input data are all available, the transformation rule can be triggered. The effect of this transformation rules will be to delete the input data (consumed by the service) and to create the output data with the correct output type and made available for other services. Some transformation rules may add an attribute to the input data node when there is no need to delete and create another data “type.”
-
Transformation rules to describe the normal behavior of the hardware components. For each type of hardware node, we define a behavioral model. For instance, a memory node used to store data accepts a data node only from a service that has a write (w) access right on it and also can transfer data only to a service that have a read (r) access right on it.
-
Transformation rules to describe the attacker actions: the behavior of the attacker is modeled with transformation rules that represent basic attacks or actions that the attacker can perform on the system to interact with it.
Example
As an example let us introduce transformation rules that we model for the architectural graph (Fig. 1) of the example introduced above.
-
1.
To describe the behavior of the speed-acquisition service (S1), we implement the transformation rule of Fig. 2. This rule means that if the speed data is available, the speed-acquisition service (S1) will read a speed data from the speed sensor.
Fig. 2 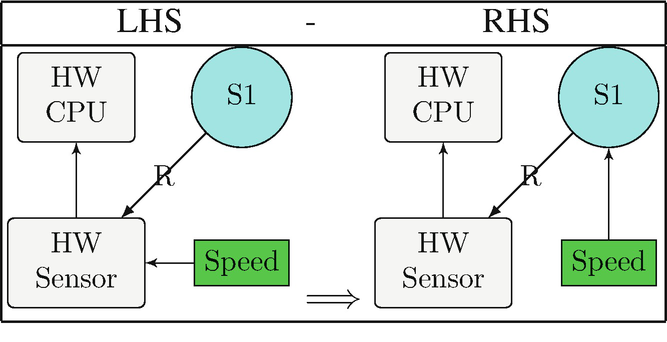
Speed-acquisition rule (R1)
The transformation rule of Fig. 3 means that is the speed data is available on the speed-acquisition service (S1) and that service has the write access right to the CAN hardware; then the service can send the data the CAN hardware.
Fig. 3 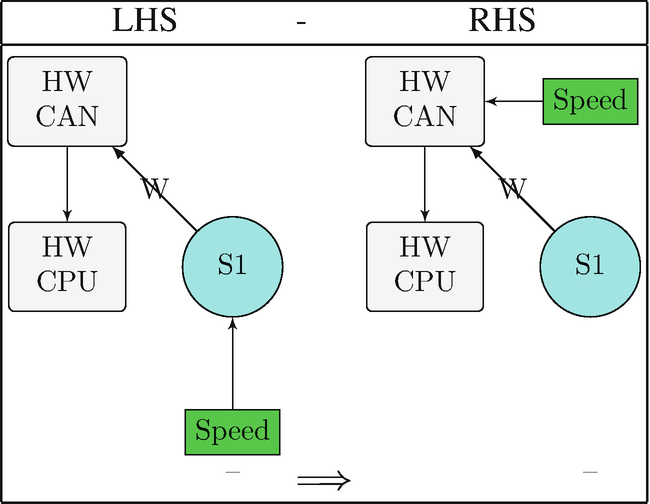
Speed send to CAN rule (R2)
-
2.
To describe the behavior of the CAN hardware, we implement the transformation rule of Fig. 4. Note that at this stage, it does not matter if the data is a speed data or not. This is mainly because this behavioral rule is designed to send any data on the CAN bus. The rule is also common to all CAN hardware as opposed to some rules that are sometimes specific to one in particular.
Fig. 4 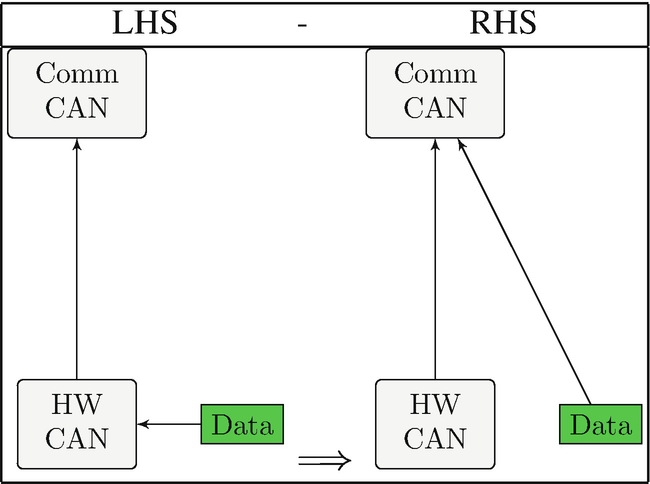
CAN send rule (R3)
-
3.
To describe the behavior of the attacker, we model transformation rules that gives her the ability to connect to any communication link and to read and write data on that link. She is also able to exploit vulnerabilities and modify the collected data and replay it. The transformation rule (Fig. 5) could be read as follows: if the attacker (Att) is connected to the CAN network, and if there is a data packet transiting on the CAN network, then the attacker can copy the data.
Fig. 5 
Example of attacker rule


3 Attack Graph Generation
Given a start graph, and a set of transformation rules, the recursive application of the transformation rules on the start graph will generate a state space which represents all possible states that could be generated from the set of transformation rules. In the state space, each state represents a graph, and a transition between two states (source and destination) represents a rule application that allowed the transformation of the graph from the source state to match that of the destination state. For instance, the application of the transformation rules of Figs. 2 and 3 for the modeled example of Fig. 1 will produce the state space of Fig. 6.


Application of transformation rules (state space)
The modeled rules are a combination of attacker actions (or basic attacks) and rules that describe the behavior of the modeled elements. The produced state space contains transitions that model both attacker steps and element behavior. By definition of the attack graph, the state space contains the attack graph.
Given a particular attack scenario (attacker objective), we have to make a query to find states in the state space where the scenario is realized (the attacker has reached its objective). Thus queries allow to detect a vulnerable state. They are expressed also in the form of graph. Figure 7 gives an example of a query that allows us to detect if there is a state of the system where the screen displays a modified speed. In practice we model the architectural graph and transformation rules using a tool named GROOVE [7]. This tool allows the transformation of the input model and produces the associated state space.


Query: false speed
In the next section, we will process this state space to capture only attacker actions in the form of an attack tree.
4 Attack Tree Generation
The generated state space is quite complex and large (for the introduced small example, we have 768 states and 2860 transitions). Besides it includes transitions that describe the behavior of the system as well as transitions that describe basic attacks performed by the attacker. A convenient way to reduce the information is to transform this state space into an attack tree that only combines attacker actions. The attack tree procedure will allow us to discard all the transitions that are not basic attacks and to output, in the form of a tree, a compact representation of complex attacks. Based on the attack graph (state space) generated in the previous section, we follow a simple way to transform this attack graph into an attack tree. Let (G, R) be an attack graph with a start state S0. Let Sv be a vulnerable state of the system (i.e., a state where a security breach has been detected). The security breach detected by that state is placed on the root of the attack tree. The goal is to collect all sequences of transformations (attacker actions only) that led to that state. We explore the attack graph from the target state (Sv) backward to the start state: each time we encounter a state with more than one incoming edges, we place an [Or] node in the attack tree (meaning that there is more than one way to reach that state), and each time we encounter a state with only one incoming edge, we place an [And] node in the attack tree. And finally each time we encounter a state with more than one outgoing edges, we place a sub-tree and check if we already computed that sub-tree. Sub-trees are attack trees that are present more than once inside a single attack tree (Fig. 8).


Example of attack graph to attack tree transformation
Using the example introduced in Fig. 1, we make a query (Fig. 7) to detect vulnerable states where the attacker can force the system into a state where the screen displays a modified speed. The results produced by the methodology are shown in Fig. 9.


Attack tree automatically produced from input model Fig. 1
The attack tree shows that the analysis of the modeled architecture identified three attacks.
-
Attack-1: where the attacker connects to the OBD port, eavesdrops on the CAN bus to dump the speed frame, then connects to the vehicle from the cellular network, exploits an exposed vulnerable service (S3) that has a write access on the CAN controller, and then replays the data
-
Attack-2: where the attacker connects to the OBD port, eavesdrops on the CAN bus to dump the speed frame, and then replays it from the OBD port on the same CAN bus.
-
Attack-3: where the attacker only operates from the cellular, connects to the cellular, exploits the exposed service, and then uses that service to eavesdrop on the CAN hardware to dump and then replay the speed frame
5 Countermeasure
We are interested in attack-3 where the attacker only operated from the cellular network attack vector. This attack seems important as it does not require a physical access to the vehicle. Analyzing the steps of the attack, if we can prevent at least one of the basic attacks from happening, we can prevent the whole attack from happening as it is an [And] node. It seems possible to either deploy a patch for the vulnerable service or to revoke the read access right of the service to the CAN controller. As a short-term solution, we opt for the second choice. Rerunning the simulation with the modified architecture produces the attack graph presented in Fig. 10.


Attack tree automatically produced from Architecture-1
We can see that now there are only two attack options for the attacker, since the service does not have a read access right to the CAN controller; the third attack scenario is no longer valid and hence not reported in the attack tree. The overall impact of the objective is affected because through the changes we made, we were able to block the attack path.
6 Conclusion
The chapter presents a modeling methodology using graph transformation to construct attack trees in order to analyze attacks to a connected vehicle. The attack tree synthesizes all possible attack paths with respect to the model and, thus, serves as the basis for further analysis. Impact quantification and sensitivity analysis can be conducted given such attack tree whose goal is to improve the overall security of an automotive architecture during design phase. The described methodology has nevertheless certain limitations due to required input data, which are:
-
A structural and behavioral model of the service nodes
-
A structural and behavioral model for hardware components
-
An attacker model
From the car manufacturer point of view, the fact that the modeling methodology requires architectural information of service nodes can be considered as a limitation as some software architecture and implementation tasks are outsourced to other companies.
References
P. Ammann, D. Wijesekera, S. Kaushik, Scalable, graph-based network vulnerability analysis, in Proceedings of the 9th ACM Conference on Computer and Communications Security (ACM, New York, 2002), pp. 217–224
L. Apvrille, Y. Roudier, Sysml-sec attack graphs: compact representations for complex attacks, in International Workshop on Graphical Models for Security (Springer, Berlin, 2015), pp. 35–49
L. Apvrille, L. Li, Y. Roudier, Model-driven engineering for designing safe and secure embedded systems, in Architecture-Centric Virtual Integration (ACVI), 2016 (IEEE, Piscataway, 2016), pp. 4–7
S. Checkoway, D. McCoy, B. Kantor, D. Anderson, H. Shacham, S. Savage, K. Koscher, A. Czeskis, F. Roesner, T. Kohno, et al., Comprehensive experimental analyses of automotive attack surfaces, in USENIX Security Symposium, San Francisco (2011)
T. Dimkov, W. Pieters, P. Hartel, Portunes: representing attack scenarios spanning through the physical, digital and social domain, in Joint Workshop on Automated Reasoning for Security Protocol Analysis and Issues in the Theory of Security (Springer, Berlin, 2010), pp. 112–129
I.D. Foster, A. Prudhomme, K. Koscher, S. Savage, Fast and vulnerable: a story of telematic failures, in WOOT’15 Proceedings of the 9th USENIX Conference on Offensive Technologies (2015)
Groove: graphs for object-oriented verification. http://groove.cs.utwente.nl/
T. Hoppe, S. Kiltz, J. Dittmann, Security threats to automotive can networks–practical examples and selected short-term countermeasures, in International Conference on Computer Safety, Reliability, and Security (Springer, Berlin, 2008), pp. 235–248
K. Ingols, R. Lippmann, K. Piwowarski, Practical attack graph generation for network defense, in 22nd Annual Computer Security Applications Conference, 2006. ACSAC’06 (IEEE, Piscataway, 2006), pp. 121–130
M.G. Ivanova, C.W. Probst, R.R. Hansen, F. Kammüller, Transforming graphical system models to graphical attack models, in International Workshop on Graphical Models for Security (Springer, Berlin, 2015), pp. 82–96
S. Jajodia, S. Noel, Topological vulnerability analysis, in Cyber Situational Awareness (Springer, Berlin, 2010), pp. 139–154
K. Koscher, A. Czeskis, F. Roesner, S. Patel, T. Kohno, S. Checkoway, D. McCoy, B. Kantor, D. Anderson, H. Shacham, et al., Experimental security analysis of a modern automobile, in 2010 IEEE Symposium on Security and Privacy (SP) (IEEE, Piscataway, 2010), pp. 447–462
R. Kumar, E. Ruijters, M. Stoelinga, Quantitative attack tree analysis via priced timed automata, in International Conference on Formal Modeling and Analysis of Timed Systems (Springer, Berlin, 2015), pp. 156–171
F. Lugou, L.W. Li, L. Apvrille, R. Ameur-Boulifa, Sysml models and model transformation for security, in Conferénce on Model-Driven Engineering and Software Development (Modelsward’2016) (2016)
C. Miller, C. Valasek, Remote exploitation of an unaltered passenger vehicle. Black Hat USA (2015)
X. Ou, S. Govindavajhala, A.W. Appel, Mulval: a logic-based network security analyzer, in USENIX Security (2005)
C. Phillips, L.P. Swiler, A graph-based system for network-vulnerability analysis, in Proceedings of the 1998 Workshop on New Security Paradigms (ACM, New York, 1998), pp. 71–79
R.W. Ritchey, P. Ammann, Using model checking to analyze network vulnerabilities, in SP’00 Proceedings of the 2000 IEEE Symposium on Security and Privacy (IEEE, Piscataway, 2000), pp. 156–165
M. Salfer, C. Eckert, Attack surface and vulnerability assessment of automotive electronic control units, in 2015 12th International Joint Conference on e-Business and Telecommunications (ICETE), vol. 4 (IEEE, Piscataway, 2015), pp. 317–326
M. Salfer, H. Schweppe, C. Eckert, Efficient attack forest construction for automotive on-board networks, in International Conference on Information Security (Springer, Berlin, 2014), pp. 442–453
B. Schneier, Attack trees. Dr. Dobbâs J. 24(12), 21–29 (1999)
O. Sheyner, J. Haines, S. Jha, R. Lippmann, J.M. Wing, Automated generation and analysis of attack graphs, in 2002 Proceedings IEEE Symposium on Security and Privacy (IEEE, Piscataway, 2002), pp. 273–284
Author information
Authors and Affiliations
Corresponding author
Editor information
Editors and Affiliations
Rights and permissions
Copyright information
© 2018 Springer Nature Switzerland AG
About this chapter
Cite this chapter
Karray, K., Danger, JL., Guilley, S., Abdelaziz Elaabid, M. (2018). Attack Tree Construction and Its Application to the Connected Vehicle. In: Koç, Ç.K. (eds) Cyber-Physical Systems Security. Springer, Cham. https://doi.org/10.1007/978-3-319-98935-8_9
Download citation
DOI: https://doi.org/10.1007/978-3-319-98935-8_9
Publisher Name: Springer, Cham
Print ISBN: 978-3-319-98934-1
Online ISBN: 978-3-319-98935-8
eBook Packages: Computer ScienceComputer Science (R0)