
Abstract
The paper proposes an analysis of the winter phenomena generated by severe persistent negative temperatures (over two months) and sudden changes in weather, as well as of the effects induced by these phenomena on the anthropogenic and natural environment. In the first chapter of the paper, a selective radiography of the main international and national publications related to the winter phenomena on the watercourses is done, with a focus on natural manifestations of ice jam type. A significant concentration of specialists and studies is noticeable in the Nordic world area or in countries with high mountain areas. Also in the first chapter, it provides information about the studied area—the upper watershed of Tisa River, in general, and the Romanian watershed of the upper Tisa, as a case study, as well as on the monitoring activity of the Romanian part of the study basin. The second chapter is dedicated to the presentation of three major components of this space—the morphological, climatic, and hydric—decisive general conditions for the winter phenomena that occurred on the watercourses. In the third part, and the most extended, the specific conditions of occurrence are analyzed at the level of detail (morphological and morphometric, weather conditions—with special regard to the synoptic, the temperature and precipitation variation in the study period), the anthropogenic conditions of the riverbed influence on the studied river sectors. It also includes an analysis on the rivers state, types of winter phenomena occurred during the December 1, 2016–February 14, 2017 period—where the complex winter chart was a great help in the correlation between parameters and in highlighting the phenomena severity—their evolution, monitoring, and management. At the end of this chapter, the variation of the river water levels reported to the defense levels is detailed, as of great significance in explaining the effects generated by natural occurrences. In the last part, issues related to the effects of the winter phenomena on the anthropogenic and natural environment are presented, with details on the produced damages according to the different categories of affected items. The most important aspect related to the consequences refers to damage limitation and the absence of human victims, due to the prompt, concerted, and synchronized actions of all the involved authorities and institutions.
Access provided by CONRICYT-eBooks. Download chapter PDF
Keywords
- Romanian watershed of the upper Tisa
- Specific conditions of occurrence
- Winter phenomena on rivers
- Complex winter chart
- Critical sectors
- Effects of the winter phenomena on rivers
1 Introduction—Literature About Winter Phenomena and Their Effects
Winter phenomena, normal manifestations on watercourses from the temperate zone, happen, more or less, depending on the factors that affect them. The frequency of these rises with latitude, but also with altitude, reaching maximum values at the northern periphery, and the southern one, of the continents, in the boreal hemisphere and less in the austral one.
Thanks to the decades of experience on observations and measurements in the hydrometric network R.W.N.A. (“Romanian Waters” National Administration), it is noted that on altitude the maximum frequency of those belongs to the mountain area, the birth place of the flowing, marked by high precipitations and low thermic environments, especially at its periphery. Winter phenomena occur with a lower frequency in the hilly area as well, because of the agglomerations of ice blocks from other effluents.
A season with ice on a river can last over 100 days for the most of the rivers in Scandinavia, Russia, and Canada, and it can descend until latitudes of 42° and 30° N in North America and Asia (Bates and Billelo 1966; Rădoane et al. 2008, 2010).
From all the categories of river winter phenomena, ice needles, ice at the shore, broken ice bridge, ice bridge with water eyes, compact ice bridge, water flows over the ice bridge, ice blocks flowing, etc. (N.I.M.H.—National Institute of Meteorology and Hydrology 1966), the most dangerous seems to be, without a doubt, the one of the ice jams. These massive agglomerations of ice, formed at narrowing of water courses or at obstacles in the river bed, can block effectively the water draining, causing quick and massive floods or destructive mechanical actions generated by the gigantic ice blocks, with catastrophic effects (Fig. 7.1). On the other hand, the authors are supporting the fact that ice jams are being the most hazardous river winter phenomena (Ashton 1986; Rădoane et al. 2008, 2010).

Ice jam, giant ice blocks, and the after-effects—February 2017, Vaser Valley (photos made by S.T.W.B.A.—“Someș-Tisa” Water Basin Administration, M.W.M.S.—Maramureș Water Management System)
The specialized literature is full of published materials about hazards and the hydric risks and, of course, about the river winter phenomena and their effects; the references about the winter phenomena are related especially to Canada, USA, Iceland, Scandinavia, Russia, Japan, China, etc. (Derecki and Quinn 1986; Belatos 2008; Prowse and Conly 1998; Prowse and Beltaos 2002; Jasek 2003; Kowalczyk and Hicks 2003; Shen and Liu 2003; Prowse and Bonsal 2004; Morse and Hicks 2005; Korytny and Kichigina 2006; Daly 2009; Kolerski and Shen 2010; Kolerski 2014; Wang et al. 2014; Kolerski and Shen 2015; Lagadec et al. 2015; Shen 2016; Koegel et al. 2017; Kraatz et al. 2017; Zeleňáková and Zvijáková 2017).
In fact, Cold Regions Research and Engineering Laboratory (CRREL) of the US Army Corps of Engineers devotes virtual platforms and in-depth studies of the winter phenomena, ice in general, its effects and of the different measures of management and attenuation of the effects (http://www.erdc.usace.army.mil/Locations/CRREL/)—quoted by White and Eames (1999) and White et al. (2007), USACE (1984) or Government of Alberta (2013), and some famous magazines devote special editions—e.g., Hydrological Processes, Volume 19, Issue 1, January 2005, Special Issue: Canadian Geophysical Union—Hydrology Section.
Some studies refer to the causes and the climatic impact over the formation and evolution of the winter phenomena on rivers (Beltaos and Prowse 2001; Beltaos 2007; Beltaos and Burrell 2015).
Many studies are meant for analyzing the formation process of the ice jams, in some case starting form dynamic factors, e.g., the existence of waves and ice blocks (Nafziger et al. 2016; Pawlowski 2016).
Some of the publications are meant for mapping and modeling of the ice formations and the analysis of the flood risk induced by the winter phenomena, especially in ice jams (Beltaos 1993; She and Hicks 2006; Lindenschmidt et al. 2016; Boivin et al. 2017).
Other publications refer at the dynamic/mobility of the ice in ice jams under the influence of some allogenic or autogenous factors, the impact (Beltaos 1990; Lu et al. 1999; Shen et al. 2000; Liu and Shen 2004; Shen et al. 2008; Huang et al. 2016; Wang et al. 2015a, b, 2016; Zare et al. 2016).
Some publications aim for the study of the ice and the ice blocks made along the narrows and channels (Lucie et al. 2017).
The water flow and silt draining under the effect of frost and the modeling of this process is another subject chosen by the researchers (Thériault et al. 2010; Beltaos 2016; Beltaos and Burrell 2016a, b; Robb et al. 2016).
Other researchers tried even other methods of predictions of the floods generated by the winter phenomena, starting from hydro-meteorological (Gholamreza-Kashi 2016).
Some of the authors made some studies about the elements that cause the hydraulic of the river bed and, naturally, the formation and evolution of the winter phenomena on rivers (Leopold and Maddock 1953; Leopold et al. 1964; Rhodes 1977; Ichim and Rădoane 1986; Ichim et al. 1989; Rădoane et al. 2008, 2010).
The same authors support the fact that the knowledge of geometrical hydraulic is important, namely as basis for the identification of stable sections from a dynamic point of view (so necessary in the design programs), as well as for the transit of the freeze-up jams and ice along the river.
Moreover, the authors consider that under the circumstances of winter phenomena affected riverbed, the hydraulic geometry is totally disordered. The width of the riverbed is narrowing, and the depth of the riverbed decreases. Thus, the water is forced to flow more rapidly in order to continue its course (Rădoane et al. 2008, 2010).
In Romania, beside the national hydrometric network, where the regular five day between observations of the winter phenomena on rivers is the norm (intensified at hourly level in exceptional cases) (N.I.M.H. 1966 and other sources), numerous researchers conducted and are now conducting studies of these phenomena.
The history of the special research goes all the way to the period of development of the hydrometric activity, the 1960s, when some very rigorous technical instructions were elaborated. Some of them are applied even today, while others were substituted or completed with modern work methods.
From the Romanian researchers dedicated to this domain in the pioneering period, we are mentioning: Semenescu (1960), Constantinescu (1964), Ciaglic (1965), etc.
Further, other studies of scale about hazards and hydric risks were added, materialized in books or doctoral thesis, international publications, within which the area of the specialists has widened, from hydrologists, to hydrotechnical engineers, geomorphologists, and even climatologists, which contributed with works about the cause of the winter phenomena or about their effects on the river floods.
From these, some of the most representative works were written by: Miţă (1977), Mustăţea (1996), Sorocovschi et al. (2002), Colceriu (2002, 2003, 2010), Păvăleanu (2003), Romanescu (2003, 2005, 2015), Rădoane (2004), Surdeanu et al. (2005), Ştefănache (2007a, b), Rădoane et al. (2008, 2010), Giurma and Stefanache (2010), Romanescu and Bounegru (2012), Găman (2014), Cojoc et al. (2015), Romanescu et al. (2015), Romanescu and Stoleriu (2017).
2 The Upper Tisa Watershed and Studied Sub-basins in Regional and National Context
The upper basin of Tisa mostly overlaps with the historic Basin of Maramures—from which, only a third is located on the Romanian territory, and with the southwest part of Ukraine—Transcarpatic Region, with the sections Rahiv, Tiaciv, Hust, and Mijgiria (the largest basin in the Carpathian Mountains). This is a territory well individualized from the geographic point of view, thanks to the outer mountain formations and to the petrographic mosaic, which led to a different and complex evolution of the region (Chiş and Kosinszki 2011; Sabău et al. 2017) (Fig. 7.2).

(adapted and completed after Lukiantes and Obodovskyi, 2015 and from Photograph source 1 & 2—see References)
Upper Tisa watershed on the Romanian and Ukrainian territories
The mentioned area, along with the outer high zone, displays a diversified landform, ranging from riversides and valley couloirs to mountains. The minimal altitude is 157 m at the exit of the Tisa River from the basin, while the highest altitude is located in Rodna Mountains, at the “Pietrosu Rodnei” peak 2303 m (Posea et al. 1980; Ardelean and Béres 2000; Boar 2005; Cocuţ 2008).
The area of the basin, excluding the basin of Tur and other affluent watercourses in the mentioned zone, is 10,354 km2, from which 3381 km2 (about a third) is located in Romania and 6973 km2 (the other two thirds) in Ukraine (Chiş and Kosinszki 2011).
In the Ukrainian part (the right slope), the basin is better developed, thanks to many important right effluents (Kisva, Shopurka, Apshytsia, Teresva, Tereblia şi Rika), which create a confluence of many watercourses at the base of the mountain.
In the Romanian part of the basin (the left slope), there are only two important effluents (Vişeu and Iza), while the “Săpânţa” and “Şugătagul Mare” rivers contribute in a less measure to the development of the basin, because of the existence of the andesitic massif of Igniș Mountains in the south (Fig. 7.2).
Besides, from the two watercourses only the Vișeu River displays similar mountain characteristics like the Ukrainian rivers, because Iza collects a good percent of its discharge from the median hill zones of the basin of Maramureș. Only the left affluent, Mara, brings a share from the mountain area, though influenced by the hydrotechnical arrangements (Fig. 7.3).

Source Authors
Position of the analyzed sub-basins and of the study sectors in national context.
In contrast to the Ukrainian part of the basin, which has a larger opening to the Panonic Basin, the Romanian part of the basin is opened only to the northwest, to west and south being closed by the neogen volcanic chain of the Oaș–Gutâi–Țibleș Mountains (Fig. 7.3). This natural organization enables cold air mass advections from north and important thermic inversions on the lower basin area which determines specific characteristics of winter flow on the two rivers.
3 The Hydrometric Monitoring Network and the Observation and Gauging Program
As a basin space with a strong asymmetric character (the Viseu River on the right and Iza on the left), which drains slopes with high humidity and a circularity degree almost unitary, the area of the study has been monitored from a hydrometric and pluviometric point of view since the middle of the twentieth century, with the purpose of water management and control of the risky hydric phenomena.
The Tisa collector fell under the incidence of complex monitoring only after 2000 (before only the water level was tracked at the hydrometric station of Sighetu Marmatiei), when the bases of the border cooperation between Romania and Ukraine were laid in this field.
Currently, for the Tisa collector (at the entrance on the Romanian territory and in the urban zone of Sighetu Marmatiei), and as well as the other two important rivers of Maramures, Viesu and Iza, stations for hydric and weather monitoring were organized in key areas. They were chosen either in flow formation (upper basins) or in water-gathering areas (after important confluences with different large tributaries) (Fig. 7.4).

Maximum flow management plan in the Romanian basin of upper Tisa (after S.T.B.W.A. 2016)
The quality of the monitoring and the efficiency of the forecasts and of the population mobilization in emergency situations increased proportionally with general implementation of the warning levels on rivers and their afferent alert codes (Fig. 7.4).
The observation and gauging program from the river hydrometric stations targets parameters of high importance for the monitoring and management of the water resources and of dangerous hydrological and meteorological phenomena: the water level, the temperature of air and water, the rainfall, the winter phenomena, the deepening of the riverbed, the speed of the water flow, the turbidity, the water pollution, the dynamics of the riverbed, etc.
The examinations are done frequently (6.00 AM and 6.00 PM, summer time; 7.00 AM and 5.00 PM, winter time), or even more often (hourly) at the manifestation of extreme hydric events (the surpassing of the warning level) or of winter phenomena, if these are developing negatively in the area of occurrence (N.I.H.W.M.—The National Institute of Hydrology and Water Management 2013).
To ensure a more efficient gauging, automated hydrometric stations for the basin water balance were introduced on important watercourses or on the ones with increased chance of floods (with the help of DESWAT programs—Destructive Waters and WATMAN—Informational System for the Integrated Water Management). These grant the possibility of live monitoring of some parameters measured by sensors.
The measurements of liquid discharge or of river deposits in suspension are done in a less frequent manner (once every five days), being intensified at hydric events, at even hourly frequency on the smaller rivers.
The measurements of winter phenomena are done every five days, and those of submerged vegetation, every ten days.
4 Sources and Techniques
The text was organized using information gathered through the personal investigations of the project’s staff, as well some articles, studies, and scientific reports elaborated by other consecrated researchers, or by institutions administrating the hydric environment and natural resources from Romania (S.T.W.B.A.)
The technical data regarding the hydrographical basins and the watercourses, on which analysis was based, were taken partially from the Atlas of Water Cadastre from Romania, 1992, partially from the statistics of colleagues from S.T.W.B.A., or the data were generated in PC program “GIS” (ArcGIS 10.x).
The elements regarding the winter phenomena and their production cause came from the hydrometric activity of S.T.W.B.A. The elements were either calculated in PC statistic programs (Microsoft Office 2016, SPSS) or gathered according to syntheses and studies made at the above regional institution.
The support for GIS modeling was constituted from plans 1:5.000, topographic maps 1:23.000, ortophotoplans and other satellite imagery, hazard and risk maps for floods (A.N.A.R.), coordinates and GPS files from different sources (terrain research and bibliographical). The digital mapping, the files conversion, and the modeling were made in PC specific programs (GPS Utility, Global Mapper, ArcGIS 10.x, etc.).
5 Major Components of the Natural Landscape Influencing the Winter Phenomena in the Upper Tisa Watershed
5.1 Morphological Component
The existence of magmatic and crystalline rocks gives massiveness and peripheral scale to the basin, aspect equally reverberated in the ascension of the morphologic structures (with altitudes that exceed 2000 m in the southeastern part of the region). The sedimentary component characterizes the lower zones in the inner part of the area, and along with the other petrographic formations, stamp the watercourses in the area with distinct quantitative and qualitative characteristics.
In its entirety, the relief is organized on many altitudinal and structural levels (Posea et al. 1980; Pop 2000; Boar 2005; Chiş and Kosinszki 2011) (Fig. 7.2):
-
the mountain component, which closes the basin at the periphery, respectively, the mountains of Maramureş, Rodna, Ţibleş, Lăpuş, Gutâi, Igniş, Oaş, Hust, Borzhava, Gorgany, Pyslikonia, Kedryn, Krasna, Svydovets, and Chornohora;
-
the piedmont structure, given by the piedmonts of Borşa, Văratec, Gutâi, and Mara-Săpânţa;
-
the component of the glacis—the glacises of Săcel and Vişeu;
-
the hill component, namely the interfluve between the Iza and Vişeu Rivers;
-
the plateau structure—the Hust-Apşa table land;
-
the basin component, developed frequently under the form of larger basins in confluence areas—Borşa, Vişeu, Ruscova, Bârsana, Vadu Izei, Mara, Rona, Sighet, Yasynia, Chorna, Synevyr Kolochava, and Studeniy Mizhgiria;
-
the valley couloirs—Vişeu, Iza, Tisa, Shopurka, Apshytsia, Teresna, Tereblia, and Rika;
-
gorges—Vişeu, Surduc and Tisa;
-
the larger riversides—the riverside of Tisa.
The connection of the Maramureș Basin with the other neighboring regions, in the Romanian sector, is made through the altitude passes: Huta 587 m to Oaş Basin, Gutâi 987 m to Baia Mare Basin, Neteda 1040 m to Lăpuş Basin, Şetref 818 m to Someşan, and Prislop table land 1416 m to Obcinele Bucovinei Mountains.
By its traits and by its defining elements (the mountain basin character, slope orientation, slope, depth of the fragmentation, drainage density, etc.), the relief engrains local specificities, with important effects on the climate and hydrological phenomena and processes (Ujvári 1972; Sabău et al. 2017).
5.2 The Climatic Component
The relief organization generates the climatic specifics as well, among other invasions of cold air masses with a scandinavian-baltic origin along the basin corridor and important thermic inversions in the core area of Maramures Basin, etc., which give specific characteristics of winter flowing on the two collecting rivers Viseu and Iza and on their main tributaries.
Regarding the average yearly temperatures of the air (between the 1961s and the 2000s), the Basin of Maramures and the afferent mountain zone fit in the interval 9–0 °C (Climate of Romania 2008, p. 135).
Referring to January, for the area of study, the same source highlights the following:
-
the average temperature of the soil surface varies between −5 and 1 °C; the absolute extreme minimum was recorded at Sighetul Marmatiei (−33.5 °C), on January 25, 1963;
-
the average air temperature in January varies between −3 and 8 °C, and the average of daily minimum temperature of the air varies between −6 and −12 °C (Fig. 7.5a, b);
Fig. 7.5 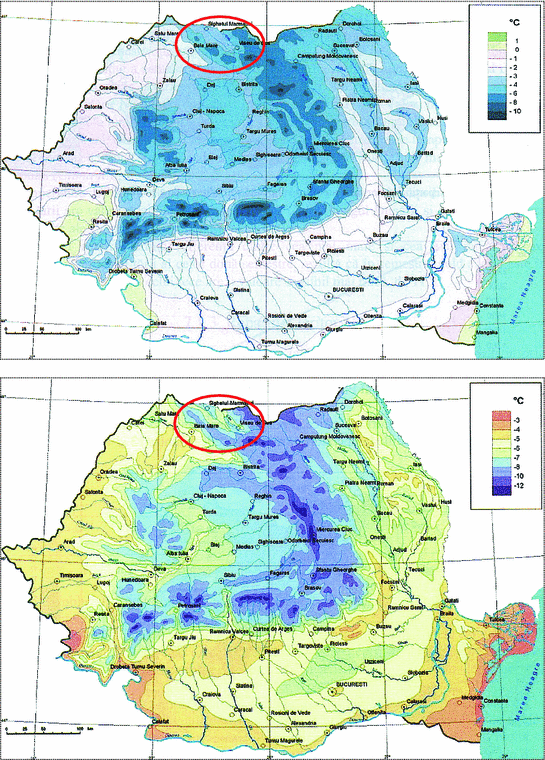
Variation of the average air temperature (above) and the average of the minimum daily temperature of the air (beneath) in January between the 1961s and the 2000s (after Climate of Romania 2008)
-
the yearly average number of days with frost (tmin. ≤ 0 °C) varies between 100 in the lower zone of the basin and 180 in the high peripheral zone;
-
the yearly average number of frosty nights (tmin. ≤ −10 °C) varies between 20 in the lower zone and 70 in the high one;
-
the yearly average number of winter days (tmin. ≤ −10 °C) varies between 30 in the lower zone and 110 in the high zone for south and east.

These thermic particularities occur on the background of frequent cold air invasions brought by ridges of the Siberian Anticyclone, sometimes in junction with the one of the Azoric Anticyclone and of the ones brought by the thalweg of Islandice Low Pressure, with the route over the Baltic Sea.
The values of the multiannual average precipitation are high and rising with altitude: On the core area of Maramures Basin, the multiannual averages vary around the value of 700 mm, rising significantly at over 1200 mm in the massive of Rodna, Ţibleş, Igniş, Gutâi, Oaş, Hust, Borzhava, Krdryn, Krasna, and Pyslikoniaiar and approaching or surpassing 1400 mm in the mountains of Maramureş, Chornohora, Svydovets, and Gorgany (Ujvári 1972; Cocuţ 2008; Chiş and Kosinszki 2011) (Fig. 7.6).

Multiannual isohyets of the average precipitation in the Basin of Tisa (after Sub-Basin Level Flood Action Plan Tisza River Basin 2009)
The values are confirmed also in the reference work for the Romanian territory (Climate of Romania 2008, p. 262).
The surplus of precipitation, extremely obvious in the upper basin of Tisa, generates an equally maximum flow, with multiple extreme hydric events and with frequent exceeding of the warning levels on watercourses.
5.3 The Hydric Component
Tisa, the collector river with a length of 209 km on the Ukrainian territory, is the sum of the Black Tisa (Chorna Tysa) and the White Tisa (Bila Tisa), united at 4-km north from Rakhiv (Fig. 7.2).
The Black Tisa has the spring on the northeastern slope of the Svydovets Mountains (the Massive of Okoly) at an altitude of 1400 m. It has a length of 49 km, and a hydrographical basin unfolded on a surface of 567 km2 (entirely in the mountain space), which defines the hydrological regime and the aspect of the valley, deep and sinuous. The width of the riverbed oscillates between 10 and 25–50 m, and the depth of it varies between 0.5 and 2 m in the summertime and 4–6 m during the high-water period. The speed of the current is 1 and 1.5 m per second in the middle of the estival season, and the medium discharge is at about 12.3 m3/s in the Bilyn section. Near Yasinia, it receives an important left affluent, the Lazeschyna River (Yatsyk and Byshovets 1991; Paparyha et al. 2011).
The White Tisa has the spring on the western slope of the Chornohora Massif in the region of Korbul, at an altitude of 1600 m, and it follows an east–west direction, separating the Chronohora Massif from the Rakhiv Massif. It is a typical mountain river with medium high slopes (10 m/km) and a deep narrow valley, a little sinuous, with steep and wooded slopes, which frequently presents a canyon aspect. The river has 19 km in length and a 489 km2 surface of the basin (Yatsyk and Byshovets 1991). The medium speed of the water is 2–3 m/s, and the medium discharge is app. 13.5 m3/s, in the section of Roztoky (Paparyha et al. 2011).
The most important right effluents of Tisa are Kisva, Shopurka, Apshytsia, Teresva, Tereblia, and Rika. The left ones are Vişeu, Iza, and Săpânţa (Ujvári 1972; Bashta and Potish 2007; Chiş and Kosinszki 2011) (Fig. 7.2).
On the Romanian territory of the Maramureş basin and of the surrounding mountain area, the main autochthonous watercourses collected by Tisa are Vişeu with a surface of 1581 km2 and a total length of 82 km, Iza with a surface of 1293 km2 and a total length of 80 km. The other left effluents that flow on a SE-NV direction, Săpânţa and Şugătagul Mare, are less important (Fig. 7.3).
In this area, the rivers are characterized by a medium slope with values between 0.2 and 8.9‰ and a sinuous coefficient between 1.04 and 2.16. The hydrographical basins with surfaces larger than 100 km2 are eleven. Furthermore, the medium altitudes are relatively high, a fact that indicates (theoretically, along with the resistance to erosion) a high hydro-energetic potential in the mountains of Rodna and Maramures, Gutîi and Ţibleş (The Atlas of Water Cadastre of Romania 1992).
The density of hydrographical network in the Romanian basin has values between 0.5 km/km2 in the lower part of the basin and 0.8 km/km2 in the mountain zone.
For the Tisa River, at the exit from the Romanian territory, it was calculated a multiannual medium discharge of 130 m3/s (specific discharge of 20.2 1/s.km2), with significant hydrologic contribution from the Romanian territory because of the rivers of Vişeu (33.9 m3/s) and Iza (16.6 m3/s). The Tisa River has a specific discharge three times higher than the Someş River, even though the surface of Tisa’s basin is half of Someş, because of the high recorded precipitations in the reception basin (S.T.B.W.A. 2015).
The height of the flow reveals the existence of abundant liquid flow in the studied space, with values that exceed 1000 mm, confirmed also by Flood Protection Expert Group, Hungary, Romania, Slovakia, Serbia, Ukraine, 2009, and by the GIS models made afterward by S.T.B.W.A. (2015) and the other authors of this study (Fig. 7.5).
Tisa and its effluents in the study zone have a Carpathian-type hydrologic regime, having the maximum volume of the flow in the month of April and the minimum volume in winter (Ujvári 1972; Sorocovschi and Şerban 2012).
The Carpathian regime type (TC) is characterized by vertical zoning of the hydric regime elements. Thus, in winter, along with the growth of the altitude, the period with low waters is longer and the floods’ frequency decreases. In spring, the period of the nivo-pluvial waters rises simultaneously with the delay of the snow melting period ending. At altitudes that exceed 1200–1400 m, the high waters of spring are followed directly by the pluvio-nival waters of summer, which last 3–4 months.
The Western Carpathian subtype (CW) is specific, on a limited area in the Basin of Mara, for the volcanic mountains of Oaş-Igniş. The main characteristic of this subtype regime is relatively early beginning of the high spring waters, which last 1–2 months (May–April). Then, the floods from the beginning of summer come, which transform in high waters. The hydric phases continue with summer low waters and fall floods, which are having a frequency of about 30–40%. In winter, the genesis of the catastrophic nivo-pluvial floods is possible, determined by sudden invasions of warm air. At altitudes beyond 1000 m, the minimum flow happens in winter and in the lower regions, in summer or fall.
The Transylvanian Carpathian (TC) subtype is specific to rivers that have the source under altitudes of 1600–1800 m, on the western slopes of the Oriental Carpathians, as well to a limited area in the Mountains of Maramureş. It has similarities with the Western Carpathian subtype, with the only discrepancy that in winter time the low waters predominate. The nivo-pluvial floods from this period have a frequency of only 10–20%. The water supply type of the rivers is pluvio-nival and moderate subterranean (Ujvári 1972; Sorocovschi and Şerban 2012) (Fig. 7.7).

Multiannual values of the medium flow layer (Y—mm) in the basin of Tisa (after Sub-Basin Level Flood Action Plan Tisza River Basin, 2009)
6 The Specific Conditions of Winter Phenomenon Developing Between December 1, 2016, and February 14, 2017
The watercourses, which recorded the most severe winter phenomenon, followed by unusual events, were the Tisa river collector, its affluent Iza and less the Viseu River, like other effluents of them: Vaser, effluent of Viseu—the most severe case, Mara affluent of Iza and Cosău effluent of Mara (Figs. 7.3 and 7.8).

Source Authors
Detail of critic sectors on the case studies.
Their position, as well other characteristics and special conditions in which were these watercourses, generated particularities for each one of them, helping some critical sectors to appear.
6.1 The Morphologic and Morphometric Conditions
One of the most targeted sectors and spaces of produced phenomenon was the confluence ones, the low zones from the connection of the watercourses, where the ice blocks that came from upstream were massively crowded. In this manner are all the cases mentioned above, less the Viseu River (Fig. 7.8).
Another category of sectors with problems was the gorge-type ones, where the variation between the narrowing sectors and the stretching ones created optimal conditions for the narrowing of the ice blocks. In this situation is also, firstly, the Vaser River, along with its collector the Viseu River, on the sector before the confluence with Tisa (Fig. 7.8).
The sinuosity of the watercourses was another element, which favoured the chaotic movement and the agglomeration of the ice blocks. No matter that it was of topographic or hydraulic origin it combined with narrowing’s of the flowing sectors due to the anthropic factor after other riverine improvements (Table 7.1; Fig. 7.8).
From all analyzed watercourses, as can be seen in Table 7.1, the Vaser and it collector Viseu Rivers are outstanding with the biggest values of the sinuosity, in both cases mostly of topographic origin. Lower values, but spatially important, are also recorded on Iza and Mara rivers in the lower confluence zone near the city of Sighetul Marmației.
An element, again, extremely important is the aspect of the longitudinal profiles of the analyzed watercourses and their medium slope (Fig. 7.9).

Source Authors
Longitudinal profiles of the analyzed watercourses and the critical sectors, affected by the flowing and the agglomerations of ice.
Excepting the Tisa collector, which enter the Romanian territory only at an altitude of 400 m, all the other rivers have their source at altitudes that exceed 1000 m, the Viseu River even beyond 1600 m, and the Vaser River at altitudes beyond 1400 m. As shown in Fig. 7.9, all ice agglomerations of ice jam type, followed by the critical sectors of induced effects manifestation, were produced on lower courses of the analyzed rivers, except Tisa, where the ice jam and its effects have targeted narrowing the area at the confluence with the Viseu River. Also in the case of Vaser River, the ice jam was formed in the medium zone of the profile, but the effect was felt until the shedding.
Three of the cases of ice agglomerations were stronger in the upstream sector (Tisa, Mara, and on a less portion the Viseu River), and in the other three cases, the effects manifested mostly downstream (Iza, Cosăul, and especially Vaser).
An important contribution in the manifestation of the phenomena had, also, the slope, which, associated with other morphological and morphometric elements, favored the congestion and stagnation of the ice floes (Fig. 7.9).
In most of the cases, high values of the slope can be seen in the upper sectors of the rivers, where the mountain stage stands out, while in the lower sectors its values are decreasing a lot.
On the critical sectors, the slope was different, form river to river, very high values standing out in the case of Vaser and Viseu rivers (above 11‰), while on the other watercourses the values were under 8‰.
6.2 Weather Conditions
The winter phenomena analyzed in this very study have been generated by persistent negative temperatures (approximately two months) and by sudden weather changes. The winter of 2016–2017 was dominated by prolonged cold weather; extreme negative temperatures were recorded, starting from December until the end of January (Lucza 2017).
In December, the winter has set in normally, with the persistence of the anticyclone regime and stable weather, but in the upcoming months, January and February, negative and positive thermic anomalies have been recorded. While in December the medium temperature in Maramureş has been of −4.6 °C, in January the medium temperature was −7.5 °C, with approximately 3.0 °C less than the multiannual monthly average. At the beginning of January, the weather was extremely cold and the minimum temperature value recorded on interval was −25.9 °C (recorded on the January 10, 2017, at the Târgu Lăpuş meteorological station).
Even though the quantities of fallen precipitation in the period between December 2016 and January 2017 did not overcome the multiannual average values, because of the negative temperatures, the precipitation was almost in form of snow. The thickness of the snow layer and the water supplies accumulated by it have risen in the whole period, so as until on January 31 the water equivalent from the snow layer in the basin of Viseu was of 96.46 mil. m3 and of 71.41 mil. m3 in the basin of Iza.
The persistence of the negative temperatures has driven to the formation of winter phenomena on watercourses, the thickness of the ice rising directly proportional with the intensity of the frost. On the watercourses of Maramures, the first winter phenomenon appeared on the December 4, 2016, and until the beginning of January, the ice bridge has been installed on all the watercourses of the mountain zone, with measured thicknesses up to 38–40 cm in the hydrometric stations section.
After the severe frosting from January, in the first days of February, under the circumstances of an advection of warm and damp air, the quick melting of the snow and the heating of the air started. Between the 2 and 3 February on the southern slope of the Gutâi mountains, at the Cavnic pluviometric station there were recorded quantities of liquid precipitation with values of 90 mm. Thus, the total values between 2 and 6 February were 170 mm.
Though the majority of the fallen precipitation in areas with the altitude below 1300 m was in liquid form, the thick layer of the snow acted as a sponge. Thus, the flowing and gathering of the water in watercourses was slowed. However, the sudden warming, which persisted for a few days, with positive minimum temperatures associated with high precipitation, caused the melting of wet snow. On February 3, 06 AM local time, the maximum temperature of 5.2 °C was recorded at the Sighetu Marmaţiei hydrological station.
Under these circumstances, the abundant nivo-pluvial input has determined the emergence of floods on the upper sections of watercourses. As a result, the level fluctuations destroyed the ice formations accumulated on watercourses, mobilizing and dislocating them downstream, where ice jams were formed at narrower sections. The water supplies of the rivers being supplemented also from the low precipitation fallen between the 5 and 6 February.
6.2.1 Synoptic Conditions
In December, the ridge of Azoric and Siberian anticyclones were united all over the south of Europe forming a high-pressure belt which persists, having more southern positions while descending to lower latitudes of the polar front during the cold season (Fig. 7.10).

Source www.wetter3.de
Distribution of the geopotential field at a level of 500 hPa (damgp), of ground-level pressure field (hPa), and of relative topography 500–1000 hPa: December 21st, 2016 at 12.00 UTC.
The winter started normally with the persistence of the anticyclonic regime and stable weather in the most part of the Balkans and Central Europe. The short invasion of a moist air mass, then of cold air waves, happened at the beginning of the month, followed by a temperature drop between December 12th and 17th (Fig. 7.11).

Source www.wetter3.de
Distribution of the geopotential field at a level of 500 hPa (damgp), of ground-level pressure field (hPa), and of relative topography 500–1000 hPa: December 17th at 12.00 UTC.
The period between December 18th and 25th was characterized by stability, thanks to the dense and cold air mass persistence, which generated dryness.
Starting with the December 29th, the invasion of the cold air continued at the medium troposphere level on the northwest direction. Alongside with the frontal passage, slight precipitation, dispersed snow or rain, and mostly, a new cooling was registered.
In the month of January, the baric gradients rose as a result of the deepening of the Icelandic Low Pressure under 985 hPa and also the rising of pressure to over 1040 hPa in the centre of the Azoric Anticyclone (Fig. 7.12).

Source www.wetter3.de
Distribution of the geopotential field at a level of 500 hPa (damgp), of ground pressure field (hPa), and of relative topography 500–1000 hPa: January 7th 2017 at 06.00 UTC.
Between December 26th and 29th, because of a direct polar circulation and of advection of a more humid arctic maritime air, insignificant precipitation with values of 10–20 mm was recorded.
This determined an evident intensification of the atmospheric circulation especially in the northern half of the continent. In the southeastern part of the continent, as a result of the anticyclonic belt emergence through the blending of the Azoric Anticyclone with the Siberian one, as well as of weakening of the cyclonic activity in the Mediterranean basin, the circulation of the air is less intense. Under these conditions, the anticyclonic regime was rarely disrupted by short invasions from the northern sector, furthered by the fluctuations of the southern waves of the jet stream (Fig. 7.13).

Source www.wetter3.de
Distribution of the geopotential field at a level of 500 hPa (damgp), of ground pressure field (hPa), and of relative topography 500–1000 hPa: January 1st, 2017 at 12.00 UTC.
In the first part of January, almost the whole continent was under the influence of an anticyclonic field at the ground level, whose ridge stretched from the Biscaya Bay to the Carpathians, on a west–east direction (Fig. 7.13). While the eastern zones, from the front part, were dominated by a mass of cold air, the central zones and the western part of the continent were affected by the relatively warm air. In this context, because the Basin of Maramureş is located in the east, it was affected by a frosty weather.
Meanwhile, due to a polar direct circulation, the cold mobile cyclone has moved from Greenland, along the Northern Sea, to the Central European Plain and to the Alps, consequently to the east. Hence, the decreasing of the air pressure at ground level, followed by the strengthening of the baric gradient in the geopotential zone from the medium layers of the troposphere, occurred on the Romanian territory, too.
The continuous advection of the polar continental air mass with a strong northern circulation caused the terminating of the cyclone circulation over the Balkans Mountains and the Adriatic Sea.
The afterward deforming of the polar jet stream, along with the growth of the amplitude of the southern waves, determined, beginning with 6 January, an intensive advection of the polar continental air mass, first in Central Europe, Pannonian Plain, the Balkans Mountains and the Adriatic Sea, then to the northeastern coast of Africa and the east of Mediterranean Sea (Fig. 7.14).

Distribution of the jet stream at the level of 500 hPa: January 6th, 2017, at 18.00 GMT.
So, the extreme temperatures registered between January 1st and 10th were generated by this synoptic situation, when the lowest temperature of −25.9 °C was recorded (the interval of consistent extension of the ice thickness on watercourses from the basin of Maramureş).
The cyclone of high altitude already formed on the 6th of January, with very low values of the geopotential at the isobaric surface of 500 hPa and relative of 1000/500 hPa, the very cold relative of 1000/850 hPa, indicates a mass of continental arctic air (Fig. 7.15).

Source www.wetter3.de
Distribution of the geopotential field at a level of 500 hPa (damgp), of ground pressure field (hPa), and of relative topography 500–1000 hPa: January 9th, 2017 at 00.00 UTC.
In the following days, until the 8th of January, the cold air continuous advection from north led to the formation of a “cold air lake” over the basin of Maramureş. At the same time, a subsidence regime dominated the inferior layer of the troposphere at the periphery of the anticyclone, which stretched out on the most part of the continent.
Until the 12th of January, the Maramureş is under the influence of polar air masses between the cyclonic circulations of altitude, also the waves of humid air at the periphery of the surface anticyclone, coming from the central parts of the Europe, which brought occasional snow. Some snow was recorded occasionally at night and discontinuously, in the mountain area, too.
The transformation of air masses occurred on the 12th of January, after the gradual decrease of the pressure, under the influence of a set of fronts from northwest in the interior of the cyclone, which developed on the most part of the continent. After the passing of the atmospheric fronts, dominated by a higher pressure of the air at the terrestrial surface, the weather was characterized by the fog phenomenon, along with the progressive decrease of the temperature.
Until the 24th of January, the cold anticyclonic regime predominated, with short forays of the low disturbing fronts. Between the 24th and 27th of January, the anticyclonic regime persisted in the entire east part of the continent, from the Central European Plain to the Ural Mountains and to the south, to the surface cyclone of the Mediterranean zone. The maximum barometric was centered in Maramures on the 26th of January, and it was characterized by a nebulosity and fog decrease, as well as by some sunny weather periods. Hence, after eight days with frost the daily temperature surpassed 0 °C in most of the settlements of Maramures.
Due to a direct polar circulation, the mobile cyclone moved over the Central Europe to the east. Until the 31 of January, the Maramures was located in the mass of cold air of the ridge, where the high pressure and the cold weather persisted (Fig. 7.16).

Source www.wetter3.de
Distribution of the geopotential field at a level of 500 hPa (damgp), of ground pressure field (hPa), and of relative topography 500–1000 hPa: January 31st, 2017 at 12.00 UTC.
The last day of January, was marked by the shifting of the cyclone and of its cold air waves from the Central Europe to the northeast (with its periphery it disturbed the base layer of the thermic inversion).
On a background of tropical circulation, the geopotential increase and the advection of the warmer air from the south led to weather instability in Maramures at the beginning of the month, with temperatures significantly higher than the average for the first ten days of February.
Nevertheless, the persistence of the cyclone, which dominated the weather from the western part of the Europe, generated a pressure reduction over the Balkans.
The incursion of cold air from the Genova Bay was followed by the emerging of a mobile cyclone in the zone of cyclogenesis, both happening on the 5th of February. The cyclone with the frontal zone transferred over the Apennines to the east of Mediterranean, fed with humidity, followed afterward a trans-Balkanic trajectory. This fact caused raining and snowing in the mountain zone with higher intensity in the southern part of the Maramureş (Fig. 7.17).

Source www.wetter3.de
Distribution of the geopotential field at a level of 500 hPa (damgp), of ground pressure field (hPa), and of relative topography 500–1000 hPa: January 31, 2017 at 12.00 UTC.
This type of circulation brought a mass of maritime tropical air from the Atlantic Ocean and the Mediterranean Sea, which caused the warming of the weather, high nebulosity, and a high precipitation in Maramures, for the period between the 2nd and 6th of February.
6.2.2 The Evolution of Air Temperature and Rainfall
According to the synoptic situation detailed above, the winter of 2016–2017 was unusual for the last decades because of its severity and the manifestation way of the meteorological parameters.
The records made by S.T.W.B.A. through the network of hydrometric stations and at the frequency previously presented as well show this aspect. These recordings have made possible the realization of a complex winter chart, which allows the conditional explanation of the production and manifestation of the analyzed phenomena.
The sitting of the hydrometric stations is not, necessarily, in the area of the flow formation but, rather, in the area of the accumulation of it, in key sections, which allow the control and effective management of special circumstances, occurred due to hydrological extreme events. That’s why there is a certain quantitative/value difference between what was actually measured in their section and what was determined by different methods or gauging campaigns on basin surfaces.
The air temperature, measured even hourly during the manifestation periods of the dangerous hydric phenomena, was rarely positive, and this for very brief periods; periods identified as the same with those with rainfall in the area of study, which gave, besides, oscillations that are more than obvious, on the chart (Fig. 7.18).

(data source S.T.B.W.A. 2017)
Complex chart of the winter I—air temperature, rainfall, and snow thickness at the hydrometric stations on the studied rivers
The thermic values varied between 3 °C the maximum and −19 °C the minimum, and there were recorded multiple days with strong negative values in a row: −3 … −14 °C, in the first period of the analysis interval and even −10 … −19 °C in the middle of the interval. To the end of it, the thermic values raised very much staying positive even for more than a week (February 1st to 11th, 2017). Then, a short period of time of low temperatures took over again: under −5 °C.
These thermic characteristics were very favorable for the increase of ice thickness on watercourses, with a strong impact on the phenomenon of liquid flow, as it will be seen in one of the following chapters.
The registered rainfall quantities were not important—a maximum of 14 mm in the week preceding the formation of the ice jams (predominately rain).
Throughout the entire analyzed period they were, however, mostly in the form of snow, which facilitated the accumulation of a substantial layer (Fig. 7.18), especially on slopes, with a subsequent effect on the flow. Important was, however, the frequency nearly regular, identifying six periods with rainfall at approximately equal intervals, except for the last decade of January, when they were quasi-absent.
As expected, the quantities of solid precipitation, but also liquid, were almost double in the case of the Vaser basin—hydrometric station of Viseul de Sus, on the slopes with western exposure of the Mountains Maramures (compared with the hearth of the basin, where the other gauging stations are located).
6.2.3 The Average Thickness of the Snow Layer and the Water Supply in the Basin
These two essential elements in the process of winter hydrological forecasts elaboration have recorded a very interesting spatial distribution with relevance in the formation of extreme hydric studied events, in the basin of Maramures (Fig. 7.19).

(data source S.T.B.W.A. 2017)
Average thickness of the snow layer and the water supply in the basin. Up, January 31st, 2017; Down, February 10th, 2017
Even before the consistent warming period (February 1st to 11th, 2017), doubled by liquid precipitation, as well as after this, the hearth of basin of Maramureș Basin, individualized of the middle and lower course of the Iza River, was covered by a layer of low snow (under 15 cm) on January 31st, 2017, or devoid of this bedspread on February 10th, 2017 (Fig. 7.19).
On the contrary, the eastern slopes of the mountains of Oaş and Igniş and the northern ones of the Gutâi Mountains and the western slope of the Maramureş Mountains stored significant quantities of snow (between 25 and 70 cm before warming and 5–33 cm after it).
Besides, the group of the Gutâi Mountains is recognized as a pole of rainfall in Romania with values around 1200 mm, after the Vladeasa Mountains (Apuseni Mountains, where at the Station Stâna de Vale the quantities range up to 1500 mm), Maramureş Mountains, Rodnei Mountains, and the Făgăraș Mountains.
Due to the thermal oscillations and repeated precipitation, as described above, on January 31st, 2017, the water supply in the snow layer had very high values, which ranged from 80 to 90 mm in Maramures Mountains, 70–80 mm in the Gutâi Mountains to values much more modest between 15 and 30 mm on the hearth of the basin, along the axis of the Iza river, in particular (Fig. 7.19).
After the warming period and the period of constant liquid precipitation in the interval 02-05.02.2017 (80 mm in the Gutâi Mountains and 40 mm in Rodna Mountains—Fig. 7.18) on February 10th, 2017, the water reserve in the layer of snow decreased slightly just on the hearth of the basin, while in the mountain area remained fairly high (70–80 mm in the mountains, Lapus and Tibles, 70 and 80–90 mm in the north and, respectively, south of the Maramureş Mountains—Fig. 7.19).
As it will be observed in the next chapter, these large amounts of water stored on the slopes had important effects on the flowing regime of the rivers and on the mobilization of the ice floes downstream.
6.3 The Anthropogenic Conditions Influencing the Riverbed on the Studied Sectors
The areas of ice jams formation are heavily populated and with a natural landscape influenced by human intervention (including the watercourses landscape), through systems of damming, defense, and consolidation of banks and overpasses like bridges and walking boards (Fig. 7.8).
Moreover, there are natural obstacles caused by the river topographic sinuosity, narrowing’s of the minor and major riverbeds, thresholds, and rapids.
In the case of rivers Tisa and Viseu, it is noted only a narrowing generated by the railway bridge which crosses the tributary, less than a hundred meters from their confluence, however, without a major impact on the occurred phenomena, as its hydraulic calibration is correctly made.
The effect of self-resistance to the advance of the ice and double/auto jam is, however, the one that generated the blocking of the two valleys and the special problems of mechanical and flooding nature. The hydraulic capacity and the channel roughness of Tisa after the reception of Viseu were not sufficient and adapted to mechanical flow massive and abundant floes, which led to agglomeration and the emergence of significant amounts of water behind the jams. As we will see in the next section, the overflowing water volume created the greatest problems and induced the state of alert.
What’s more, for the Vaser River, eight sections of overpassing can be counted (footboards and bridges), probably undersized for this type of phenomenon, which is historical for this watercourse. Another possible factor was the narrow railroad embankment, route of importance for logging and tourism, which accompanies the river till its middle course and which sometimes contributes to the narrowing of the flowing section.
Going forward, without a doubt, the most complex area of manifestation of the winter phenomena on watercourses is the confluences and the vulnerable and low sectors of the rivers Tisa, Iza, Mara, and Cosau (Fig. 7.8). Numerous sections of embankments, defenses and consolidation of banks, sections of riverbed overpassing, confluences with backwater zone, and narrowing of watercourses due to sectors of quasi-gorge are found here. There are three sections of overpassing-type bridges, which can pose problems of flowing at high levels of the flow and high density of ice blocks: in the town of Berbești on the Mara River, in the town of Vadul Iza on Iza River, and at the entrance of the Iza River in the municipality Sighetul Marmatiei.
Also, this area is intensely populated, and homesteads reach, sometimes, until in the immediate vicinity of the minor riverbed, so the infusion of different wastes to the riverbed is not ruled out.
6.4 The Condition of Rivers, the Types of Winter Phenomena, and Their Evolution, Monitoring, and Management
The stark negative evolution of air temperature was bound to leave significant traces on the watercourses (Fig. 7.20).

(data source S.T.B.W.A. 2017)
Complex chart of winter II—the ice thickness, winter coefficient of flow, and the types of winter phenomena at the gauging stations on the studied rivers
In this regard, all studied courses developed the winter phenomena, starting with ice at bank or spongiously ice (possibly other early or transition forms for the advanced phenomena), along with the temporal onset of negative temperatures (Vaser) or three days after it (Mara, Iza, and Tisa). This situation is understandable, as the Vaser Valley belongs entirely to the high mountain area (Fig. 7.3), where the supercooled air had descending character along the homonym canyon till the exit from the mountain area, contributing to the accelerated cooling of the river water. Other watercourses cross the much-enlarged corridors and small basins to the hydrometric stations where parameters of interest were monitored, areas where the supercooled air installed and made its effect with a slight delay.
After the second decade of the month of December, the ice gained consistency, the observed thicknesses exceeding 15 cm, in some cases (Fig. 7.20), thickness from which, in the case of the compact ice, the access of observers on the bridge of ice is permissible (N.I.M.H. București 1996; N.I.H.W.M. București 2013).
Besides, on the same temporal coordinates the transition to an evolved form of winter phenomenon was made as well—the ice bridge, which installed relatively quickly on the rivers Iza and Mara, due to the relatively low flow levels and the persistence of the very low temperatures on the hearth of Maramures Basin. In a first phase, the Vaser River has developed a form of transition to the compact ice bridge, respectively, the bridge of ice with stitches of water, due to the high speed of water flow induced by a corresponding slope and the numerous rapids, taking into account the mountain pass sector it crosses.
The river Tisa kept, throughout the period of study, the form of ice from bank, due to the constant flow, the ice with thicknesses around the value 5 cm, in the month of December and 10 cm in the second part of the interval (Fig. 7.20).
Throughout the duration of the winter phenomena, the behavior of the watercourses was specific, with substantial changes in the flow regime, under the effect of ice formations (Fig. 7.20). The flow regime was disrupted, leading to a flow influenced even to 80% on the rivers Vaser and Mara and 30% on the river Iza.
In order to capture the correct degree of influence, the regional authorities of the S.T.B.W.A. calculated and monitored the evolution of the so-called winter coefficient of flow (K w ).
It is obtained by dividing the effective measured flow Qm (not less frequently than once at 5 days), corresponding to the influenced level H i by the winter phenomena, to the flow from the lymnimetric key Q lc corresponding to the same level at the hydrometric rod, but in the situation of free riverbed. In the conditions of free riverbed Ki = 1, respectively, Qm = Qlc. In the conditions of riverbed with total frost Ki = 0, respectively, there is no flow.
If in the first five pentads the coefficient of winter had oscillatory evolution, starting with the sixth pentad he remained at very low levels on the rivers Vaser and Mara and continued to fluctuate on the river Iza. This evolution continued until after the time of the period of rapid warming and liquid rainfall start, after which the coefficient climbed, again, to unit, as in the period before the production of winter phenomena, in November, 2016.
In the last decade of study interval, the evolution of events and phenomena will take another turn. Thus, on February 1st, 2017, the national authorities R.W.N.A. and N.I.H.W.M. of Bucharest, in collaboration with the regional—S.T.B.W.A. Cluj-Napoca, and with national and regional authorities in the field of Meteorology N.M.A. Bucharest and R.M.C. Transilvania Nord have issued, for the study area, a hydrological code yellow warning, valid for the interval February 2nd, 6.00 PM to 4th, 4.00 PM, 2017. The warning covered the forecasted period of warming, accompanied by precipitation in the liquid form, which were to have a significant impact on the overall condition of the watercourses and the winter phenomena.
On February 2nd, 2017, at 10.00, another meteorological code yellow alert was received, N.M.A. Bucharest for the interval February 3rd, 3.00 AM to February 4th, 6.00 AM, 2017, related to increasing temperatures and rainfall, and the same day at 22.54, a code yellow warning for dangerous weather phenomena was received from the N.M.A. to R.M.C. Transilvania Nord for the interval February 2nd, 11.00 PM to 3rd, 3.00 AM, 2017.
On the February 3rd, 2017 at 8.10 AM, a hydrological code orange warning was issued for immediate phenomena on the rivers in the area, from the R.W.N.A. and N.I.H.W.M. Bucharest, for the interval February 3rd, 8.20 AM to February 3rd, 1.00 PM and 6.00 PM, 2017, we received a new hydrological code orange warning also from the R.W.N.A. to N.I.H.W.M. Bucharest, for the interval February 3rd, 2.00 PM to February 5th, 10.00 AM, 2017.
On the February 5th, 9.45 AM, 2017, the last hydrological code orange warning was received from the R.W.N.A. and N.I.H.W.M. Bucharest, for the interval February 5th, 10.00 AM to 7th, 4.00 PM, 2017. In the area, following the sudden warming and with the arrival of the rains, the situation worsened, confirming the forecasts, and forming ice jam/river blockades, combined with the flash floods produced by the rapid warming and the fallen liquid precipitation, as follows (Fig. 7.8):
-
on the Cosau River, upstream from the Feresti hydrometric station, on a length of approximately 200 m;
-
at the confluence of Tisa with the Viseu River in the village of Valea Viseului, on a length of 500 m, with a thickness of 3 m of the floes layer, both on the Viseu River as on the Tisa River, followed by a quick level rise, because of the constant discharges of the two rivers;
-
on the Iza River, downstream and upstream from the confluence with Valea Băii, between the settlements of Barsana and Stramtura, on a length of 1 km approximately;
-
on the Iza River, upstream of the villages of Vadu Izei and Nănești, with a length of the ice jam of 7.5 km;
-
on the Ruscova River, in the town of Ruscova, with a length of the ice jam of 250 m, and a thickness of 2.45 m;
-
on the Vaser River, ice jams, starting at the hydrometric station of Viseu de Sus up to the settlement of Faina, thus on a length of 32 km.
Through the Dispatcher Maramures W.M.S. and the Operational Centre of the Inspectorate for Emergency Situations (O.C.I.E.S.) “Gheorghe Pop de Băseşti” of the county of Maramureș, warnings and forecasts were sent to all the settlements in vulnerable areas. As a result, in the period February 3rd to 5th, 2017, for unlocking/clearing of the watercourses of ice blocks and ice jams, formed in exposed sections referred to in the previous chapters, the Maramureș W.M.S. intervened mechanically (an excavator, a backhoe, a dumper of 24 t, the intervention vehicles, pyrotechnic material) and through qualified personnel (2 mechanics, 5 drivers, 1 pyro-technician).
6.5 Variation of the Water Levels on the Rivers, Reported to the Official Defense Levels
During the manifestation of the winter phenomena, the water levels on the major rivers had variations of small amplitudes (generally less than 50 cm), specific to winter season, with two different exceptions from the points of view (Fig. 7.21).

(data source S.T.B.W.A. 2017)
Hydrographs of the measured water levels and the defense levels at the hydrometric stations on the studied rivers. RL—recorded level; WL—warning level, corresponding to yellow code warning; FL—flooding level, corresponding to orange code warning; DL—danger level, corresponding to red code warning
The first of exceptions was the Vaser River, which has registered important variations of the water level (over 150 cm) starting from the third decade of the month of December, 2016. The explanation is related to the mountain areas specific features of this watercourse—the gorge area, with a high slope and a higher speed of turbulent flowing, which caused an intense dynamic in the riverbed, with the mobilization of large amounts of ice blocks and supercooled water. The result was their accumulation much earlier than on other rivers and the development of an ice jam of impressive length (32 km).
The second exception refers to the time interval related to February, 2017, when the fast warming of the air occurred, accompanied by liquid precipitation and the watercourses unleash following the emerging flash floods. The amplitude of water levels, between the moment of maximum, reached immediately before the breaking of the ice dams and the moment of pre-warming, was extremely high on the rivers: Iza at the Vadul Izei hydrometric station—271 cm; Tisa at the Valea Vişeului hydrometric station—260 cm; Mara at the Vadul Izei hydrometric station—185 cm; and much lower on the Vaser River at the Vișeul de Sus hydrometric station—60 cm (Fig. 7.21).
Under the effect of watershed conditions—the extreme negative temperatures—the share of water from the slope was reduced to a minimum value, leaving the underground springs to sustain the rivers’ flows. Also, an important storage of water in the mass of ice on riverbeds occurred.
However, if we consider these last two ideas, as well as the variation of winter coefficient of flow presented above, we find, in fact, that the liquid flow was the hydric parameter most affected by the phenomena, while the water level, influenced by the ice pressure at the hydrometric rod, recorded a different variation and was more affected by the water storages behind of ice dams.
Analyzing Fig. 7.21, we notice, for the rivers Tisa, Iza, and Mara, a very good connection between the small water-level variations from the majority of the studied period and the amplitude of the flash flood from the end of this period. The maximum water level always exceeded the warning level (WL) for two of these rivers, or even the danger level (DL) for the Tisa River, at the Valea Vişeului hydrometric station. On the contrary, where visible variations of the water level were noticeable throughout the period with phenomena, the amplitude of the flash flood from the end of this period was extremely small, failing to reach even the warning level (WL).
7 Effects of the Occurred Winter Phenomena
The ice jam effects, in general, of the winter phenomena on rivers, are difficult to manage, taking into account their frequently mechanical character, but, also, of a different type (Fig. 7.22).

(photos by S.T.W.B.A.—Maramureş W.M.S.)
Mechanical and related effects induced by the agglomerations of ice on households and mobile properties—February, 2017, the Vaser Valley
The damage can be much severe than in the case of “ordinary” floods, because of the high density of the transported solid bodies (blocks of ice, other dislocated, and carried away objects), which have an amplified hitting power due to their weight associated with the movement velocity.
The mechanical effects are very commonly associated with floods, whereas, generally, behind the ice jams significant amounts of water accumulate and, by the sudden breaking of the ice dams, this quantity of water represents a devastating water front with solid objects, which move with very high speed and destroy everything in their path.
7.1 Effects on the Anthropogenic Environment
This type of effects was one of the most visible, given the human nature and the location of the hearth of localities, the objectives with anthropogenic origin or the properties in the watercourses action area. In our case, the value of damage exceeded 1255,588 lei (275,347 EUR—Table 7.2).
In a relatively poor area, devoid of large investments and major activities, the value of damage quantified in Lei and converted in EUR is quite high, taking account of the local dimension of the manifestation areas and the types of phenomena and hydric events, which occurred.
On the other hand, due to the prompt, concerted, and synchronized action of the R.W.N.A. and N.I.H.W.M. from Bucharest, S.T.W.B.A. from Cluj-Napoca, N.M.A. from Bucharest, and R.M.C. Transilvania Nord from Cluj-Napoca, Dispatcher of Maramures W.M.S. and the “Gheorghe Pop de Băseşti” Operational Centre of the Inspectorate for Emergency Situations (O.C.I.E.S.) of Maramureș county, local authorities (mayors’ offices), of performed warnings, forecasts, and interventions, the damage was considerably limited and, most importantly, there were no human victims.
Making a more detailed analysis on each occurrence area and on each affected locality, important differences between them come into prominence (Table 7.3).
The highest damage was registered in the Sighetu Marmației Municipality, through the damage of the bridge from the southern entrance in the city, caused by the winter phenomena occurred on the Iza River, after the confluence with Mara River (Fig. 7.8).
Significant damage, reported to the number of inhabitants and to the size of the settlement, registered also the Onceşti village, as a result of the effects of the phenomena from Iza River (300 ha of agricultural land—already quite rare and low productive in the area due both to soil and climate factors).
Also, Vișeul de Sus city has been seriously affected by natural events from the Vaser River, and, in addition, by the mud and ice torrential overflow from the slopes. Here stood out several houses, household annexes, street networks, etc. (Table 7.3).
7.2 Effects on the Natural Environment
Protected areas’ habitats present different flooding reactions, due to their specificity. Periodic floods are critical to maintaining the ecological integrity and biological productivity of the river floodplains (Rasmussen 1996; Poff et al. 1997; Jurajda and Reichard 2006). In the river system, massive floods are the main cause of variability and environmental disruption (Michener and Haeuber 1998; Serban et al. 2012).
An important differentiation occurs between floods with lateral invasion and those of erosive type that have different effects on fish populations. Erosive floods are characterized by a fast-moving and turbulent water with power of drawing and moving the riverbed-related components, often with dramatically destructive impact on the riverbed’s natural habitats and riparian areas (Mathews 1998; Jurajda and Reichard 2006; Serban et al. 2016).
An important flood effect is the significant reduction in the abundance of fish species, in some cases, up to extinction, between the pre-flood (before flood) and post-flood (after flood) moments (Jurajda et al. 1998).
Tangent or overlapping the analyzed area, three environmental zones with special status can be identified, namely The Upper Tisa and the “Pădurea Ronișoara” Protected Area (http://eeagrants-tisa.ro/rosci-0251-tisa-superioara/), and two parks, namely The Maramureș Mountains Natural Park (https://www.muntiimaramuresului.ro/index.php/ro/) and The Rodna Mountains National Park (https://www.parcrodna.ro/) (Fig. 7.23).

Source Authors
Protected areas from the Romanian Upper Tisa watershed.
In the Upper Tisa Natura, 2000 protected areas, from east to west, were identified the following types of fish species and their habitats sensitive to winter river phenomena and floods (Fig. 7.24—underlined species are representative and are found on the standard forms of the studied sites) (Serban et al. 2016):

Species and habitats identified in the administrative territorial units of Pricop—Huta-Certeze and Upper Tisa Natura 2000 protected areas vulnerable to floods and winter phenomena (by different sources and own research). I Triturus cristatus (Northern crested Newt); II Triturus montandoni (Carpathian Newt); III Bombina variegata (Yellow-bellied toad); IV Lutra lutra (Eurasian otter) (after Serban et al. 2016)
-
in Sect. 7.1, the A Habitat, Vișeu Valley, based on electrofishing, were found Alburnoides bipunctatus (spirlin), Barbus Barbus (barbel), Barbatula barbatula (stone loach); the habitat is one of Hucho hucho (huchen), with submerged rocks in the riverbed and depth as well, with river sides where Rubus vitis idaea (cranberry), Salix fragilis (crack willow), Alnus incana (white alder), Alnus glutinosa (black Alder) were discovered; the white-throated dipper (cinclus cinclus) was also located there (Oprea and Irimia 2015);
-
in Sect. 7.2, the B Habitat, downstream of Sighetu Marmaţiei, electrofishing based, Leuciscus cephalus (european chub), A. bipunctatus (spirlin), B. Barbus (barbel), Cottus poecilopus (alpine bullhead) were discovered; habitat is one of floodplain forest, with Populus alba (white poplar), Fraxinus augustifolia (narrow-leaved ash), Clematis vitalba (old man’s beard), Humulus lupulus (hops), S. fragilis (crack willow), Salix alba (white willow), Acer negundo (maple), and heavily herbaceous river sides (Oprea and Irimia 2015);
-
in Sect. 7.3, the C Habitat, located in Săpânța village, based on electrofishing, L. cephalus (european chub), Phoxinus phoxinus (common minnow), Alburnus alburnus (bleak), Barbus peloponnesius petenyi (mediteranean barble), Orthrias barbatulus (stone loach), Cottus gobio (european bullhead) were discovered (Harka et al. 1999); the habitat is one of floodplain forest, with Populus (poplar), F.augustifolia (narrow-leaved ash), C. vitalba (old man’s beard), H. lupulus (hops), S. fragilis (crack willow), S. alba (white willow), A. negundo (maple), with heavily herbaceous river banks;
-
in Sect. 7.4, the D Habitat, in the Remeţi village, based on electrofishing, B. Barbus (barbel), L. cephalus (european chub), Leuciscus souffia (western vairone) A. alburnus (bleak), B. barbatula (stone loach), P. phoxinus (common minnow), Pseudorasbora parva (stone moroko) were discovered; the habitat is the confluence one, dammed area with floodplain forest, S. fragilis (crack willow), S. alba (white willow), P. alba (poplar), Robinia pseudoacacia (black locust), F. augustifolia (narrow-leaved ash) (Oprea and Irimia 2015);
-
in Sects. 7.5, 7.6, and 7.7, on the Frumușeaua, Valea lui Francisc and Săpânța valleys, upstream from Crasna Vișeului, Săpânța, and Remeţi villages, based on electrofishing, Eudontomyzon danfordi (Carpathian brook lamprey), was observed, particularly sensitive to the impact of anthropogenic activities (Telcean and Cupsa 2011).
Regarding the amphibian populations, their behavior during flood is less known, although it is obvious that the phenomenon plays a vital role in the abundance and spread of such species (Tockner et al. 2006; Kupferberg et al. 2012; Ocock et al. 2014). Amphibians are very sensitive to environmental and habitat changes, primarily to changes in rainfall and flow regime, but also temperature, turbidity, water pollution with pesticides or other chemicals, or pollution with plant and animal residues (including sawdust) (Frogs in wetlands 2015). Distribution of frogs and some other amphibians related to the study area is shown in Fig. 7.24.
The existence of the Eurasian otter (Lutra lutra) in a habitat depends largely on the permanence of water and the availability of adequate food resources (Melquist and Hornocker 1983; Kruuk 1995; Prenda et al. 2001). Also, the existence of the Eurasian otter is influenced by the surrounding areas characteristics, water pollution and human-induced disturbance factor (Bas et al. 1984; Delibes et al. 1991; Prenda et al. 2001). Ardelean and Béres (2000) showed: “Our research has proven that Eurasian otter presence starting from Tisa’s riverside coppice to mountain streams with a lot trout (Iza, Vișeu, Mara, Săpânța, Rica etc.)”.
The winter phenomena occurred in the study area had a lower and limited impact on these three protected areas, taking account the cold season, when the biotic activity in the ecosystems is very low.
Also, the space of the phenomena manifestation is limited to the periphery of the protected areas—just the Vaser Valley with the related phenomena go deep into the area of Maramureş Mountains Natural Park, as well as to the riverside habitats exposed to the ice blocks dynamics and generated swift flash floods (Figs. 7.8 and 7.23).
8 Conclusions
The winter phenomena occur in a more or less intense/frequent manner, depending on the factors which influence them. From the experience of decades of observation and gauging in the R.W.N.A. hydrometric network, it is found that on altitude, the maximum frequency of them belongs to the mountain area, the space of flow genesis, characterized by high quantities of rainfall and low average temperatures, especially at its periphery. With a lower frequency, the winter phenomena appear in the hilly area as well, on the background of the agglomeration of floes from the various tributaries.
The upper basin of Tisa mostly overlaps with the historic Basin of Maramures—from which, only a third is located on the Romanian territory. In contrast to the Ukrainian part of the basin, which has a larger opening to the Panonic Basin, the Romanian part of the basin is opened only to the northwest, to west and south being closed by the neogen volcanic chain of the Oaș–Gutâi–Țibleș Mountains. This natural organization enables cold air mass advections from north and important thermic inversions on the lower basin area which determines specific characteristics of winter flow on the two rivers.
Morphological, climatic, and hydric conditions are favorable to the development of the winter phenomena on the watercourses from the Romanian sector of the basin, according to the literature and to observations and measurements made by the responsible institutions.
The watercourses, which recorded the most severe winter phenomena, followed by unusual events, were: the Tisa river collector, its effluent Iza, and with less impact the Viseu river and other tributaries of them as well: Vaser, tributary of Viseu—the most severe case; Mara, tributary of Iza, and Cosău, tributary of Mara. Their position, as well other characteristics and special circumstances under which these watercourses, were generated particularities for each of them, determining the emergence of several critical sectors.
One of the most by the occurred phenomenon targeted sectors and spaces was the confluence ones, the low areas at the connection of the watercourses, where the ice blocks that came from upstream were massively crowded. Another category of sectors with problems was the gorge-type ones, where the alternation between the narrowing sectors and the widening ones created optimal conditions for ice blocks agglomeration. The sinuosity of the watercourses was another element, which favoured the chaotic movement and the agglomeration of the ice blocks, whether of topographic or hydraulic origin. An element, again, extremely important is the aspect of the longitudinal profiles of the analyzed watercourses and their average slope, which combined with other morphological and morphometric elements favoured the congestion and stagnation of ice floes.
The winter phenomena analyzed in the study were generated by persistent negative temperatures (for approximately two months) and by sudden weather changes. The winter of 2016–2017 was dominated by prolonged cold weather; extreme negative temperatures were recorded, starting from December until the end of January. According to the detailed presented synoptic situation, the winter of 2016–2017 was an unusual one for the last decades by its severity and manifestation way of the meteorological parameters.
The records made by S.T.W.A. through the network of hydrometric stations have made possible the construction of a complex winter chart, which allows the conditional explanation of the phenomena occurrence and manifestation which are the subject of analysis of this material.
The thermic values varied between 3 °C the maximum and −19 °C the minimum, and strong negative values were registered for several days in a row: −3… −14°C, in the first period of the analyzed interval and −10… −19 °C in the middle of the interval. To the end of the period, the thermic values rose very much remaining positive for even more than a week (February 1st to 11th, 2017), followed, again, by a shorter period of time of low temperatures: under −5 °C.
The registered quantities of rainfall were not important—a maximum of 14 mm in the week preceding the formation of the ice jams, when the raining predominated. Throughout the entire analyzed period they were, however, mostly in the snow form, which facilitated the accumulation of a substantial layer, especially on slopes, with a subsequent effect on the flow. Important was, nonetheless, the nearly regular frequency, identifying six periods with rainfall at approximately equal time intervals, except for the last decade of January, when they were quasi-absent.
The areas of ice jams formation are densely populated and with a natural landscape influenced by human intervention, including the influence of watercourses landscape through embankment systems, defense improvements, and consolidation of banks overpasses of bridges and footbridges type. To these are added the natural obstacles caused by the sinuosity of rivers, narrowing of the minor and major riverbeds, thresholds, and rapids.
All studied watercourses developed winter phenomena, starting with ice at bank or spongiously ice (possibly other early or transition forms for the advanced phenomena), along with the temporal onset of negative temperatures (Vaser) or three days after it (Mara, Iza, and Tisa). After the second decade of the month of December, the ice gained consistency, the observed thicknesses exceeding 15 cm, in some cases. Besides, on the same temporal coordinates the transition to an evolved form of winter phenomenon was made as well—the ice bridge, which installed relatively quickly on the rivers Iza and Mara, due to the relatively low flow levels and the persistence of the very low temperatures on the hearth of Maramures Basin. In a first phase, the Vaser River has developed a form of transition to the compact ice bridge, respectively, the bridge of ice with stitches of water, due to the high speed of water flow induced by a corresponding slope and the numerous rapids, taking into account the mountain pass sector it crosses.
The river Tisa kept, throughout the period of study, the form of ice from bank, due to the constant flow, the ice with thicknesses around the value 5 cm, in the month of December and 10 cm in the second part of the interval.
The flow regime was disrupted, leading to a flow influenced even to 80% on the rivers Vaser and Mara and 30% on the river Iza. If in the first five pentads the coefficient of winter had oscillatory evolution, starting with the sixth pentad he remained at very low levels on the rivers Vaser and Mara and continued to fluctuate on the river Iza. This evolution continued until after the time of the period of rapid warming and liquid rainfall start, after which the coefficient climbed, again, to unit, as in the period before the production of winter phenomena, in November, 2016.
Following the sudden warming and with the arrival of the rains, the situation worsened, confirming the forecasts, and forming ice jam/river blockades, combined with the flash floods produced by the rapid warming and the fallen liquid precipitation: upstream from the Feresti hydrometric station, on a length of approximately 200 m; at the confluence of Tisa with the Viseu River in the village of Valea Viseului, on a length of 500 m, with a thickness of 3 m of the floes layer, both on the Viseu River as on the Tisa River, followed by a quick level rise, because of the constant discharges of the two rivers, on the Iza River, downstream and upstream from the confluence with Valea Băii, between the settlements of Barsana and Stramtura, on a length of about 1 km; on the Iza River, upstream of the Vadu Izei and Nănești villages, with a ice jam length of 7.5 km; on the Ruscova River, in the Ruscova locality, with a ice jam length of 250 m and a thickness of 2.45 m; on the Vaser River with ice blocks agglomerations, starting from Vișeu de Sus hydrometric station up to the settlement of Faina, thus on a length of 32 km.
During the manifestation of the winter phenomena, the water levels on the major rivers had variations of small amplitudes (generally less than 50 cm), specific to winter season, with two different exceptions from the points of view. The first of exceptions was the Vaser River, which has registered important variations of the water level (over 150 cm) starting from the third decade of the month of December 2016. The second exception refers to the time interval related to February 2017, when the fast warming of the air occurred, accompanied by liquid precipitation and the watercourses unleash following the emerging flash floods. The amplitude of water levels, between the moment of maximum, reached immediately before the breaking of the ice dams and the moment of pre-warming, was extremely high on the rivers: Iza at the Vadul Izei hydrometric station—271 cm; Tisa at the Valea Vişeului hydrometric station—260 cm; Mara at the Vadul Izei hydrometric station—185 cm; and much lower on the Vaser River at the Vișeul de Sus hydrometric station—60 cm. The maximum water level always exceeded the warning level (WL), or even the danger level (DL) at the Tisza River, Valea Vişeului hydrometric station, with the exception of the Vaser River, where not even warning level was reached (WL).
The mechanical effects are very commonly associated with floods, whereas, generally, behind the ice jams significant amounts of water accumulate and, by the sudden breaking of the ice dams, this quantity of water represents a devastating water front with solid objects, which move with very high speed and destroy everything in their path. The effects on the anthropogenic environment were one of the most visible, given the human nature and the location of the hearth of localities, the objectives with anthropogenic origin or the properties in the watercourses action area. In terms of value, they exceeded 1255,588 lei (275,347 EUR). Thanks to the prompt, concerted, and synchronized work of all involved authorities and institutions, the damage was much limited and, most importantly, there were no human victims. Both fish and batrachian populations, as well as the amphibious mammal identified in the study area, are vulnerable to winter phenomena (flood interruption, ice blocks transport, etc.) and floods (high turbidity effect, reduction of dissolved oxygen quantity, habitats destruction, etc.). Their habitats are affected, in large measure, by the phenomena, excepting some of the categories (Batrachia), for which the water surfaces remaining after floods at the end of spring season are favorable for hatching and breeding. Also, the space of the phenomena manifestation is limited to the periphery of the protected areas—just the Vaser valley with the related phenomena go deep into the area of Maramureş Mountains Natural Park, as well as to the riverside habitats exposed to the ice blocks dynamics and generated swift flash floods.
References
Ardelean G, Béreş I (2000) The vertebrate fauna of Maramureş. The Universitaria Collection, Edit. Dacia, Cluj-Napoca, 378 p
Ashton GD (1986) River and lake ice engineering. Water Resources Publications, Littleton, Colorado, USA, 485 p
Bas N, Jenkins D, Rothery P (1984) Ecology of otters in Northern Scotland. V. The distribution of otter (Lutra lutra) faeces in relation to bankside vegetation in the river Dee in summer 1981. J Appl Ecol 21:507–513
Bashta AT, Potish L (2007) Mammals of the Transcarpathian region (Ukraine), Lviv, 260 p
Bates R.E., Billelo M.A. (1966) Defining the cold regions of the Northern Hemisphere. Cold Regions Research and Engineering Laboratory, Technical Report, Nr. 178
Beltaos S (1990) Fracture and breakup of river ice cover. Can J Civ Eng 17(2):173–183
Beltaos S (1993) Numerical computation of river ice jams. Can J Civ Eng 20(1):88–99
Beltaos S (2007) Hydro-climatic impacts on the ice cover of the lower Peace River. Hydrol Process 19
Beltaos S (2008) Progress in the study and management of river ice jams. Cold Reg Sci Technol 51:2–19
Beltaos S (2016) Extreme sediment pulses during ice breakup, Saint John River, Canada. Cold Reg Sci Technol 128(2016):38–46
Beltaos S, Burrell BC (2015) Hydroclimatic aspects of ice jam flooding near Perth-Andover, New Brunswick, Canadian. J Civ Eng 42(9) Special Issue: SI Pages: 686–695
Beltaos S, Burrell BC (2016a) Transport of suspended sediment during the breakup of the ice cover, Saint John River, Canada. Cold Reg Sci Technol 129:1–13
Beltaos S, Burrell BC (2016b) Characteristics of suspended sediment and metal transport during ice breakup, Saint John River, Canada. Cold Reg Sci Technol 123:164–176
Beltaos S, Prowse TD (2001) Climate impacts on extreme ice-jam events in Canadian rivers. Hydrol Sci J 46(1):157–181. https://doi.org/10.1080/02626660109492807
Boar N (2005) The Romanian-Ukrainian cross-border region of Maramureş, Edit. Presa Universitară Clujeană, 294 p
Boivin M, Buffin-Belanger T, Piegay H (2017) Interannual kinetics (2010–2013) of large wood in a river corridor exposed to a 50-year flood event and fluvial ice dynamics 3rd International Conference on Wood in World Rivers, Padova, Italy & Geomorphology, vol 279, Special Issue: SI Pages: 59–73
Chiş VT, Kosinszki S (2011) Geographical introductory characterization of the Upper Tisa River Basin (Romania-Ukraine), “The Upper Tisa River Basin”. Transylvanian Rev Systematical Ecol Res 11:1–4
Ciaglic V (1965) The evolution of the freezing phenomenon on river Bistricioara in the winter of 1963–1964 (in Romanian). Hidrotehnica 10(2):92–101
Cocuţ M (2008) The characteristics of water flow in the Basin of Maramureş and in the limitrophe mountain zone. Doctoral thesis—manuscript. Babeş-BolyaiUniversity, College of Geography, Cluj-Napoca, 115 p
Cojoc G, Romanescu G, Tîrnovan A (2015) Exceptional floods on a developed river. Case study for the Bistrita River from the Eastern Carpathians (Romania). Nat Hazards 77(3):1421–1451
Colceriu R (2002) Ice jams, risk factors in the upper hydrographic basin of the Mures river (in Romanian), Edit. “Dimitrie Cantemir” Tg. Mureş, 154 p
Colceriu R (2003) The study of freezing phenomena in the upper course of Mures river (between the source and Tg. Mureş) (in Romanian). Doctoral thesis, The Geography Institute of the Bucharest Academy, manuscript
Colceriu R (2010) The strategy and the outlook against floods in the Mures hydrographic basin space (in Romanian). From “The water resources of Romania—vulnerability at anthropic pressures”. In: Gâştescu P, Breţcan P (eds) The first Limnogeography national symposium works, 11–13 June, Valahia Univeristy, Târgovişte, Edit. Transversal, pp 175–183
Constantinescu C (1964) The factors that treats the existence and the duration of winter phenomena on Danube on the downstream sector from Tr. Severin (in Romanian). Meteorologia, Hidrologia şi Gospodărirea Apelor, 1
Daly SF (2009) Investigation of changes in conveyance of the St. Clair River over time using a state-space Model. US Army Engineering Research and Development Center, Cold Regions Research and Engineering Laboratory, ERDC/CRREL, Hanover, NH
Delibes M, Macdonald SM, Mason CF (1991) Seasonal marking, habitat and organochlorine contamination in otters (Lutra lutra): a comparison between catchments in Andalucía and Wales. Mammalia 55:567–578
Derecki JA, Quinn FH (1986) Record St. Clair River Ice Jam of 1984. J Hydraul Eng ASCE 112(12):1182–1194
Găman C (2014) Considerations on recent freezing phenomena on Bistriţa and Bistricioara rivers. PESD 8(2):225–242. De Gruyter Open, https://doi.org/10.2478/pesd-2014-0037
Gholamreza-Kashi S (2016) A forecasting methodology for predicting frazil ice flooding along urban streams using hydro-meteorological data. Can J Civ Eng 43(8):716–723
Giurma I, Stefanache D (2010) Winter phenomena on the Bistrita river between hazard and vulnerability (in Romanian). Paper N.I.H.W.M. National Institute of Hydrology and Water Management—Jubilee Conference, “Gheorghe Asachi” Technical University, Iaşi
Harka A, Bănărescu PM, Telcean I (1999) Fish fauna of the Upper Tisa, în Upper Tisa Valley, Tiscia monograph series, Szolnok-Szeged-Târgu Mures, pp 439–454
Huang Y, Sun J, Li W (2016) Experimental observations of the flexural failure process of snow covered ice. Cold Reg Sci Technol 129:14–30
Ichim I, Rădoane M (1986) The effects of dams in the landform dynamic. Geomorfological approach (in Romanian), Edit. Academiei, Bucureşti
Ichim I, Bătucă D, Rădoane M, Duma D (1989) The morphologic and the dynamic of river beds (in Romanian), Edit. Tehnică, Bucureşti
Jasek M (2003) Ice jam release surges, ice runs, and breaking fronts: Field measurements, physical descriptions, and research needs. Can J Civ Eng 30(1):113–127
Jurajda P, Reichard M (2006) Immediate impact of an extensive summer flood on the adult fish assemblage of a channelized Lowland River. J Freshw Ecol 21(3):493–501
Jurajda P, Hohausova E, Gclnar M (1998) Seasonal dynamics of fish abundance below a migration barrier in the lower regulated River Morava. Folia Zool 47:215–223
Koegel M, Das A, Marszelewski W et al (2017) Feasibility study for forecasting ice jams along the river Oder. Wasserwirtschaft 107(5):20–28
Kolerski T (2014) Modeling of ice phenomena in the mouth of the Vistula River. Acta Geophys 62(4):893–914
Kolerski T, Shen HT (2010) St. Clair River ice jam dynamics and possible effect on bed changes. In: Proceedings of the 20th I.A.H.R. International Symposium on Ice, 14–18 June 2010, Lahti, Finland
Kolerski T, Shen HT (2015) Possible effects of the 1984 St. Clair River ice jam on bed changes. Can J Civ Eng 42(9):696–703
Korytny LM, Kichigina NV (2006) Geographical analysis of river floods and their causes in southern East Siberia. Hydrol Sci J 51:3
Kowalczyk T, Hicks F (2003) Observations of dynamic ice jam release waves on the Athabasca River near Fort McMurray. Can J Civ Eng 34:473–484
Kraatz S, Khanbilvardi R, Romanov P (2017) A comparison of MODIS/VIIRS cloud masks over ice-bearing river: on achieving consistent cloud masking and improved river ice mapping. Remote Sens 9(3):229
Kruuk H (1995) Wild Otters. Predation and populations. Oxford University Press, Oxford
Kupferberg SJ, Palen WJ, Lind AJ et al (2012) Effects of flow regimes altered by dams on survival, population declines, and range-wide losses of California river-breeding frogs. Conserv Biol 26:513–524
Lagadec A, Boucher E, Germain D (2015) Tree ring analysis of hydro-climatic thresholds that trigger ice jams on the Mistassini River. Que Hydrol Process 29(23):4880–4890
Leopold LB, Maddock T (1953) The hydraulic geometry of stream channels and some physiographic implications, U.S. Geological Survey Professional Paper, 275 p
Leopold LB, Wolman MG, Miller JP (1964) Fluvial processes in geomorphology. W. Freeman and Co., San Francisco, p 522
Lindenschmidt KE, Das A, Rokaya P et al (2016) Ice-jam flood risk assessment and mapping. Hydrol Process 30(21):3754–3769
Liu L, Shen HT (2004) Dynamics of ice jam release surges. In: Proceedings of the 17th IAHR International Symposium on Ice, St. Petersburg, pp 244–250
Lu S, Shen HT, Crissman RD (1999) Numerical study of ice dynamics in upper Niagara River. J Cold Reg Eng ASCE 13(2):78–102
Lucie C, Nowroozpour A, Ettema R (2017) Ice jams in straight and sinuous channels: insights from small flumes. J Cold Reg Eng 31(3):04017006
Lucza Z (2017) This winter through the eyes of the hydrologist. FELSŐ-TISZA HIRADÓ, LVI. évfolyam 01.szám, pp 20–22 (in Hungarian) (https://www.fetivizig.hu/WEB/FETIKOVIZIG/VIZIGINFO_Start.nsf/Node.xsp?documentId=A7D2D748C29962FEC12580FA00315B18&action=editDocument)
Lukianets O, Obodovskyi I (2015) Spatial, temporal and forecast evaluation of rivers’ streamflow of the Drainage Basin of the upper tisa under the conditions of climate change. Environ Res Eng Manage 71(1):36–46
Matthews VJ (1998) Patterns in freshwater fish ecology. Chapmann Hall, New York
Melquist WE, Hornocker MG (1983) Ecology of river otters in West Central Idaho. Wildl Monogr 83:1–60
Michener VK, Haeuber RA (1998) Flooding: natural and managed disturbances. Bioscience 48:677–680
Miţă P (1977) The freezing and the thermic regime of water courses in Romania (in Romanian). Doctoral thesis—manuscript, University of Bucharest
Morse B, Hicks F (2005) Advances in river ice hydrology 1999–2003. Hydrol Process 19(1):247–263. https://doi.org/10.1002/hyp
Mustăţea A (1996) Exceptional floods on Romanian territory. Genesis and effects (in Romanian), Edit. INHGA, Bucharest, 376 p
Nafziger J, She Y, Hicks F (2016) Celerities of waves and ice runs from ice jam releases. Cold Reg Sci Technol 123:71–80
Ocock J, Kingsford RT, Penman TD, Rowley JJL (2014) Frogs during the flood: Differential behaviours of two amphibian species in a dryland floodplain wetland. Austral Ecol 39:929–940
Oprea E, Irimia D (2015) Monitoring the conservation status of species and habitats in Romania on the basis of Article 17 of the Habitats Directive, a Project financed through SOP Environment, 2007–2013
Paparyha P, Pipash Ludmyla, Shmilo V, Veklyuk Anatoly (2011) Hydrochemical Status of Streams and Rivers of the Upper Tysa River Basin in the Ukrainian Carpathians. “The Upper Tisa River Basin”. Transylvanian Rev Systematical Ecol Res 11:47–52
Păvăleanu I (2003) The ice jam phenomenon on Bistrita river, upstream of Izvoru Muntelui (in Romanian), Tehnical University “Gheorghe Asachi”. Faculty of Hydrotehnics—manuscript, Iaşi
Pawlowski B (2016) Internal structure and sources of selected ice jams on the lower Vistula River. Hydrol Process 30(24):4543–4555
Poff XL, Allan JD, Bain MB, Karr JR, Prestegaard KL, Richter BD, Sparks RE, Stromberg JC (1997) The natural flow regime. Bioscience 47:769–784
Pop PG (2000) The Carpathians and sub-Carpathians of Romania, Edit. Presa Universitară, Cluj-Napoca, 264 p
Posea G, Moldovan C, Posea A (1980) County of Maramureş. Romanian Academy’s Publishing, Bucureşti, p 179
Prenda J, López-Nieves P, Bravo R (2001) Conservation of otter (Lutra lutra) in a Mediterranean area: the importance of habitat quality and temporal variation in water availability. Aquatic Conserv Mar Freshw Ecosyst 11:343–355. https://doi.org/10.1002/aqc.454
Prowse TD, Beltaos S (2002) Climatic control of river-ice hydrology: a review. Hydrol Process 16:805–822
Prowse TD, Bonsal BR (2004) Historical trends in river-ice break-up: a review. Nord Hydrol 35(4–5):281–293
Prowse TD, Conly FM (1998) Effects of climatic variability and flow regulation on ice-jam flooding of a northern delta. Hydrol Process 12:1589–1610
Rădoane M (2004) Relief dinamics în the area of Izvoru Muntelui Lake (in Romanian), Edit. Universităţii Suceava, Suceava
Rădoane M, Ciaglic V, Rădoane N (2008) Researches on the ice jam formation in the upstream of Izvoru Muntelui reservoir. Analele Universității Ștefan cel Mare, Suceava, Secțiunea Geografie XVII:45–58
Rădoane M, Ciaglic V, Rădoane N (2010) Hydropower impact on the ice jam formation on the upper Bistriţa River, Romania. Cold Reg Sci Technol J 60(3):193–204
Rasmussen JL (1996) Floodplain management. Fisheries 21:6–10
Rhodes DD (1977) The b-f-m diagrame: graphical representation and interpretation of at-a-station hydraulic geometry. Am J Sci 277
Robb DM, Gaskin SJ, Marongiu J-C (2016) SPH-DEM model for free-surface flows containing solids applied to river ice jams. J Hydraul Res 54(1):27–40
Romanescu G (2003) Floods, between natural and accidental (in Romanian). The “Riscuri şi catastrofe” magazine, No. II, Edit. Casa Cărţii de Ştiință, Cluj-Napoca, pp 130–138
Romanescu G (2005) The upstream floods risk of Izvorul Muntelui Lake and the immediate effect of geomorfological characters of the river bed (in Romanian). The “Riscuri şi catastrofe” magazine, Edit. Casa Cărţii de Ştiință, Cluj-Napoca, pp 117–124
Romanescu G (2015) Water management. Hydrotechnical improvement of hydrographic basins and the wet zones (in Romanian), Edit. Terra Nostra, Iași, 324 p
Romanescu G and Bounegru O (2012) Ice dams and backwaters as hydrological risk phenomena—case study: the Bistrita River, upstream of the Izvorul Muntelui Lake (Romania). Flood Recovery Innovation and Response III, WIT Transactions on Ecology and The Environment, vol 159, WIT Press, pp 167–178, https://doi.org/10.2495/friar120141
Romanescu G, Stoleriu C (2017) Exceptional floods in the Prut basin, Romania, in the context of heavy rains in the summer of 2010. Nat Hazards Earth Syst Sci 17:381–396
Romanescu G, Cojoc GM, Sandu IG, Tîrnovan A, Dăscălița D, Sandu I (2015) Pollution sources and water quality in the Bistrita Catchment (Eastern Carpathians). Chem Mag 66(6):855–863
Sabău D, Bătinaş R, Roşu I, Şerban G (2017) Fresh Water Resources in the Natura 2000 Pricop-Huta Certeze and Tisa Superioară Protected Areas. “Air and Water—Components of the environment” Conference Proceedings. In: Şerban G, Croitoru A, Tudose T, Bătinaş R, Horvath CS, Holobâcă I(eds) Babeş-Bolyai University, Faculty of Geography, Cluj-Napoca, România, Edit. Casa Cărţii de Ştiinţă, pp 166–175
Semenescu M (1960) The freezing phenomenon in the sector of Porţile de Fier (in Romanian). Meteorologia Hidrologia şi Gospodărirea Apelor 4
Şerban G, Pandi G, Sima A (2012) The need for reservoir improvement in Vişeu river basin, with minimal impact on protected areas. In: Order to prevent flooding. Studia University “Babeş-Bolyai”, Geographia, LVII, nr. 1, Cluj-Napoca, pp 71–80
Şerban G, Sabău A, Rafan S, Corpade C, Niţoaia A, Ponciş R (2016) Risks Induced by maximum flow with 1% probability and their effect on several species and habitats in Pricop-Huta-Certeze and Upper Tisa Natura 2000 Protected Areas. “Air and Water—Components of the environment” Conference Proceedings. In: Şerban G, Bătinaş R, Croitoru A, Holobâcă I, Horvath C, Tudose T (eds) Babeş-Bolyai University, Faculty of Geography, Cluj-Napoca, România, Edit. Casa Cărţii de Ştiinţă, pp 58–69
She Y, Hicks F (2006) Modeling ice jam release wave with consideration for ice effects. Cold Reg Sci Technol 20:137–147
Shen HT, Liu L (2003) Shokotsu River ice jam formation. Cold Reg Sci Technol J 37:35–49
Shen HT (2016) River ice processes. In: Wang LK, Yang CT, Wang MHS (eds) Handbook of environmental engineering, vol 16. Advances in Water Resources Management, pp 483–530
Shen HT, Gao L, Kolerski T, Liu L (2008) Dynamics of ice jam formation and release. J Coast Res S52:25–32
Shen HT, Su J, Liu L (2000) SPH simulation of River Ice dynamics. J Comput Phys 165(2):752–770
Sorocovschi V, Şerban G (2012) Elements of climatology and hydrology. Part II—Hydrology. ID Education form. Edit. Casa Cărţii de Ştiinţă, Cluj-Napoca, 242 p
Sorocovschi V, Şerban G, Bătinaş R (2002) Hydric risks in the lower basin of Aries river (in Romanian). “Riscuri şi catastrofe” magazine, Edit. Casa Cărţii de Ştiință, vol I, Cluj-Napoca, pp 143–148
Ştefănache D (2007a) Studies of the evolution of some dangerous hydrological phenomena (in Romanian). Doctoral thesis, Tehnical University “Gheorghe Asachi”, Iaşi—manuscript
Ştefănache D (2007b) Le phénomène d‟hiver sur les rivières de la Roumanie -L‟évolution des barrages de glace du basin hydrographique supérieur de la rivière de Bistriţa, 14th Workshop on the Hydraulics of Ice Covered Rivers, Québec
Surdeanu V, Berindean N, Olariu P (2005) The natural and antrophic factors that leads to ice jams in the upper basin of Bistrita river (in Romanian). “Riscuri şi catastrofe” magazine, vol IV, no 2, Cluj-Napoca, pp 125–134
Telcean I, Cupşa Diana (2011) The occurrence of carpathian brook lamprey Eudontomyzon danfordi regan 1911 (petromyzontes, petromyzontidae) in the upper tisa tributaries from northern romania. Pisces hungarici 5:123–128
Thériault I, Saucet J-P, Taha W (2010) Validation of the mike-ice model simulating river flows in presence of ice and forecast of changes to the ice regime of the Romaine river due to hydroelectric project. In: Proceedings of the 20th IAHR International Symposium on Ice, Lahti, Finland
Tockner K, Klaus I, Baumgartner C, Ward JV (2006) Amphibian diversity and nestedness in a dynamic floodplain river (Tagliamento, NE-Italy). Hydrobiologia 565:121–133
Ujvári I (1972) The geography of Romanian waters, Edit. Ştiinţifică, Bucureşti, 578 p
USACE (1984) April 1984 Ice Jam Report; St. Clair River. Department of the Army, Corps of Engineers, Detroit District, Great Lake, Hydraulics and Hydrology Branch, Detroit, MI
Wang J, Hua J, Sui J et al (2016) The impact of bridge pier on ice jam evolution—an experimental study. J Hydrol Hydromechanics 64(1):75–82
Wang J, Shi F-Y, Chen P-P et al (2015a) Impact of bridge pier on the stability of ice jam. J Hydrodyn 27(6):865–871
Wang J, Shi F-Y, Chen P-P et al (2015b) Impacts of bridge piers on the initiation of ice cover—an experimental study. J Hydrol Hydromechanics 63(4):327–333
Wang J, Shi F-Y, Chen P-P, Wu P, Sui J (2014) Simulations of ice jam thickness distribution in the transverse direction. J Hydrodyn Ser B 26(5):762–769
White KD, Eames HJ (1999) CRREL Ice Jam Database, USA CRREL Report 99-2, CRREL, Hanover, NH. www.dtic.mil/get-tr-doc/pdf?AD=ADA362147
White KD, Tuthill AM, Vuyovich CM, Weyrick PB (2007) Observed climate variability impacts and river ice in the United States. CGU HS Committee on River Ice Processes and the Environment, 14th Workshop on the Hydraulics of Ice Covered Rivers, June 20–22, Quebec City, Quebec, Canada, 1–11 pp
Yatsyk AV, Byshovets LB et al (1991) Small rivers of Ukraine: Manual. In: Yatsyk AV (ed) К: Urozhai Publisher, 296 p (in Ukrainian)
Zare S, Moore S, Rennie CD et al (2016) Boundary shear stress in an ice-covered river during breakup. J Hydraul Eng 142(4):04015065
Zeleňáková M, Zvijáková L (2017) Using risk analysis for flood protection assessment. Springer International Publishing, Springer, 140 p, https://doi.org/10.1007/978-3-319-52150-3
* * * (1992) The atlas of water cadastre of Romania, Ministry of Environment and Aquaproject S.A., Bucureşti, 683 p
* * * (2015) Frogs in wetlands, http://www.environment.nsw.gov.au/wetlands/WetlandFrogs.htm
* * * (1996) Instructions of organization and the program of the hydrometric network’s activity on rivers (in Romanian), N.I.M.H., Bucharest
* * * (2009) Sub-Basin Level Flood Action Plan Tisza River Basin, International Commission for the Protection of the Danube River—Flood Protection Expert Group, Hungary, Romania, Slovakia, Serbia, Ukraine
* * * (2013) Best Practice for Building and Working Safely on Ice Covers in Alberta. Government of Alberta, Occupational Health and Safety Contact Centre, http://work.alberta.ca/occupational-health-safety/274.html
* * * (2013) Guide for the activity of hydrometric stations on rivers, N.I.H.G.A., Bucharest
* * * Cold Regions Research and Engineering Laboratory (CRREL) of the U.S. Army Corps of Engineers, http://www.erdc.usace.army.mil/Locations/CRREL/
* * * Photo source 1: https://map.viamichelin.com/map/carte?map=viamichelin&z=4&lat=50.45043&lon=30.52449&width=550&height=382&format=png&version=latest&layer=background&debug_pattern=.*;
* * * Photo source 2: https://upload.wikimedia.org/wikipedia/commons/9/95/Romania_Ukraine_Locator.png
* * * Records of S.T.B.W.A. - M.W.M.S. (Maramureș Water Management System)
* * * Records of S.T.B.W.A. (“Someș-Tisa” Basin Water Administration, Cluj)
* * * (2016) Microsoft Office Home and Student
* * * (2008) The Climate of Romania. National Administration of Meteorology, Edit. of Romanian Academy, Bucharest
Acknowledgements
We want to thank the Administration of the “Somes-Tisa” Water Basin, Cluj (S.T.W.B.A.), and Maramureș W.M.S. for the provided data and for the pictures captured during the extreme winter events in the analyzed basin. Thank you also all those who have offered or will offer suggestions for the improvement of the present paper.
Author information
Authors and Affiliations
Corresponding author
Editor information
Editors and Affiliations
Rights and permissions
Copyright information
© 2018 Springer International Publishing AG, part of Springer Nature
About this chapter

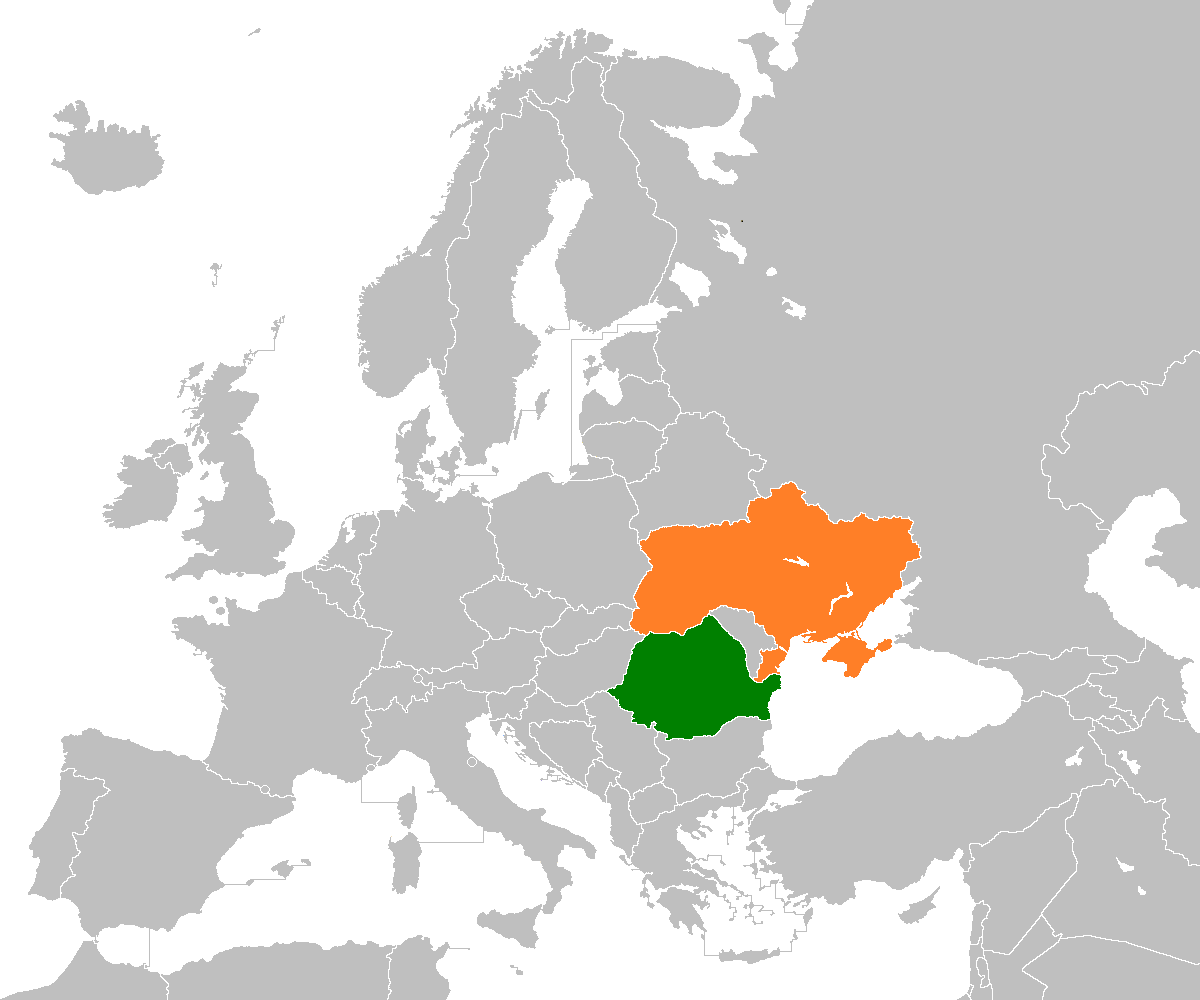
Cite this chapter
Sabău, D., Şerban, G., Kocsis, I., Stroi, P., Stroi, R. (2018). Winter Phenomena (Ice Jam) on Rivers from the Romanian Upper Tisa Watershed in 2006–2017 Winter Season. In: Zelenakova, M. (eds) Water Management and the Environment: Case Studies. WINEC 2017. Water Science and Technology Library, vol 86. Springer, Cham. https://doi.org/10.1007/978-3-319-79014-5_7
Download citation
DOI: https://doi.org/10.1007/978-3-319-79014-5_7
Published:
Publisher Name: Springer, Cham
Print ISBN: 978-3-319-79013-8
Online ISBN: 978-3-319-79014-5
eBook Packages: Earth and Environmental ScienceEarth and Environmental Science (R0)