
Abstract
Prediction of cracking by autogenous, drying shrinkage and thermal strain requires the knowledge of the development of mechanical properties. The main objective of this chapter is to describe the evolution of the mechanical properties, i.e., elastic properties, strengths, shrinkage, and creep, in cement-based materials. Mechanisms and experimental evidences are given thereafter. The influence of mix design, aging, stress level, cracking, etc., is reported. However, evolution of properties regarding interfaces in the case of prestress concrete, for instance, is not discussed (bond behavior). This chapter has strong interactions with the other chapters regarding the modeling (Chap. 2: hydration, Chap. 3: thermal strain, and Chap. 7: shrinkage, creep and cracking).
Access provided by Autonomous University of Puebla. Download chapter PDF
Keywords
These keywords were added by machine and not by the authors. This process is experimental and the keywords may be updated as the learning algorithm improves.
4.1 Introduction
This chapter gives a description of the main mechanical properties that will govern cracking due to the restraint of strains (mainly shrinkages) in massive concrete structures. Delayed strains (free deformations and creeps) and quasi-static properties are summarized. Models are presented in Chap. 2 (hydration), Chap. 3 (thermal strain), and Chap. 7 (shrinkage, creep and cracking).
The total strain reads (see also Fig. 4.1):
where ε, ε e , ε sh , ε th , ε cr , and ε in are the total, elastic, shrinkages (autogenous and drying strains), thermal, creeps, and other inelastic (i.e., “cracking”) strain tensors, respectively. Shrinkages and thermal strains are free strains. This strain model takes in account that the strain effects can be superimposed. In fact, these strains are linked: drying and hydration as well as cracking and (non linear) creep are coupled, for instance. Specific care should be taken in the case of complex analysis.

Conventional decomposition of the strains: elastic, shrinkages, and creeps (without cracking)
In order to predict the cracking risk if cracking is not taken into account, stresses (or elastic strains) have to be calculated and compared to the strength (or the strain) criteria. For unidimensional problem, stress reads (assuming that inelastic strains are equal to zero):
where E c is the Young modulus.
The shrinkage acts as the motor of cracking, but it is important to take into account the creep strains that may act positively here; i.e., they will lead to a global reduction of the amplitude of stresses during early age (Fig. 4.2 and Eq. 4.3). Note that creep strains have negative impacts; in general, they contribute to reduce the service life of the structures in cases like loss of prestress, generation of differential settlement in structures, excessive deflections.

Simplified evolutions in the case of an external restraint: free strain (a) and stresses (b) for a massive concrete structures (Delsaute et al. 2016a) with expansion (swelling, thermal strain) followed by contraction (autogenous shrinkage, thermal strain); stresses if only free contraction occurs (c)
Using the age-adjusted effective modulus method, without taking into account aging, a crack index, I cr , can be roughly estimated (more details are given in Chap. 8):
where f ct is the tensile strength, χ is an aging coefficient, \(\varphi\) is creep coefficient, and R is the restraint coefficient (see Chap. 8). Note that if R is equal to zero, there is no restraint (free shrinkage/thermal strain occur) and if R is equal to one the restraint is full (the total strain is equal to zero).
Note that the cracking index may have a different expression; in this case, more this coefficient is important more the cracking risk is high.
Then using numerical or code models, cracking opening and spacing can be estimated (see Chaps. 7 and 8).
4.2 Static Behavior of Concrete
Development of mechanical properties of concrete is related to the hydration process of cement. To express this dependency, development of mechanical properties can be defined as a function of maturity (with the effect of temperature expressed with the equivalent age) or degree of hydration (or degree of reaction, or degree of heat development). These two approaches are developed hereafter.
Time development of material properties is defined by the function \(\beta_{c}\) that expresses gain in time with respect to the reference value of a given property:
where n is a material parameter (depending on the type of cement in particular), X is the material property at time t, and X28 is the material property at 28 days.
One of the formulations of the time-development functions is with the exponential function which was introduced by Reinhardt et al. (1982). The exponential time development is suggested by the European standards. Brazilian Standard NBR 6118, Model Code (1990, 2010), and Eurocode 2, for instance, propose the following function to describe the time development of mechanical properties:
where t is time (in days) and s is a coefficient dependent on the type of cement.
Alternatively, a hyperbolic function was introduced by Kee (1971). The ACI Report 209 and JSCE (2010) suggest the following function:
where a and b are experimental coefficients dependent on the type of cement.
Recently, a new model has been proposed by Carette and Staquet (2016) for accurate evaluation of the very early-age development of the mechanical properties. The model uses an exponential function as it is expressed in the following equation:
where p and r are experimental coefficients dependent on the material and of the mechanical property. Parameter p (in days) is relative to the time at which the main increase of the property occurs, and is therefore affected by the type of cement. As shown in Fig. 4.3, the p parameter of a given cement is higher for compressive strength than for tensile strength and for the elastic modulus. On the other hand, the r parameter is equal to 1 for the compressive and tensile strength and must only be considered in the case of the elastic modulus, in which initial increase is fast in comparison with the strength development. For the elastic modulus, the value of r depends on the cement type and is generally in the range of 1 up to 1.5.

Relative evolution of Young’s modulus (E c ), tensile strength (f ct ), and compressive strength (fc) with respect to degree of hydration and equivalent age (Azenha 2009)
To account for the fact that concrete exhibits actual strength after it reaches a threshold age, t s , corresponding to initiation of hardening (setting, see Chap. 2), the time component is replaced by the t − t s (for t > t s ) component (Rifai et al. 2016). The exponential formulation is used by numerous authors in Europe (Jonasson 1994; Larson 2003; Kanstad et al. 2003b; de Schutter and Vuylsteke 2004; Azenha et al. 2009; Craeye et al. 2009; Klemczak and Knoppik-Wróbel 2014). The hyperbolic formulation is popular among Far Eastern authors (Yuan and Wan 2002; Xiang et al. 2005). Nevertheless, both approaches prove to give results for development of strength and stiffness compliant with experimental data but material parameters which are dependent on the type of cement—especially the n exponent—should be adjusted based on the experimental data provided (fib Bulletin 70; Sofi et al. 2012; Klemczak and Knoppik-Wróbel 2014).
To account for the influence of temperature, the most popular approach is to apply the equivalent age t e (related to maturity) instead of time t in definition of time dependence. This approach was applied in standards, e.g., Model Code (2010) or Eurocode 2, and is popular in the literature of the subject (Waller et al. 2004; de Schutter and Vuylsteke 2004; Craeye et al. 2009; Klemczak and Knoppik-Wróbel 2014):
where E a [J mol−1] is the activation energy, R is the constant for perfect gas (8.314 J mol−1 K−1), T is the temperature [K], and T ref is a temperature reference [K]. In some standards, the activation energy is fixed at a constant value (e.g., E a /R = 4000 K in Eurocode 2), whereas experimental results show that it depends significantly on the type of cement (Schindler 2004).
Some authors relate the change in mechanical properties of early-age concrete to the degree of hydration \(\alpha\), degree of reaction (which corresponds to \(\beta_{c}\)), or degree of heat development \(\alpha_{Q}\) (de Schutter and Taerwe 1996; Gutsch and Rostásy 1994; Faria et al. 2006; Estrada et al. 2006; Benboudjema and Torrenti 2008; Briffaut et al. 2011; Buffo-Lacarriere et al. 2014, 2016). In that approach, development of material properties is related to the final value when the hydration process ends (\(\alpha = \alpha_{\infty }\)). The time development \(\beta_{c}\) is expressed with the function of hydration rate proposed by de Schutter and Taerwe (1996) after Carino (1982):
where \(\alpha_{0}\) is a threshold value (percolation threshold corresponding to the setting, see Chap. 2) of the degree of hydration below which no strength development occurs and \(\alpha_{\infty }\) is the degree of hydration at infinite time (it can be replaced by the value at a reference time, 28 days for instance, especially in the case when dealing with the degree of heat development). This equation also can be expressed in terms of degree of reaction.
However, recent early-age measurements tend to show that the mechanical properties of concrete are affected by hydration even before the setting time. Carette and Staquet (2016) observed that after the dormant period, all newly formed reaction products induce an increase of mechanical property. For an accurate evaluation of the very early-age development of the mechanical properties, Carette and Staquet (2016) therefore highlight the relevance of Eq. (4.9). They propose to use this model since the very early age up to hardened concrete.
As a matter of fact, this equation is equivalent to Eq. 4.9 in which \(\alpha_{0}\) is equal to 0 and where \(\alpha_{\infty }\) is equal to 1.
Regardless of the approach used for estimating the relative evolution of mechanical properties (based on maturity/equivalent age or degree of hydration/reaction), it is generally admitted that the Young modulus E c evolves faster than the tensile strength f ct , which in turn evolves faster than the compressive strength f c , as it can be seen in Fig. 4.3.
4.2.1 Compressive Strength
Development of the compressive strength of concrete can be expressed with a time-development function with respect to its reference (usually 28 days) value (n = 1 in Eq. 4.4):
A comparison of different models was made by Klemczak and Batog (2014). Table 4.1 collectively presents the compared functions, and Tables 4.2 and 4.3 show the values of the parameters used. Figures 4.4 and 4.5 show the results of comparison of these models.


Development of strength according to different time-based functions: comparison (Klemczak et al. 2016)

Development of strength according to different degree of hydration-based functions: comparison (Klemczak et al. 2016)
Using Eq. 4.9, development of the compressive strength of concrete can be expressed as:
Depending on the concrete composition (especially the cement type), the value of n exponent ranges between 0.84 and 1.4 according to de Schutter and Taerwe (1996) and between 1.2 and 2.4 according to Carette and Staquet (2016).
4.2.2 Tensile Strength
Development of tensile strength can be also expressed with the same time-development function, \(\beta_{c}\), adding a power term n:
For early-age concrete, Eurocode 2 suggests that the rate of tensile strength development is the same as the rate of compressive strength development (n = 1), although most of the authors suggest that tensile strength develops faster than compressive strength (n < 1). Depending on the concrete composition (especially the cement type), the value of n exponent ranges between 0.50 and 0.67 according to Kanstad et al. (2003a, b).
Using Eq. 4.9, development of the tensile strength of concrete can be expressed as:
Depending on the concrete composition (especially the cement type), the value of n exponent ranges between 0.46 and 0.88 according to De Schutter and Taerwe (1996) and between 1 and 2 according to Carette and Staquet (2016).
The tensile strength can be obtained from direct uniaxial test, splitting test, or bending test. The Eurocode 2 proposes that the uniaxial tensile strength is equal to 90% of the splitting test, whereas the Code Model 2010 assumes due to the variability of experimental results to take the same value. The bending strength is higher than the uniaxial tensile strength, which can be explained by the size effect (see thereafter). The tensile strength can be calculated in model code from the compressive strength, but the literature shows a significant scatter.
Several authors observe a significant size (scale) effect. According to Rossi et al. (1994), this effect on concrete in tension is a very important problem when the cracking process of a concrete structure is concerned. This scale effect results in the increasing concrete tensile strength with the decreasing volume of material stressed. This phenomenon is the consequence of the existence of two characteristics of the material: its strong heterogeneity and its important brittleness in tension (Weibull theory, based on the weakest link concept). Its heterogeneity is mainly due to the difference of Young’s modulus between the cement paste and the largest aggregate of the concrete.
An experimental study, performed at Institut Français des Sciences et Technologies des Transports, de l’Aménagement et des Réseaux (IFSTTAR) twenty-five years ago (Rossi et al. 1994), concerned uniaxial tensile tests carried out on various concretes (different mix design and compressive strength) and on different specimens size. A strong scale effect was found. Similar results have been obtained by van Vliet and van Mier (2000). In the framework of their study, Rossi et al. (1994) proposed relations to quantify this scale effect. These relations are the following:
where m(f ct ) is the mean value of the uniaxial tensile strength, \(\alpha\)(f ct )/m(ft) is the coefficient of variation related to the uniaxial tensile strength, V S is the specimen volume, V A is the largest aggregate volume, a = 6.5, b = 0.25 − 3.6 × 10⁻³ f c + 1.3 × 10⁻⁵ f 2 c , A = 0.35, B = 4.5 × 10⁻² + 4.5 × 10⁻³ f c − 1.8 × 10⁻⁵ f 2 c , f c is the concrete compressive strength obtained from the French standardized specimen (cylinder with a height of 320 mm and a diameter of 160 mm).
These relations have been validated for 35 MPa ≤ fc ≤ 130 MPa (they have not still been validated for early-age concretes).
In the framework of the same study, it was found that the mean value of the Young modulus of concrete in tension is independent of the volume of material stressed but its coefficient of variation increases with the decreasing volume stressed. This decreasing is quantified by the following relation:
with C = 0.15 and D = 0.16 + 2.7 × 10⁻³ f c − 3.4 × 10⁻⁶ f 2 c .
4.2.3 Young’s Modulus
Time-development function can be also used for description of development of the Young modulus. Thus, this development is usually related to development of compressive strength of concrete (as in the case of tensile strength, the literature shows a significant scatter). Most often the square root function suggested, e.g., implicitly in Model Code (2010) as a square root of time-development function:
or explicitly in JSCE (2010) and ACI Report 209, respectively:
or explicitly in JSCE (2010) and ACI Report 209, respectively:
which complies with observations with other authors who show that the value of exponent of the time-development function, depending on the concrete mix composition, ranges between 0.30 and 0.43 (Kanstad et al. 2003a, b).
Some authors emphasize that the Young modulus differs in compression and tension. It is generally stated that the tensile Young’s modulus is higher than the compressive Young’s modulus (Brooks and Neville 1977; Atrushi 2003).
Using Eq. 4.9, development of the Young modulus of concrete can be expressed as:
Depending on the concrete composition (especially the cement type), the value of n exponent ranges between 0.26 and 0.62 according to de Schutter and Taerwe (1996). However, these values are determined considering a \(\alpha_{0}\) between 0.1 and 0.3. More recent measurements at very early ages of the elastic modulus indicate that E c can reach significant values even for a degree of hydration lower than 0.05 (Krauss and Hariri 2006; Carette and Staquet 2016). Therefore, Carette and Staquet (2016) suggest lower values for \(\alpha_{0}\) (between 0.05 and 0.1) as well as higher values for the n exponent (between 0.4 and 0.8) (Carette and Staquet 2016).
Upscaling methods based on micromechanics have been used to estimate the Young modulus for different concrete compositions (Bernard et al. 2003; Constantinides and Ulm 2004; Sanahuja et al. 2007; Stefan et al. 2010). Such estimations are dependent on the precise knowledge of the cement composition and hydration kinetics as well as the elastic properties of the hydrates, cement, and aggregates.
4.2.4 Poisson’s Ratio
Poisson’s ratio is found to be very few dependent of the concrete mix and (Neville 2000) suggests using the value of 0.2 regardless the concrete mix (this value is also assumed in Eurocode 2). Regarding the elastic Poisson’s ratio, according to Boumiz et al. (1996) and (Byfors 1980), the Poisson ratio decreases from 0.48 to about 0.15 with respect to the \(\alpha\). De Schutter and Taerwe (1996) report a sharp decrease from 0.5 (as in incompressible liquid) to 0.11 of the Poisson ratio, followed by an increase up to 0.18. This sharp decrease has also been reported by Habib et al. (2002). According to Bernard et al. (2003), the decrease of Poisson’s ratio occurs as long as the water phase is continuous and is due to the consumption of water during the hydration process. When the cement begins to set, the water phase becomes discontinuous and the evolution of Poisson’s ratio is then governed by the solid stiffness evolution which will increase Poisson’s ratio. It can be modeled using the degree of hydration (de Schutter and Taerwe 1996) or the equivalent time (Delsaute et al. 2016a):
where \(t_{eq}\) is expressed in hour.
Similar to the Young modulus, homogenization methods have been applied to estimate the elastic Poisson’s ratio (Bernard et al. 2003; Sanahuja et al. 2007; Stefan et al. 2010).
It should be emphasized that some numerical simulations (Azenha 2009; Briffaut et al. 2012) showed that the impact of the variation of Poisson’s ratio is not significant and can be disregarded for the prediction of cracking at early age.
4.2.5 Strain Capacity
Strain capacity (named also the peak strain in tension) in tension defines the allowable magnitude of tensile strain of concrete before cracking. At any time t or degree of hydration \(\alpha\)(t), it can be determined as a ratio between the tensile strength and the Young modulus of concrete (1D):
where ε ctu is the strain capacity. Note that, it can be extended to 3D and this approach is similar to the one used with a stress approach in the case of non-aging elasticity.
The strain capacity depends in a significant way on the aggregate’s properties (see de Schutter and Taerwe (1996) and Roziere et al. (2015), for a review, for instance). Its evolution showed a minimum corresponding to the period that includes the setting time and early hardening, due to a very rapid increase of strength from the end of setting. Therefore, this is a critical stage for plastic shrinkage cracking (Roziere et al. 2015). However, Roziere et al. (2015) found that the strain capacity values are closely linked to the experimental procedure (i.e., loading rate). From these results, they suggest that an approach based on strength and stresses would be more reliable if early-age cracking is concerned. Hammer et al. (2007) proposed the same conclusion.
4.2.6 Fracture Energy
Energy needed to create a localized macro-crack in concrete (fracture energy) is also modified by the hydration process at early ages. Very few results exist in the literature concerning the evolution of this property.
De Schutter and Taerwe (1996) presented some results on concrete with a degree of reaction quite high (0.8–1) and extrapolated a variation law similar to the one proposed for elastic and strength properties (see previously) to lower degree of reaction:
where Gfmax is the maximal value of fracture energy that can be reached for the given formulation (in the same environmental conditions that the ones used for the test). This relationship is commonly used with cracking model (e.g., Benboudjema and Torrenti 2008; Buffo-Lacarriere et al. 2014, 2016). Some experimental results are given in Fig. 4.6.

Another approach based on the maturity concept was proposed by Bassam et al. (2007). The variation of fracture energy according to time is evaluated as follows using a thermal activation of mechanical development properties:
where G fu is the fracture energy reached at high ages for the given formulation of concrete and in environmental conditions similar to the test ones E/R is the relative activation energy, T k is the temperature, and \(\beta\) is a fitting parameter.
This approach was validated on fracture energy measurements obtained at different curing temperatures (14, 23, and 35 °C) and at testing ages from 1 to 28 days (see Fig. 4.7).

Fracture energy according to time for different curing temperatures (Bassam et al. 2007)
The quick variation of fracture energy at very early age (in regard with the elastic properties or strength, for instance) that can be observed on Bassam’s results is confirmed in Kim et al. (2004), especially for normal and high performance concrete (NS and HS, Fig. 4.8) and in Kolani et al. (2011), which compared for a same concrete, the development of fracture energy with the one of tensile strength (Fig. 4.9).

Variation of fracture energy for low performance concrete (LS), normal concrete (NS), and high performance concrete (HS) (Kim et al. 2004)

Comparison of tensile strength and fracture energy development (Kolani et al. 2011)
4.2.7 Multiaxial Stress State
Failure of concrete element should be analyzed in a complex, three-axial stress state allowing to determine the character of the occurring crack (fib Bulletin 70). The failure is referred to the failure surface, which is a spatial representation of possible states of stresses for a material. The strengths of the material in certain specific stress states, such as uniaxial compression or tension, or biaxial compression or tension, are the points on the surface.
The biaxial compressive strength can be calculated as follows (fib Bulletin 70):
Regarding the biaxial tensile strength, it is similar to the one in uniaxial tension, suggesting that the orthogonal cracks do not interact significantly.
4.2.8 Experimental Test Methods
The test procedure to measure the Young modulus is not universal and differs according to the country. The different standards have in common to apply several consecutive loads on a sample. According to the European standard EN 12390-13, three preliminary loading cycles have to be applied in order to control the stability and the centering of the sample inside the press with a loading rate corresponding to (0.6 ± 0.2) MPa/s up to a load of 10–15% of the compressive strength. Then, three loading cycles are performed in order to define the secant Young’s modulus. During these cycles, the stress varies between the maximal load applied during the preliminary loadings and the third of the compressive strength. For each loading, the load is kept constant during maximum 20 s. According to the ASTM Standard C469, at least two loading cycles have to be performed to define the chord Young’s modulus. The load is applied at a constant loading rate within the range of (241 ± 34) kPa/s (hydraulically operated machine) or at constant displacement rate of about 1.25 mm/min (testing machines of the screw type). No preliminary loading is applied, and the load varies between 0 and 40% of the compressive strength. The longitudinal displacement is generally measured by means of strain gauges or an extensometer.
For the computation of Poisson’s ratio, the transversal displacement is also necessary and is defined either by measuring the radial displacement (e.g., extensometer with elastic anchorage) or the circumferential displacement of the specimen (e.g., strain gauges and extensometer).
Currently, no recommendation or standard test method exists for the determination of the Young modulus for concrete at very early age. The experimental challenge lies in the fact that the monitoring must be fully automatic since the earliest age because the hardening process of the concrete takes place continuously over a period counted in hours and even in days after the casting time. Recently, new test procedures and devices were developed for the monitoring of the Young modulus since the casting or the final setting till several days by means of repeated loadings (Staquet et al. 2012; Boulay et al. 2012; Delsaute et al. 2016c; Boulay et al. 2014; Karte et al. 2015 and Irfan-ul-Hassan et al. 2016). Two different sorts of test protocol were developed. The first kind of protocol imposes a constant displacement (Boulay et al. 2014) or force (Karte et al. 2015) threshold for each loading during the whole test. The second protocol considers the evolution of the compressive strength, and the load applied corresponds to 15 (Irfan-ul-Hassan et al. 2016) or 20% (Delsaute et al. 2016c) of the compressive strength.
To perform mechanical test since casting or setting, it is needed to test the sample directly in the mold. Such test was performed in Delsaute et al. (2016c) with a Temperature Stress Testing Machine (Staquet et al. 2012) for which the sample is loaded horizontally or with another vertical device BTJASPE (Boulay et al. 2012) for which the sample is loaded vertically. For each case, a thermal regulation surrounds the sample before and during the test in order to control the temperature inside the sample.
4.3 Shrinkage
Early-age cracking is generally due to volumetric changes, caused by autogenous and drying shrinkages, resulting from water movement and thermal gradients. If the cementitious material is free to move, concrete shrinkage and expansion produce few consequences. Nevertheless, deformation may occur if there are external or internal concrete restrictions. In these cases, the tensile stresses may induce the occurrence of micro-cracks, which can connect to each other to form cracking, seriously impairing the service life and aesthetics of the structure (Lopes et al. 2013). The origins of the deformation occurring in concrete are shown in Fig. 4.10. It should be noticed that the term “shrinkage” is generally used when referring to the combination of the hydration- and drying-induced deformations due to the fact that they generally result in overall shrinkage. The terms “autogenous deformation” and “drying deformation” could be more appropriate.

Schematic view of the strain mechanisms contributing to the concrete shrinkages
The process of concrete hardening is accompanied with moisture migration which can lead to reduction of concrete volume and consequent shrinkage of a concrete element. The water is transported within and out of concrete element due to various phenomena. The loss of water through desiccation and evaporation at the surface of the element is called drying shrinkage. Desiccation of water is driven by concentration gradients within the elements caused by humidity difference between the element and the ambient surrounding with a RH lower than that found in the capillary pores. Water is transferred by vapor transfer and capillary transfer. On the other hand, in autogenous shrinkage, there is a decrease in internal RH by self-desiccation in the cement paste due to the consumption of evaporable water during hydration reactions. The autogenous deformation is governed by a combination of chemical shrinkage, self-desiccation, and swelling, with the influence of the former one more pronounced in the very early ages (before setting). Chemical shrinkage results from the reduction in material volume as water is consumed by hydration: When water and cement react, the volume of the products of this reaction is 7–10% less than that of cement (clinker) and water. After the setting time, this mechanism induces a decrease of the internal RH by self-desiccation. In parallel, some hydration products are known to generate expansion of the cement matrix at early age, thus resulting in overall swelling. The self-desiccation deformation is often considered proportional to the degree of hydration (Ulm and Coussy 1998; Mounanga et al. 2006; Benboudjema and Torrenti 2008; Briffaut et al. 2016; Honorio et al. 2016).
Thermal strains are analyzed in Chap. 3.
4.3.1 Autogenous Shrinkage
4.3.1.1 Mechanisms
Jensen and Hansen (2001) were among the first to propose a unified nomenclature regarding autogenous shrinkage and description of its mechanisms. A revision of the mechanisms supported with experimental and modeling studies was presented also by Lura et al. (2003).
During hydration of cement, reduction of volume of reaction products (hydrated cement) is observed with regard to the volume of the constituents (unhydrated cement and water). This phenomenon is referred to as chemical shrinkage and reaches approximately 6–7 ml per 100 g of cement (clinker) reacted (“le Châtelier” contraction, Taylor 1990). Before setting, when the material is still in plastic stage, chemical shrinkage manifests in overall volume reduction, and in this stage the cracking may be caused by the lack of deformability not by stress (phase 1 in Fig. 4.11).

Phases of autogenous shrinkage development
After setting takes place, the decrease in the absolute volume becomes incompatible with deformations mechanically permissible by the emerging mineral skeleton and thus chemical shrinkage manifests in creation of large empty pores (phase 2 in Fig. 4.11). A progressive desaturation of capillary pores due to hydration of the cement and a decrease in the internal relative humidity occur (called self-drying or self-desiccation; the Fig. 4.12 summarizes some experimental results of drop of relative humidity in autogenous conditions). This phenomenon stops usually at relative humidities below 75% (Hua et al. 1995). There are three physical mechanisms explaining this phenomenon (Hua et al. 1995):
-
1.
With consumption of water from smaller and smaller pores in the course of hydration and formation of gas-filled pores, menisci form on the water–gas interfaces due to the action of surface tension (Lura et al. 2003; Jensen and Hansen 2001). This leads to an increase of capillary tension in pore fluids in accordance with Young–Laplace law and corresponding decrease of RH in accordance with Kelvin law. Capillary tension in pore fluid is balanced by compressive stress in the solids ((1) in Fig. 4.13).
Fig. 4.12 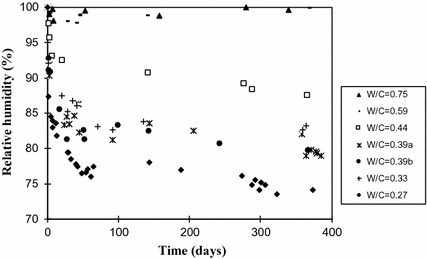
Drop of relative humidity in autogenous conditions for different water-to-cement ratio (Yssorche-Cubaynes and Olivier 1999)
Fig. 4.13 
Schematic representation of the capillary depression
-
2.
Reduction of thickness of water adsorbed on solid surfaces ((2) in Fig. 4.13), leading to increase of surface tension of the solids (mechanism leading to shrinkage) and
-
3.
Decrease of the disjoining pressure ((3) in Fig. 4.13) in hindered adsorption areas (mechanism leading to shrinkage).


Although the mechanisms leading to autogenous shrinkage are still not fully understood, the three aforementioned mechanisms have been debated in an attempt to understand the driving forces behind autogenous shrinkage. However, there is agreement about relationship between autogenous shrinkage and changes in RH in the pores of hardened cement paste (Lopes et al. 2013). The dominating role of capillary tension has been shown in several studies (e.g., Lura et al. 2003; Hua et al. 1995; Gawin et al. 2008).
The thermodynamic approach to explain capillary pressure mechanism involves two aforementioned macroscopic laws: Kelvin law (Eq. 4.29) and Laplace law (Eq. 4.30). They describe directly the water liquid–vapor equilibrium and mechanical equilibrium of a meniscus set at both sides at different pressures, respectively. The Kelvin law reads:
where P c is the capillary pressure, P l and P g are pressures of liquid water and gas, respectively, R is a universal gas constant (8.314 J/(mol K)), M is the mass of a water molecule (18 × 10−3 kg/mol), T is the temperature (K), \(\rho\) is the specific volume of water (kg/m−3), and RH is the relative humidity in the capillary pore. At a relative humidity of 90% and a temperature of 20 °C, the capillary pressure is equal to about −14 MPa.
The Laplace law reads:
where t is superficial tension at the gas–liquid interface (N/m), θ is the contact angle (°), and r is the radius of the capillary pore (m). At a relative humidity of 90%, a temperature of 20 °C and a contact angle equal to zero, the radius of the pore is equal to about 12 nm (without taking into account the thickness of adsorbed water layer).
Based on these laws, it is possible to link the intensity of capillary pressure (P c ), the pore radius (r) in which the meniscus is located, and the internal relative humidity (RH). With simple calculations, it can be shown that the capillary depressions can reach high values for pore sizes commonly found in the cement matrix. Thus, it is possible to see the autogenous shrinkage as the mechanical deformation of the solid skeleton under the effect of capillary pressure. During the hydration, the intensity of the capillary depressions increases for two reasons (Boivin 1999):
-
1.
Self-desiccation progresses throughout the material reaching narrower and narrower pores (decrease of the radius r of the capillary pores), causing a decrease in the internal relative humidity (RH) (Eq. 4.29).
-
2.
The porosity of the cementitious matrix is refined (decrease of the radius r of the capillary pores) during the self-desiccation, leading to stronger capillary depressions during the self-drying process (Eq. 4.30).
Self-desiccation shrinkage and autogenous shrinkage were distinguished by Jensen and Hansen (2001), with the latter including also deformation due to initial swelling (that cannot be explained by the thermal deformations) of other mechanisms occurring in addition to self-desiccation. Swelling may be of utmost importance since the ability of a concrete to develop low shrinkage deformation can lead to significant durability improvement. Several mechanisms are proposed to explain this behavior (Carette 2015):
-
1.
Water absorption by concrete leads to a swelling behavior due to the canceling of self-desiccation deformation (Bjøntegaard et al. 2004). In autogenous conditions, this excess water can either come from bleeding or from the water contained in the aggregates.
-
2.
In the presence of fine particles (fillers) in concrete, significant early-age swelling peaks can be observed. For instance, Esping (2008) observed swelling peaks up to 800 μm/m on self-compacting concrete. Similar observations were made with the incorporation of several filler fineness and nature (Craeye et al. 2010). According to Craeye et al. (2010), this swelling is due to the adsorption of water by the filler and the resulting disjointing pressure. He concluded that the swelling amplitude and kinetics were not only a function of the filler fineness but also to its nature.
-
3.
It has been observed that slow early-age swellings can occur due to the formation and growth of large size portlandite crystals (Baroghel-Bouny et al. 2006). This observation is mostly related to the size of the crystals rather than to their amount, as observed on various water/cement mixtures. This swelling is mainly attributed to CH crystals.
-
4.
The formation of ettringite is accompanied with an expansion. This property has led to the development of expansive concrete with the use of type K cements. Two mechanisms are proposed for this early-age expansion. First, it can be explained by the formation of ettringite around anhydrous or hydrated grains. Due to the porous aspect of ettringite (due to its needle-like structure), its volume occupies more space than its original constituents and therefore induces a matrix expansion as soon as it comes in contact with another ettringite layer (Bentur and Ish-Shalom 1974). In parallel, part of ettringite forms as colloidal particles in through-solution. These high specific surface particles result in water adsorption and therefore to an apparent cement expansion (Mehta 1973).
4.3.1.2 Main Influencing Parameters
The binder. Autogenous shrinkage depends strongly on the type of cement—its chemical composition and morphology (Baroghel-Bouny 1994). Increased amounts of C3A and C4AF visibly contribute to increased shrinkage at early age (Justnes et al. 1998, Parak et al. 1998) due to their high water consumption during hydration (Persson 2000; Beltzung and Wittman 2002).
The fineness of cement influences self-desiccation shrinkage due to its impact on the porosity of the material: For the same progress of hydration reactions, finer cement also leads to a finer porous network. The intensity of the capillary depressions caused by self-drying is therefore higher (van Breugel 1991). The reactivity of cement is also influenced by this parameter: Greater fineness of cement increases its reactivity, leading to accelerated development of autogenous deformation and an increase of its final value (Jensen 2000).
In addition to the chemical composition of cement, it is also necessary to consider the influence of mineral additions on autogenous deformation concerning their pozzolanic behavior and their role as filler. It should be noted, however, that in cementitious materials containing blast-furnace slag swelling of the cementitious matrix may appear at very early age (<24 h) (Darquennes et al. 2011; Aly and Sanjayan 2008; Carette et al. 2017) which may lead to a decrease in total autogenous shrinkage. As a matter of fact, such swelling can be observed even for usual concrete at very early age. Carette et al. (2017) observed this for various concrete compositions containing various amounts of blast-furnace slag and limestone filler. The high swelling deformations observed in Fig. 4.14 are attributed to the ettringite formation, which is highly increased in presence of blast-furnace slag. Limestone filler also contributes to the swelling by similar mechanisms (Carette et al. 2017).

Autogenous deformations including swelling and self-desiccation in presence of CEM I, limestone filler, and blast-furnace slag (Carette et al. 2017)
W/C ratio. Autogenous shrinkage depends strongly on the water/cement ratio (w/c) due to its impact on reduction of the internal relative humidity. In concretes with low w/c ratio (less than 0.4), such as high performance concretes, autogenous shrinkage develops faster and reaches the final value at younger age than that of concretes with higher w/c. This behavior is caused by the decrease of the internal relative humidity which is more important for self-desiccation in a finer porous network (Boivin 1999; Holt 2005; Lopes et al. 2013). Generally, for concrete this type of deformation is significant only below a w/c ratio of 0.4 (Baroghel-Bouny and Kheirbek 2000).
For concretes with high w/c ratio (higher than 0.4), autogenous swelling develops just after the final setting. In Delsaute et al. (2016b), several tests on concrete with different w/c ratio were performed and are shown in Fig. 4.15. It is observed that the higher the w/c ratio, the greater the duration and the amplitude of swelling.

Evolution of the autogenous strain for different water–cement ratios (0.4–0.5 and 0.6). Adapted from (Delsaute 2016b)
Aggregates. The porosity of aggregates and their humidity influence the value of shrinkage much more when the w/c ratio is low (Toma 1999). Dry aggregates will absorb water which remained available for the hydration, leading to a decrease in the w/c ratio producing a denser cement paste structure with finer pores. The capillary depressions will be higher, generating more significant shrinkage. The wet aggregates (porous) will play the role of reservoir and provide additional water when the water is partially consumed by the hydration of cement. This will result in an increase in the w/c ratio and reduced shrinkage.
4.3.1.3 Amplitude of Strains
Table 4.4 presents the magnitude of the autogenous shrinkage strain after 28 days for conventional concrete—based on the EC2 Part 1.1—and with additions. However, as observed previously, these values are the result of a combination of swelling and shrinkage. It is to be expected that specific concrete compositions might present overall swelling, especially in presence of high amount of blast-furnace slag and with high w/c ratio. For instance, Carette et al. (2017) observed amplitude of autogenous deformation of 100 µm/m for OC, of 50 for OC with slag, and a negative value of −50 for OC with slag and limestone filler.
4.3.1.4 Experimental Test Methods
Different methods exist for the determination of the autogenous deformations. The methods can be in general divided into linear and volumetric. It is normally assumed that the volumetric autogenous strain is isotropic; thus, the linear autogenous strain can be approximated as one-third of the volumetric one. In the linear method, elongation and shortening of a sample kept in isothermal condition are followed by either measurements of the sample length change with, e.g., LVDTs or optical systems or by strain measurements on the sample with, e.g., strain gauges or vibrating wire extensometer. In the volumetric method, the sample is immersed in the bath containing liquid of known density; see, e.g., (Loser et al. 2010). By suspending the sample from the balance, the volume changes can be followed by measuring apparent mass changes of the immersed sample.
Moreover, autogenous strain is very sensitive to the conditions of preservation of the specimen and to many factors related to the test rig. For that reason, several recommendations were developed in the past (Bjøntegaard et al. 2004; Hammer et al. 2007; ASTM Standard C1698; Jensen and Hensen 2001). The main common requirements for all the apparatus for free deformation test in sealed condition are their ability to:
-
perfectly seal the specimen in order to avoid any external drying or water uptake;
-
keep the temperature constant, which requires external control because the hydration of cement paste releases heat;
-
limit the friction with the specimen.
It should be noted that only the ASTM C1698-09 standards exist for cement paste and mortar. No standard has been developed for concrete material.
4.3.2 Plastic and Drying Shrinkage
The concrete plastic and drying shrinkage is the deformation caused by drying (transport of liquid water/water vapor to the outside) due to the lack of equilibrium between the humidity of the material and the surrounding environment. The excess water that has not reacted with the cement is subjected to various phenomena: diffusion of water vapor, permeation of liquid water and moist air, etc.
Just after the casting of concrete, water at the surface of fresh concrete can be lost by evaporation. As soon as the content of evaporated water is larger than the one coming from bleeding, a plastic shrinkage occurs. By definition, it occurs before the end of setting, and drying shrinkage takes over. The risk of cracking is quite of importance for thin elements (rendering mortars, screeds, etc.) since evaporating surfaces are more larger than their volume.
Plastic and drying shrinkage can be a priori neglected in massive concrete structures (dams, liquefied natural gas (LNG) reservoirs, containments in nuclear power plants, etc.). On the one hand, water exchanges are 103–106 times slower than the thermal phenomena and have influence only in a thin layer of concrete located near the surface of a massive structure. The resulting cracking may be only superficial. This cracking is, however, more damaging for thin structures (repair layers, paving, facade mortar, etc.). The cracking risk can be largely reduced if efficient curing is undertaken.
This strain component is therefore not detailed in this STAR.
4.4 Creep
Creep is the time- and stress-dependent strain which occurs under prolonged application of load. Creep strains are generally split into three components: basic creep, drying creep, and thermal transient creep (called also load-induced thermal strain). Basic creep is defined as creep occurring under no moisture exchange between the concrete and the environment at constant temperature. When moisture is exchanged with the environment at constant temperature, there is an additional creep component referred to as drying creep or Pickett effect. When temperature variation occurs, there is an additional creep component referred to as thermal transient creep.
Note that these definitions are purely conventional and several couplings exist between these three components. Indeed, basic creep, for instance, depends upon internal relative humidity and temperature, which evolves because of hydration. The variation of temperature may lead to evaporation or condensation of water, inducing drying and wetting, and vice versa. The creep effect can also interfere significantly in structural analysis because it changes stress behavior inside of the structure and consequently can modify design projects. This effect is known as a viscoelastic behavior, and it is often considered in structural analysis by means of creep coefficients or functions that try to explain the phenomenon by simplified models.
4.4.1 Basic Creep
4.4.1.1 Mechanisms
The mechanisms at the origin of creep have been investigated for several decades, but they are still not fully understood. This may be due to the fact of the phenomena being associated with various internal and external intervenient factors of the concrete that correlate among themselves (coupled phenomena) as well as the fact that its origin is linked to behaviors at the nanoscale, in which observation, evaluation, and monitoring are very difficult. Nevertheless, there is a general agreement that creep of concrete has its source in hydrates (mainly C–S–H), involves water, and at especially high stress, interacts with micro-cracking and debonding of the cement paste–aggregate interface.
Several theories for (basic) creep mechanisms have been proposed over the years to explain the origin of creep in cement-based materials (see Neville et al. 1983 for a review), but it is generally agreed that none of the proposed theories is capable to account for all the observed phenomena. None of them can explain in a unified way the behavior of concrete under various environmental conditions and under various states of stress (compression, tension, and multiaxial). Several mechanisms may be involved to explain creep.
Recently, short- and long-term components of the viscoelastic behavior are generally separated (see Fig. 4.16). The short-term (characteristic time is about a few days) component is reported to occur due to a change of the hygral equilibrium in the gas-filled space which generates strains, stresses, and micro-cracking (Ruetz 1968; Lohtia 1970; Wittmann 1982). This internal state stress of the micropores, though evolutionary, due to the hydration process at early ages is even less significant due to the transient state of formation of the concrete stiffness matrix causing the creep to be more significant in this component. This component is generally associated with the reversible part of creep. The long-term component corresponds to an irreversible viscous behavior which may be related to slippage between layers of C–S–H, and which would increasingly fade in time (Ruetz 1968; Lohtia 1970), and is supposed to occur at constant volume according to Acker and Ulm (2001). The creep rate of this long-term phenomenon evolves as a power function \(t^{n}\) (Bažant 1984; Wittmann 1982) with an exponent \(n\) between −1 and −0.9 according to Bažant (1995), between −0.72 and −0.69 according to results of Wittmann (2015) on concrete, and an exponent n between −0.86 and −0.6 on cement paste according to results of Tamtsia et al. (2004). Nanoindentation tests were carried out on C–S–H by Vandamme and Ulm (2009). It was shown that C–S–H exhibits a logarithmic creep at short term which is in agreement with results obtained on concrete at long term. Vandamme (2015) compared also this logarithmic behavior with other heterogeneous and porous materials with porosity including several orders of magnitude (soils and wood). For these non-aging materials, a logarithmic long-term creep was also observed. It can then be assumed that this long-term creep is not linked to a hydration process or any chemical specificity of the C–S–H.

Other mechanisms have been proposed more recently to explain basic creep. Sellier et al. (2015) suggested that sliding of C–S–H induces reversible (due to reversible arrangement of inter-layer water molecules) and irreversible (break and restoration of inter-layer bonds as in plasticity theory) creep. During creep, some material rearrangement (interlocking phenomena) occurs leading to consolidation. Rossi et al. (2012) proposed an alternative mechanism related to flow of water in cracks generated during creep, since acoustic emission showed a relationship between the number of acoustic events and the amplitude of strains.
The creep behavior of cement-based materials is aging; i.e., it depends on the loading age (see Fig. 4.17). Prestress concrete structures are loaded at later age, and they will creep less as autogenous/thermal strain restraint leads to stresses just after setting. Different phenomena can lead to this aging character: solidification of hydration products due to hydration process (Bažant 1977; Carol and Bažant 1993) or consolidation and/or space-filling processes at the C–S–H scale (Masoero et al. 2012).

Effects of loading age on basic creep in compression (Laplante 1993)
When shrinkage is restrained, tensile stresses occur. They can be preceded by compressive stresses if swelling or thermal expansion occurs. Therefore, it is important to assess if basic creep of concrete in tension and in compression occurs in the same manner. There is still no consensus in the literature on this topic as it is shown in Fig. 4.18. Due to the low tensile strength of concrete, micro-cracking may develop, propagate, and contribute more significantly to creep in tension: Effect of fiber content or cement paste content has inverse effects on total creep in tension and compression (Bissonnette et al. 2007).

Evolution of the ratio between specific compressive and tensile basic creep from different authors (Hilaire et al. 2014)
4.4.1.2 Main Influencing Parameters
Temperature. Creep is affected by temperature in several ways:
-
Creep for mature concrete is thermo-activated, and as the temperature increases, creep rate increases;
-
At early age, since hydration is thermo-activated, mechanical properties are increasing faster, reducing the creep rate;
-
If the temperature changes during the period of creep test, the creep rate may increase. This additional creep is named transient thermal creep or load-induced thermal strain.
Load-induced thermal strain has been extensively investigated for concrete at high temperature (in the context of concrete structures exposed to fire). However, results at early age are particularly scarce. The main mechanism may be related to the fact that temperature change leads to redistribution of inherent moisture in the cement paste as well as structural change—both of clear importance for creep. Illston and Sanders (1973) describe the rapid increase in creep, due to a positive change of temperature, as transitional thermal creep which is approximately independent of maturity, and is zero when the temperature decreases or when the temperature is raised to the given level for a second time. This means also that drop of temperature does not give any creep recovery. That a positive change in temperature of mature concrete increases creep is also confirmed by Arthanari and Yu (1967). He also observed that increasing of the temperature by several steps gives a higher creep than a steady temperature after a certain period of loading
Cement and mineral additions. The type of cement and mineral additions influences the type of hydration products and the rate of hydration reaction. Thus, development of mechanical properties, shrinkage, and creep is also affected.
Creep tests performed by Botassi et al. (2012) showed different behavior for early age at loading. Concrete with mineral admixture at one-day loading showed creep of 58–316% greater than the reference for many types of admixtures, while loading ages at 3 and 7 days creep behavior is inversed. In those ages creep concrete is reduced with mineral additions of up to 77% for blast-furnace slag than reference.
Igarashi and Kawamura (2002) suggested that the lower potential of creep for concrete with silica fumes results from the higher strength and the dense microstructure for such concrete.
Aggregate. Since creep strains occur mainly in the cement paste, aggregates act as a restraint element and reduce the potential of basic creep. The Young modulus is thus an important factor. For lightweight aggregate for instance, since its Young modulus is lower than typical aggregate, this type of concrete exhibits larger creep.
On Very Young Concrete
By means of compressive creep tests on very early-age concrete, Delsaute et al. (2016b) have observed that short-term creep can be divided into two parts. The first part occurs during the first hours after loading with constant kinetic and variable amplitude which is inversely proportional to the age of the material at loading. The second part occurs on longer duration with amplitude increasing with the age at loading and a faster kinetic evolution for very early-age loading. The effect of the age at loading is significantly more marked for the first part of the short-term creep. By comparison with the evolution of the microstructure, it is observed that the first part of the short-term creep is associated with the state of the material (capillarity pores, C–S–H, etc.) when the load is applied and more specifically to the largest diameter pores. The second part of the short-term creep is associated with the solidification theory of Bažant and Prasannan (1989) which links the evolution of the C–S–H to the decrease of the creep for early-age loading.
Through these observations, a new advanced experimental methodology was developed on concrete (Delsaute et al. 2016b) to monitor the basic creep at very early age. The methodology is based on repeated minute-long loading which starts just after the final setting of the material. Every 30 min, a load corresponding to 20% of the compressive strength is applied and kept constant during 5 min and then finally removed. The amplitude of the aging creep for short duration of loading is defined with the value of the creep coefficient obtained after 5 min of loading.
Age at loading. Results of the compressive creep compliance for short duration loading of 5 min are presented in Fig. 4.19. The effect of the age at loading is significantly marked on the amplitude of the creep compliance, especially just after the setting time. Each compressive creep curves are normalized by their value reach at the end of the plateau of stress. All repeated minute-long loadings are quasi-superimposed which leads to the conclusion that the kinetic of the specific creep is independent of the age at loading during the early age for duration of loading limited to 5 min. The same data analysis has been made for compressive relaxation test, and no kinetic effect is detected for creep and relaxation test in compression. Tensile creep and relaxation were also carried out, and no difference was also observed in the kinetic for age at loading between the final setting time and 100 h.

Repeated minute-long loadings. Left to right: For each repeated minute-long loading, creep curves are superimposed and set to zero when the load is kept constant. For each repeated minute-scale loading, creep curves are normalized by the value obtained after 5 min of loading. Mean values of normalized curve for creep and relaxation repeated minute-scale loadings in tension and in compression (Delsaute et al. 2014)
For the analysis of the evolution of the creep or relaxation amplitude, the value of the creep coefficient or the relaxation coefficient after a plateau of 5 min with constant stress or mechanical strain was used. This value is called amplitude factor. Fig. 4.20 presents the evolution of the amplitude factor for several creep and relaxation tests in compression. A same evolution of the amplitude factor is observed for creep and relaxation. Just after setting, the value of the amplitude factor obtained a value of 0.3 which means that the creep strain or the relaxation stress represents after 5 min of loading 30% of the elastic strain/elastic stress.

Amplitude factor for creep and relaxation repeated minute-long loading tests in compression (Delsaute et al. 2016b)
Water–cement ratio. A very similar methodology was also used by Irfan-ul-Hassan et al. (2016) in order to assess the aging of the viscoelastic behavior of cement pastes with three different water–cement ratios. The amplitude of the creep complaisance is influenced by the water–cement ratio. For high water–cement ratio, the creep complaisance obtained with short duration of loading (3 min) is higher for degree of hydration at loading between 0.3 and 0.65 (which corresponds to an age of the material varying between 24 and 168 h). However, when the evolution of the amplitude of the creep complaisance is compared to the gel–space ratio, a same general trend is observed as shown in Fig. 4.21.

Creep compliance in function of the gel–space ratio for three cement pastes with different w/c ratios (Irfan-ul-Hassan et al. 2016)
On Hardened Concrete
Age of concrete. As shown in Fig. 4.22, concrete age at application of load is a very important factor: More the concrete is old, less the concrete will creep. This phenomenon is observed at early age and at long term. Therefore, this age effect is related to the degree of hydration, but also to another phenomenon (polymerization and micro-prestress relaxation theories have been proposed in the literature (Bažant et al. 1997)).

Creep compliance for different age at loading (Browne and Blundell 1969)
4.4.1.3 Amplitude of Strains
Only few data are available in the literature for early-age concrete. Data obtained for very early age (<24 h) are nearly impossible to find. Recently, Delsaute et al. (2016b) have carried out several tests of long duration for age at loading of 15–20–24–40 and 72 h on an ordinary concrete with a CEM I 52.5 and a characteristic compressive strength of 40 MPa (Fig. 4.23).

Basic creep strain evolution for age at loading of 15–20–24–40 and 72 h for an ordinary concrete (Delsaute et al. 2016b)
Figure 4.24 presents the evolution of the creep compliance for several ages at loading of the same ordinary concrete. These results were compared to the value predicted by the Model Code 2010 (MC2010). For age at loading higher than 40 h, MC2010 is able to correctly predict the evolution of the basic compressive creep. However, for earlier ages, the amplitude of the creep can be underestimated by a factor 2.

4.4.1.4 Multiaxial Creep
Shrinkage strains are isotropic, and if they are restraint in 2 or 3 orthogonal directions, a biaxial or triaxial stress of state occurs. Even if there is no restriction in orthogonal directions, internal restrictions and the inherent internal balance of loads promoting tensions in all directions. It seems that there is no experimental data regarding the basic behavior of concrete in multiaxial tension. In most of the studies, multiaxial creep is dealt by using a creep or a relaxation Poisson’s ratio (e.g., Granger 1996; Bažant et al. 1997) or by splitting the creep strain into a spherical and deviatoric component (e.g., Benboudjema et al. 2005; Sellier et al. 2015). Due to time-dependent effects, the Poisson ratio needs to be well defined in an aging viscoelastic framework (Hilton and Yi 1998). Aili (2017) showed that using available experimental data, the use of creep or relaxation Poisson’s ratio leads to almost the same results. A literature review in compression shows some discrepancies (see Fig. 4.25).

Creep experiments on concrete: long-term asymptotic value of the viscoelastic Poisson’s ratio versus elastic Poisson’s ratio for each individual experiment; y-axis error bars indicate the maximum and minimum values of the viscoelastic Poisson’s ratio during the experiment (Aili 2017)
4.4.1.5 Influence of the Stress Level and Interaction Between Creep and Cracking
As the concrete compressive and tensile strengths increase rapidly at early age as the applied stress remains constant, the stress/strength ratio decreases with time. Most of the experiments are performed in such case. However, the research by Botassi et al. (2012) concluded for concrete at early ages that more consistent tests results are obtained by maintaining the stress/strength constant over time, increasing the load test similar to the increased resistance. According to Botassi et al. (2012), this way of performing the assay evaluates the creep phenomenon, disregarding interference stiffness growth in the cement matrix, and allows the analysis to evaluate the behavior of creep from their main causes, (and not by stiffness increase of the concrete).
It is quite admitted in compression that creep is proportional linearly to the applied stress until a certain stress level. This threshold varies between 0.2 and 0.75 of the concrete compressive strength in compression (e.g., Hannant 1967; McDonald 1975; Smadi and Slate 1989; Ranaivomanana et al. 2013; Rossi et al. 2013). Above this threshold, micro-cracking develops in concrete, creep rates increase as the stress/stress ratio increases, and failure may occur.
There are less analyses in tension than in compression about the effect of stress level. Tensile creep strain remains proportional to the applied stress up to a stress level between about 40 and 100% (Illston 1965; Domone 1974; Al-Kubaisy 1975; Neville et al. 1983; Bissonnette et al. 2007). As in compression, a sustained loading beyond this range of linearity may lead to failure. Note that some studies propose that creep induces micro-cracking (Rossi et al. 2012; Sellier et al. 2015) even for small level of stresses, leading eventually to internal drying shrinkage (Rossi et al. 2012). It is supported by acoustic emission (Rossi et al. 2012; Saliba et al. 2012; Al-Kubaisy 1975) and by observation in microscope (Shah and Chandra 1970).
Figure 4.26 displays the relationship between the applied stress \(\left( \sigma \right)\)/tensile or compressive strength \(\left( {\sigma f} \right)\) ratio with respect to the time until failure \(\varDelta tf\) for different authors in uniaxial tension or compression.

This result shows that the stress-to-strength ratio is proportional to the logarithm of time at failure. A similar result is observed also in bending (Carpinteri et al. 1997; Rossi et al. 2014). Micro-cracks during creep in tension may lead to their coalescence and result in a macro-crack and a corresponding failure. Note that the variability of properties is quite of great importance (coefficient of variation of 13% for 40 tested specimens coming from a construction site (Aït-Mokhtar et al. 2013)), since the tensile strength of the tested specimen is not known in advance: Reinhardt and Rinder (2006) observed in HPC for the same stress/strength ratio either a failure or not during tensile creep test at high stress level.
4.4.2 Drying Creep
Such as the drying shrinkage, this strain component is not detailed in this STAR.
4.4.3 Experimental Test Methods
The creep properties are very sensitive to the conditions of preservation of the specimen during the test and to many factors related to the test rig. For that reason, several recommendations were developed in the past (ASTM C512 2015; ISO 1920-9 2009; Subcommittee 4 1998) for hardened concrete. Currently, no recommendation or standard test method exists for the determination of the basic creep for concrete at very early age. The main common requirements for all the apparatus for testing basic creep in sealed condition are their ability to:
-
ensure uniform stress distribution over the cross-section of the specimen;
-
apply a load very quickly;
-
operate in a room with controlled temperature and humidity;
-
and maintain a constant known load during the whole testing period.
In addition, the measurement of the strain must be carried out in the central part of the specimen in order to eliminate the edge effects. As for the measurement of the free deformations, the specimen must be perfectly sealed to avoid any external drying or water uptake. The instrumentation must be composed of material with very low coefficient of thermal expansion.
For the separation of the autogenous strain and the basic creep strain, a dummy specimen that is load free must be made for each creep test. A same instrumentation must be used for the loaded and the dummy specimen.
If sample is tested few hours after setting, special attention should be taken for the preparation of the sample (Delsaute et al. 2016b).
References
Acker, P., & Ulm, F.-J. (2001). Creep and Shrinkage of concrete: Physical origins and practical measurements. Nuclear Engineering Design, 203, 143–158.
ACI Report 209, ACI Committee 209. (1992). ACI 209R-92: Prediction of creep, shrinkage, and temperature effects in concrete structures (Reapproved 1997).
Aili, A. (2017). Shrinkage and creep of cement-based materials under multiaxial load: Poromechanical modeling for application in nuclear industry. Ph.D. thesis, University Paris Est (279 pp.).
Aït-Mokhtar, A., et al. (20 authors). (2013). Experimental investigation of concrete variability. Cement and Concrete Research, 45, 21–36.
Al-Kubaisy, M. A. (1975). Failure of concrete under sustained tension. Magazine of Concrete Research, 27(92), 171–178.
Aly, T., & Sanjayan, J. G. (2008). Shrinkage cracking properties of slag concretes with on-day curing. Magazine of Concrete Research, 60, 41–48.
Arthanari, S., & Yu, C. W. (1967). An analysis of the creep and shrinkage effects upon prestressed concrete members under temperature gradient and its application. Magazine of Concrete Research, 19(60), 157–164.
ASTM Standard C512, Standard Test Method for Creep of Concrete in Compression.
ASTM Standard C1698, Standard Test Method for Autogenous Strain of Cement Paste and Mortar.
ASTM Standard C469, Standard Test Method for Static Modulus of Elasticity and Poisson’s Ratio of Concrete in Compression.
Atrushi, D. S. (2003). Tensile and compressive creep of early age concrete. Testing and modelling. Ph.D. thesis.
Azenha, M. (2009). Numerical simulation of the structural behavior of concrete since its early ages. Ph.D. thesis report, Faculty of Engineering of the University of Porto, 2009.
Azenha, M., Faria, R., & Ferreira, D. (2009). Identification of early-age concrete temperatures and strains: Monitoring and numerical simulation. Cement & Concrete Composites, 31, 369–378.
Baroghel-Bouny, V. (1994). Caractérisation des pâtes de ciment et des bétons, Méthodes, Analyse, Interprétation. Ph.D. thesis, Ecole Nationale des Ponts et Chaussées, France (467 pp.).
Baroghel-Bouny, V., & Kheirbek, A. (2000). Effect of mix-parameters on autogenous deformations of cement pastes—Microstructural interpretations. In V. Baroghel-Bouny & P. C. Aïtcin (Eds.), Shrinkage Concrete-Shrinkage 2000, Proceedings of the International RILEM Workshop, PRO17, October 16–17, Paris (pp. 115–141).
Baroghel-Bouny, V., Mounanga, P., Khelidj, A., Loukili, A., & Rafaï, N. (2006). Autogenous deformations of cement pastes: Part II. W/C effects, micro-macro correlations, and threshold values. Cement and Concrete Research, 36(1), 123–136.
Bassam, S. A., Yu, B-J., & Ansari, F. (2007). Fracture energy of concrete by maturity method. American Concrete Institute Materials Journal, Title no. 104-M10.
Bažant, Z. P. (1977). Viscoelasticity of solidifying porous material—concrete. Journal of the Engineering Mechanics Division, ASCE, 103, 1049-10067; Disc., 1979, 725–728.
Bažant, Z. P. (1984). Double-power logarithmic law for concrete creep. Cement and Concrete Research, 14, 793–806.
Bažant, Z. P., & Prasannan, S. (1989). Solidification theory for aging creep. I: Formulation. Journal of Engineering Mechanics, 115, 1670–1691.
Bažant, Z. P. (1995). Creep and shrinkage prediction model for analysis and design of concrete structures—Model B-3. Materials and Structures, 28, 357–365.
Bažant, Z. P., Hauggaaed, A. B., Baweja, S., & Ulm, F. J. (1997). Microprestress-solidification theory for concrete creep. I: Aging and drying effects. Journal of Engineering Mechanics, 123(11), 1188–1194.
Beltzung, F., & Wittman, F. (2002). Influence of cement composition on endogenous shrinkage, Self-dessiccation and its importance in concrete technology. In Proceedings of the Third International Research Seminar, June 14–15, Lund, Sweden (pp. 113–125).
Benboudjema, F., Meftah, F., & Torrenti, J.-M. (2005). Interaction between drying, shrinkage, creep and cracking phenomena in concrete. Engineering Structures, 27, 239–250.
Benboudjema, F., & Torrenti, J.-M. (2008). Early-age behaviour of concrete nuclear containments. Nuclear Engineering and Design, 238, 2495–2506.
Bentur, A., & Ish-Shalom, M. (1974). Properties of type K expensive cement of pure components. II. Proposed mechanism of ettringite formation and expansion in unrestrained paste of pure expansive component. Cement and Concrete Research, 4(5), 709–721.
Bernard, O., Ulm, F.-J., & Lemarchand, E. (2003). A multiscale micromechanics-hydration model for the early-age elastic properties of cement-based materials. Cement and Concrete Research, 33, 1293–1309. https://doi.org/10.1016/S0008-8846(03)00039-5.
Bissonnette, B., Pigeon, M., & Vaysburd, A. M. (2007). Tensile creep of concrete: Study of its sensitivity to basic parameters. Materials Journal, 104(4), 360–368.
Bjøntegaard, Ø., Hammer, T., & Sellevold, E. J. (2004). On the measurement of free deformation of early age cement paste and concrete. Cement & Concrete Composites, 26(5), 427–435.
Boivin, S. (1999). Retrait au jeune âge du béton: Développement d’une méthode expérimentale et contribution à l’analyse physique du retrait endogène. Ph.D. thesis, Ecole Nationale des Ponts et Chaussées, France, (249 pp.).
Botassi, S. S., Silva Filho, L. C., & Calmon, J. L. (2012). Early-age creep of mass concrete: Effects of chemical and mineral admixtures. ACI Materials Journal, V(5), 109.
Boulay, C., Crespini, M., Delsaute, B., & Staquet, S. (2012). Monitoring of the creep and the relaxation behaviour of concrete since setting time. Part 1: Compression. In SSCS 2012 Numerical Modelling Strategies for Sustainable Concrete Structures, May 29–June 1, Aix-en-Provence, France.
Boulay, C., Staquet, S., Delsaute, B., Carette, J., Crespini, M., Yazoghli-Marzouk, O., et al. (2014). How to monitor the modulus of elasticity of concrete, automatically since the earliest age? Materials and Structures, 47(1), 141–155.
Boumiz, A., Vernet, C., & Cohen Tenoudji, F. (1996). Mechanical properties of cement pastes at early ages. Advanced Cement Based Materials, 3.
Brazilian Standard NBR 6118, Projeto de estruturas de concreto - Procedimento. Rio de Janeiro (2014) (in Portuguese).
Briffaut, M., Benboudjema, F., Torrenti, J.-M., & Nahas, G. (2011). Numerical analysis of the thermal active restrained shrinkage ring test to study the early age behavior of massive concrete structures. Engineering Structures, 33(4), 1390–1401.
Briffaut, M., Benboudjema, F., Torrenti, J.-M., & Nahas, G. (2012). Concrete early age basic creep: Experiments and test of rheological modelling approaches. Construction and Building Materials, 36, 373–380.
Briffaut, M., Benboudjema, F., & D’Aloia, L. (2016). Effect of fibers on early age cracking of tunnel concrete lining. Part II: Numerical simulations, Tunnelling and Underground Space Technology, 59, 221–229.
Brooks, J. J., & Neville, A. M. A. (1977). comparison of creep, elasticity and strength of concrete in tension and in compression. Magazine of Concrete Research, 29(100), 131–141.
Browne, R., & Blundell, R. (1969). The influence of loading age and temperature on the long term creep behaviour of concrete in a sealed, moisture stable state. Materials and Structures, 2, 133–143.
Buffo-Lacarrière, L., Sellier, A., & Kolani, B. (2014). Application of thermo-hydro-chemo-mechanical model for early age behaviour of concrete to experimental massive reinforced structures with strain–restraining system. European Journal of Environmental and Civil Engineering, 18(7), 814–827.
Buffo-Lacarrière, L., El Bitouri, Y., & Sellier, A. (2016). Modelling of ageing behaviour of Supplementary Cementitious Materials. In Materials, Systems and Structures in Civil Engineering. MSSCE2016 Proceedings, August 2016, Lyngby, Denmark.
Byfors, J. (1980). Plain concrete at early ages. Stockholm: Swedish Cement and Concrete Research Institute.
Carette J. (2015) Towards early age characterisation of eco-concrete containing blast-furnact slag and limestone filler, PhD Thesis, Université Libre de Bruxelles, BATir department.
Carette, J., & Staquet, S. (2016). Monitoring and modelling the early age and hardening behaviour of eco-concrete through continuous non-destructive measurements: Part II. Mechanical behaviour, Cement and Concrete Composites, 73, 1–9.
Carette, J., Joseph, S., Cizer, Ö., & Staquet, S. (2017). Decoupling the autogenous swelling from the self-desiccation deformation in early age concrete with mineral additions: Micro-macro observations and unified modelling. Cement & Concrete Composites, 85, 122–132.
Carino, N. J. (1982). Maturity functions for concrete. In Proceedings of the RILEM International Conference on Concrete at Early Ages, Paris, France (pp. 111–115).
Carol, I., & Bažant, Z. P. (1993). Viscoelasticity with aging caused by solidification of nonaging constituent. Journal of Engineering Mechanics, ASCE, 119(11), 2252–2269.
Carpinteri, A., Valente, S., Zhou, F. P., Ferrara, G., & Melchiorri, G. (1997). Tensile and flexural creep rupture tests on partially damaged concrete specimens. Materials and Structures/Matériaux et Constructions, 30, 269–276.
Constantinides, G., & Ulm, F.-J. (2004). The effect of two types of C-S-H on the elasticity of cement based materials: Results from nanoindentation and micromechanical modeling. Cement and Concrete Research, 34.
Craeye, B., de Schutter, G., Humbeeck, H. V., & Cotthem, A. V. (2009). Early age behaviour of concrete supercontainers for radioactive waste disposal. Nuclear Engineering and Design, 239, 23–35.
Craeye, B., de Schutter, G., Desmet, B., Vantomme, J., Heirman, G., Vandewalle, L., et al. (2010). Effect of mineral filler type on autogenous shrinkage of self-compacting concrete. Cement and Concrete Research, 40(6), 908–913.
Darquennes, A. (2009). Comportement au jeune âge de bétons formulés à base de ciment au laitier de haut-fourneau en condition de déformations libre et restreinte. Thèse de doctorat, Université libre de Bruxelles.
Darquennes, A., Staquet, S., Delplancke-Ogletree, M.-P., & Espion, B. (2011). Effect of autogenous deformation on the cracking risk of slag cement concretes. Cement & Concrete Composites, 33, 368–379.
de Schutter, G., & Taerwe, L. (1996) Degree of hydration-based description of mechanical properties of early age concrete. Materials and Structures, 29.
de Schutter, G., & Vuylsteke, M. (2004). Minimisation of early age thermal cracking in a J-shaped non-reinforced massive concrete quay wall. Engineering Structures, 26, 801–808.
Delsaute, B., & Staquet, S. (2014). Early age creep and relaxation modelling of concrete under tension and compression. In L. Kefei, Y. Peiyu & Y. Rongwei (Eds.), CONMOD 2014: Proceedings of the RILEM International Symposium on Concrete Modelling (1 ed.) (Vol. 91, pp. 168–175). France: RILEM Publications S.A.R.L.
Delsaute, B., Torrenti, J.-M., & Staquet, S. (2016a). Monitoring and modeling of the early age properties of the vercors concrete. In Technological Innovations in Nuclear Civil Engineering TINCE, September 2016, Paris, France.
Delsaute, B., Boulay, C., & Staquet, S. (2016b). Creep testing of concrete since setting by means of permanent and cyclic loadings. Cement and Concrete Research, 73, 75–88.
Delsaute, B., Boulay, C., Granja, J., Carette, J., Azenha, M., Dumoulin, C., et al. (2016c). Testing concrete E-modulus at very early ages through several techniques: An inter-laboratory comparison. Strain, 52(2), 91–109.
Delsaute, B., Torrenti, J.-M., & Staquet, S. (2017). Modelling basic creep of concrete since setting time. Cement & Concrete Composites, 83, 239–250.
Delsaute, B., & Staquet, S. (2017). Decoupling thermal and autogenous strain of concretes with different water/cement ratios during the hardening process. Advances in Civil Engineering Materials, ASTM Journal, 6(2), 1–22.
Domone, P. L. (1974). Uniaxial tensile creep and failure of concrete. Magazine of Concrete Research, 26(88), 144–152.
EN 12390-13. Testing hardened concrete. Determination of secant modulus of elasticity in compression.
Esping, O. (2008). Effect of limestone filler BET(H2O)-area on the fresh and hardened properties of self-compacting concrete. Cement and Concrete Research, 38(7), 938–944.
Estrada, C. F., Godoy, L. A., & Prato, T. (2006). Thermo–mechanical behaviour of a thin concrete shell during its early age. Thin-Walled Structures, 44, 483–495.
Eurocode 2—Design of Concrete Structures. Part 1-1: General Rules and Rules for Buildings, European Committee for Standardization. EN 1992-1-1—ENV 1992-1-1: 2004.
Faria, R., Azenha, M., & Figueiras, J. A. (2006). Modelling of concrete at early ages: Application to an externally restrained slab. Cement & Concrete Composites, 28, 572–585.
fib Bulletin 70, CEB-FIP. State-of-the-art report: Code-type models for concrete behaviour. Background of MC2010. 2013.
Gawin, D., Wyrzykowski, M., & Pesavento, F. (2008). Modeling hygro-thermal performance and strains of cementitious building materials maturing in variable conditions. J. Build. Phys., 31, 301–318.
Gopalakrishnan, K. S. (1968). Creep of concrete under multiaxial compressive stresses. Ph.D. thesis, Civil Engineering, University of Calgary.
Granger, L. (1996). Comportement différé du béton dans les enceintes de centrales nucléaires: analyse et modélisation. Ph.D. thesis, Ecole Nationale des Ponts et Chaussées.
Gutsch, A., & Rostásy, F. S. (1994). Young concrete under high tensile stresses—Creep, relaxation and cracking. In Proceedings of the International RILEM Conference on Thermal Cracking in Concrete at Early Ages, London, UK (pp. 111–118).
Habib, A., Lachemi, M., & Aitcin, P.-C. (2002). Determination of elastic properties of high-performance concrete at early ages. ACI Materials Journal, 99(1), 37–41.
Hammer, T. A., Fossa, K. T., & Bjøntegaard, Ø. (2007). Cracking tendency of HSC: Tensile strength and self generated stress in the period of setting and early hardening. Materials and Structures, 40, 319–324.
Hannant, D. (1967). Strain behaviour of concrete up to 95 °C under compressive stresses (pp. 57–71.
Hilaire, A., Benboudjema, F., Darquennes, A., Berthaud, Y., & Nahas, G. (2014). Modeling basic creep in concrete at early-age under compressive and tensile loading. Nuclear Engineering Design, 269, 222–230.
Hilton, H. H., & Yi, S. (1998). The significance of (an) isotropic viscoelastic Poisson ratio stress and time dependencies. International Journal of Solids and Structures, 35, 3081–3095.
Holt, E. (2005). Contribution of mixture design to chemical and autogenous shrinkage of concrete at early ages. Cement and Concrete Research, 35, 464–472.
Honorio, T., Bary, B., & Benboudjema, F. (2016). Factors affecting the thermo-chemo-mechanical behaviour of massive concrete structures at early-age. Materials and Structures, 49(8), 3055–3073.
Hua, C., Acker, P., & Ehrlacher, A. (1995). Analyses and models of the autogenous shrinkage of hardening cement paste: I. Modelling at macroscopic scale. Cement and Concrete Research, 25, 1457–1468.
Igarashi, S., & Kawamura, M. (2002). Effects of microstructure on restrained autogenous shrinkage behavior in high strength concretes at early ages. Materials and Structures, 35(2), 80–84.
Illston, J. (1965). The creep of concrete under uniaxial tension. Magazine of Concrete Research, 17(51), 77–84.
Illston, J. M., & Sanders, P. D. (1973). The effect of temperature change upon the creep of mortar under torsional loading. Magazine of Concrete Research, 25(84), 136–144.
Irfan-ul-Hassan, M., Pichler, B., Reihsner, R., & Hellmich, Ch. (2016). Elastic and creep properties of young cement paste, as determined from hourly repeated minute-long quasi-static tests. Cement and Concrete Research, 82, 36–49.
ISO 1920-9. Testing of concrete—Part 9: Determination of creep of concrete cylinders in compression.
Jensen, O. (2000). Influence of cement composition on autogenous deformation and change of relative humidity. In V. Baroghel-Bouny & P. C. Aïtcin (Eds.), Shrinkage 2000, Proceedings of the International RILEM Workshop, PRO 17, October 16–17, Paris, France (pp. 143–153).
Jensen, O. M., & Hansen, P. F. (2001). Autogenous deformation and RH-change in perspective. Cement and Concrete Research, 31, 1859–1865.
Jonasson, J.-E. (1994). Modelling of temperature, moisture and stress in young concrete. Ph.D. thesis, Luleå University of Technology, Luleå, Sweden.
Jordaan, I. J., & Illston, J. M. (1969). The creep of sealed concrete under multiaxial compressive stresses. Magazine of Concrete Research, 21(69), 195–204.
JSCE 2010, JSCE. Guidelines for Concrete. No. 15: Standard Specifications for Concrete Structures. Design (2011).
Justnes, H., Sellevold, E. J., Reyniers, B., Van Loo, D., Van Gemert, A., Verboven, F., et al. (1998). The influence of cement characteristics on chemical shrinkage, autogenous shrinkage of concrete. In Proceedings of the International Workshop, June 13–14, Hiroshima, Japan, Edité par Tazawa, E. (pp. 71–80).
Kanstad, T., Hammer, T. A., Bjøntegaard, Ø., & Sellevold, E. J. (2003a). Mechanical properties of young concrete. Part I: Experimental results related to test methods and temperature effects. Materials and Structures, 36, 218–225.
Kanstad, T., Hammer, T. A., Bjøntegaard, Ø., & Sellevold, E. J. (2003b). Mechanical properties of young concrete. Part II: Determination of model parameters and test program proposals. Materials and Structures, 36, 226–230.
Karte, P., Hlobil, M., Reihnsner, R., Dörner, W., Lahayne, O., Eberhardsteiner, J., et al. (2015). Unloading-based stiffness characterization of cement pastes during the second, third and fourth day after production. Strain, 51(2), 156–169.
Kee, C. F. (1971). Relation between strength and maturity of concrete. ACI Journal Proceedings, 68(3), 196–203.
Kennedy, T. W. (1975). An evolution and summary of a study of the long-term multiaxial creep behavior of concrete. Oak Ridge National Laboratory: Technical report.
Kim, J. K., Kwon, S. H., Kim, S. Y., & Kim, Y. Y. (2005). Experimental studies on creep of sealed concrete under multiaxial stresses. Magazine of Concrete Research, 57(10), 623–634.
Kim, J.-K., Lee, Y., & Yi, S.-T. (2004). Fracture characteristics of concrete at early ages. Cement and Concrete Research, 34, 507–519.
Klemczak, B., & Batog, M. (2014). Przewidywanie wczesnych wytrzymałości betonów na cementach wieloskładnikowych według Eurokodu 2. Inżynieria i Budownictwo, 71(3), 142–145.
Klemczak, B., & Knoppik-Wróbel, A. (2014). Analysis of early-age thermal and shrinkage stresses in reinforced concrete walls. ACI Structural Journal, 111(2), 313–322.
Klemczak, B., Batog, M., & Pilch, M. (2016). Assessment of concrete strength development models with regard to concretes with low clinker cements. Archives of Civil and Mechanical Engineering, 16(2), 235–247.
Kolani, B., Lacarrière, L., Sellier, A., Boutillon, L., & Linger, L. (2011). Crack initiation and propagation at early age. In fib 2011 Symposium, Prague (Czech Republic).
Krauss, M., & Hariri, K. (2006). Determination of initial degree of hydration for improvement of early-age properties of concrete using ultrasonic wave propagation. Cement and Concrete Composites, 28, 299–306.
Laplante, P. (1993). Propriétés mécaniques des bétons durcissants: analyse comparée des bétons classiques et à très hautes performances. Thèse de Doctorat de l’Ecole Nationale des Ponts et Chaussées, également en Etudes et Recherches des LPC, OA13.
Larson, M. (2003). Thermal crack estimation in early age concrete. Models and methods for practical application. Ph.D. thesis, Luleå University of Technology, Luleå, Sweden.
Li, H., Wee, T., & Wong, S. (2002). Early-age creep and shrinkage of blended cement concrete. Materials Journal, 99(1), 3–10.
Lohtia, R. P. (1970). Mechanism of creep in concrete. Roorkee University Research Journal, 1–2(12), 37–47.
Lopes, A. N. M., Fonseca Silva, E., Dal Molin, D. C. C., & Toledo Filho, R. D. (2013). Shrinkage-reducing-admixture: effect on durability of high-strength concrete. ACI Materials Journal, 110(4), 365–374.
Loser, R., Münch, B., & Lura, P. (2010). A volumetric technique for measuring the coefficient of thermal expansion of hardening cement paste and mortar. Cement and Concrete Research, 40(7), 1138–1147.
Lura, P., Jensen, O. M., & van Breugel, K. (2003). Autogenous shrinkage in high-performance cement paste: An evaluation of basic mechanisms. Cement and Concrete Research, 33, 223–232.
Masoero, E., Del Gado, E., Pellenq, R. J. M., Ulm, F. J., & Yip, S. (2012). Nanostructure and nanomechanics of cement: Polydisperse colloidal packing. Physical Review Letters, 109(15), 155503.
Masse, M. B. (2010). Étude du comportement déformationnel des bétons de réparation. Mémoire de D.E.A., École polytechnique de Montréal.
Mcdonald, J. (1975). Time-dependent deformation of concrete under multiaxial stress conditions. Final report. Technical report.
Mehta, P. (1973). Mechanism of expansion associated with ettringite formation. Cement and Concrete Research, 3(1), 1–6.
Model Code 1990, CEB-FIP fib. Model Code 1990, 1991.
Model Code 2010, CEB-FIP fib. Model Code 2010, 2013.
Mounanga, P., Baroghel-Bouny, V., Loukili, A., & Khelidj, A. (2006). Autogenous deformations of cement pastes: Part I. Temperature effects at early age and micro–macro correlations. Cement and Concrete Research, 36, 110–122.
Neville, A. M., Dilger, W. H., & Brooks, J. J. (1983). Creep of plain and structural concrete. Longman Group Ltd: Construction Press.
Neville, A. M. (2000). Propriétés du béton. Paris: Eyrolles.
Parak, K. B., Nogucht, T., & Tomosawa, F. (1998). A study on the hydration ration and autogenous shrinkage of cement paste, Autogenous shrinkage of concrete. In E. Tazawa (Ed.), Proceedings of the International Workshop, June 13–14, Hiroshima, Japan (pp. 281–290).
Persson, B. (2000). Consequence of cement constituents, mix composition and curing conditions for self-desiccation in concrete. Materials and Structures, 33, 352–362.
Ranaivomanana, N., Multon, S., & Turatsinze, A. (2013). Basic creep of concrete under compression, tension and bending. Construction and Building Materials, 38, 173–180.
Reinhardt, H., Blaauwendraad, J., & Jongedijk, J. (1982). Temperature development in concrete structures taking account of state dependent properties. In Proceedings of RILEM International Conference on Concrete at Early Ages, Paris, France (pp. 211–218).
Reinhardt, H.-W., & Rinder, T. (2006). Tensile creep of high-strength concrete. Journal of Advanced Concrete Technology, 4(2), 277–283.
Reviron, N. (2009). Etude du fluage des bétons en traction. Application aux enceintes de confinement des centrales nucléaires à eau sous pression. Ph.D. thesis, ENS de Cachan.
Rifai, F., Darquennes, A., Benboudjema, F., Muzeau, B., & Stefan, L. (2016). Study of shrinkage restraint effects at early-age in alkali activated slag mortars. In FraMCoS-9, Berkeley, USA, May 29–June 1, 2016.
Rossi, P., Wu, X., Le Maou, F., & Belloc, (1994). A. Scale effect on concrete in tension. Materials and Structures, 27, 437–444.
Rossi, J.-L., Tailhan, F. Le, Maou, L., & Gaillet, E. Martin. (2012). Basic creep behavior of concretes investigation of the physical mechanisms by using acoustic emission. Cement and Concrete Research, 42(1), 61–73.
Rossi, P., Tailhan, J., & Le Maou, F. (2013). Creep strain versus residual strain of a concrete loaded under various levels of compressive stress. Cement and Concrete Research, 51, 32–37.
Rossi, P., Charron, J., Bastien-Masse, M., Tailhan, J.-L., Le Maou, F., & Ramanich, S. (2014). Tensile basic creep versus compressive basic creep at early ages: comparison between normal strength concrete and a very high strength fibre reinforced concrete. Materials and Structures, 47(10), 1773–1785.
Roziere, E., Cortas, R., & Loukili, A. (2015). Tensile behaviour of early age concrete: New methods of investigation. Cement & Concrete Composites, 55, 153–161.
Ruetz, W. (1968). An hypothesis for the creep of the hardened cement paste and the influence of simultaneous shrinkage. In Proceedings of the Structure of Concrete and its Behaviour Under Load, Londres (pp. 365–387).
Saliba, J., Loukili, A., Grondin, F., & Regoin, J.-P. (2012). Experimental study of creep-damage coupling in concrete by acoustic emission technique. Materials and Structures, 45(9), 1389–1401.
Sanahuja, J., Dormieux, L., & Chanvillard, G. (2007). Modelling elasticity of a hydrating cement paste. Cement and Concrete Research, 37.
Schindler, A. K. (2004). Effect of temperature on hydration of cementitious materials. ACI Materials Journal, 101(1), 72–81.
Sellier, A., Multon, S., Buffo-Lacarrière, L., Vidal, T., Bourbon, X., & Camps, G. (2015). Concrete creep modelling for structural applications: Non-linearity, multi-axiality, hydration, temperature and drying effects. Cement and Concrete Research.
Shah, S. P., & Chandra, S. (1970). Fracture of concrete subjected to cyclic and sustained loading. ACI Journal Proceedings, 67.
Smadi, M., & Slate, F. O. (1989). Microcracking of high and normal strength concretes under short- and long-term loadings. ACI Materials Journal, 86, 117–127.
Sofi, M., Mendis, P. A., & Baweja, D. (2012). Estimation of early-age in situ strength development of concrete slabs. Construction and Building Materials, 29, 659–666.
Staquet, S., Delsaute, B., Darquennes, A., & Espion, B. (2012). Design of a revisited TSTM system for testing concrete since setting time under free and restrained conditions. In F. Toutlemonde & J.-M. Torrenti (Eds.), Crack control of mass concrete and related issues concerning early-age of concrete structures (PRO, 85), March 15–16, 2012, Paris, France (pp. 99–110). Paris: RILEM Publications.
Stefan, L., Benboudjema, F., Torrenti, J. M., & Bissonnette, B. (2010). Prediction of elastic properties of cement pastes at early ages. Computational Materials Science, 47(3), 775–784.
Subcommittee 4: Standardized test methods for creep and shrinkage. Materials and Structures, 31, 507 (1998).
Tamtsia, B. T., Beaudoin, J. J., & Marchand, J. (2004). The early age short-term creep of hardening cement paste: Load-induced hydration effects. Cement and Concrete Research, 26, 481–489. https://doi.org/10.1016/S0958-9465(03)00079-9.
Taylor, H. F. W. (1990). Cement chemistry. London: Academic Press Limited.
Toma, G. (1999). Comportement des bétons au jeune âge. Ph.D. thesis, Université de Laval, Canada (264 pp.).
Ulm, F. J., & Coussy, O. (1998). Couplings in early-age concrete: From material modeling to structural design. International Journal of Solids and Structures, 35(31–32), 4295–4311.
Van Breugel, K. (1991). Simulation of hydration and formation of structure in hardening cement-based materials, Ph.D. thesis, Delft Technical University, The Netherlands (305 pp.).
van Vliet, M. R., & van Mier, J. G. (2000). Experimental investigation of size effect in concrete and sandstone under uniaxial tension. Engineering Fracture Mechanics, 65(2), 165–188.
Vandamme, M., & Ulm, F.-J. (2009). Nanogranular origin of concrete creep. Proceedings of the National Academy of Sciences of the United States of America, 106, 10552–10557. https://doi.org/10.1073/pnas.0901033106.
Vandamme, M. (2004). A few analogies between the creep of cement and of other materials. Concreep, 10(2015), 78–83.
Waller, V., d’Aloïa, L., Cussigh, F., & Lecrux, S. (2004). Using the maturity method in concrete cracking control at early ages. Cement & Concrete Composites, 26, 589–599.
Wittmann, F. H. (1982). Creep and shrinkage mechanisms. In Z. P. Bažant & F. H. Wittmann (Eds.), Creep and shrinkage in concrete structures (pp. 129–161). Chichester: Wiley.
Wittmann, F. H. (2015). Useful fundamentals of shrinkage and creep of concrete. Concreep, 10(2015), 84–93.
Xiang, Y., Zhang, Z., He, S., & Dong, G. (2005). Thermal–mechanical analysis of a newly cast concrete wall of a subway structure. Tunnelling and Underground Space Technology, 20, 442–451.
Yssorche-Cubaynes, M.-P., & Olivier, J.-P. (1999). Self-desiccation microcracking and HPC and VHPC durability, Materials and Structures/Matériaux et Constructions, 32, 14–21.
Yuan, Y., & Wan, Z. L. (2002). Prediction of cracking within early-age concrete due to thermal, drying and creep behavior. Cement and Concrete Research, 32, 1053–1059.
Zhaoxia, L. (1994). Effective creep Poisson’s ratio for damaged concrete. International Journal of Fracture, 66(2), 189–196.
Author information
Authors and Affiliations
Corresponding author
Editor information
Editors and Affiliations
Rights and permissions
Copyright information
© 2019 RILEM
About this chapter

Cite this chapter
Benboudjema, F. et al. (2019). Mechanical Properties. In: Fairbairn, E., Azenha, M. (eds) Thermal Cracking of Massive Concrete Structures. RILEM State-of-the-Art Reports, vol 27. Springer, Cham. https://doi.org/10.1007/978-3-319-76617-1_4
Download citation
DOI: https://doi.org/10.1007/978-3-319-76617-1_4
Published:
Publisher Name: Springer, Cham
Print ISBN: 978-3-319-76616-4
Online ISBN: 978-3-319-76617-1
eBook Packages: EngineeringEngineering (R0)