
Abstract
Visualization plays an important role in mathematics learning, but in the United States where many prospective teachers (PTs) have few if any experiences learning mathematics through visualization, mathematics teacher educators are challenged to design tasks that generate within PTs’ thinking an appreciation for the role visualization plays in mathematics learning. This chapter examines the affordances of progressive visualization tasks and semiotic chaining for use in mathematics teacher preparation. To the literature on dyadic and nested forms of semiotic chaining, data analysis in this chapter contributes a new type of semiotic chaining based on Peirce’s three principles of diagrammatic reasoning.
Access provided by CONRICYT-eBooks. Download chapter PDF
Keywords
1 Why Visualization? … as a Semiotic System? … for Preservice Mathematics Teachers?
While recognition of visualization and its importance for learning is beginning to capture the attention of mathematics teachers in the United States, in part due to the conceptual demands of the national mathematics standards initiative (National Governors Association 2010), researchers in mathematics education have long recognized the role visualization plays in mathematics learning. Presmeg’s chapter on visualization in the Psychology of Mathematics Education Handbook (2006a) traces the evolution of visualization research beginning with its roots in spatial and mathematical abilities research (Bishop 1980; Krutetskii 1976) during the period from 1976 to 2006. These studies have generated broad consensus on a definition of visualization. Since 2003 Arcavi’s conceptualization of visualization as “both the product and the process of creation, interpretation, and reflection upon pictures and images” (p. 215) has been the prevailing definition in the field. More recently, the ZDM journal further advanced the field of visualization research by publishing a special issue on “visualization as an epistemological learning tool” (Rivera et al. 2013; Presmeg 2013). Examining the role of visual tools in mathematics learning, the ZDM papers range from studies of young students using the number line as a visual tool to older students comparing graphic representations of a function and its derivative. Despite researchers’ attention to the role of visualization within school mathematics, relatively little work has been done on visualization in mathematics teacher preparation. With one exception, none of the visualization papers discussed above focus on teacher education.
This chapter aims to close this gap in the literature by taking up the question of visualization within mathematics teacher preparation. Specifically, the chapter examines the problem of preparing pre-service teachers (PTs) to teach mathematical concepts, processes, and relationships through progressive visualization with visual tools. To do this, for reasons that are described below, the chapter first defines visualization as a semiotic system. The chapter then employs Peirce’s theory of signs and Krutetskii’s system of problem types for developing mathematical reasoning to examine the chains of significance in a progressive visualization task from an innovative digital K–8 mathematics curriculum designed to teach mathematics concepts visually without words. To the literature on dyadic and nested forms of semiotic chaining (Presmeg 2006b), this analysis contributes a new type of semiotic chaining based on Peirce’s principles of diagrammatic reasoning. Semiotic chaining of diagrams is proposed as a visualization-pedagogy for preparing PTs to foster deep understanding of mathematical notions through design of progressive visualization tasks that (1) make connections between visual and symbolic representations of the same mathematical notions and (2) promote mathematical generalization and abstraction. Semiotic perspectives on mathematics learning as a sign-interpreting game and on mathematics teaching as the art of chaining representations to foster generalization of mathematical concepts recommend the study of signs and their interpretation as a central component of mathematics teacher preparation (cf., Sáenz-Ludlow, this volume).
2 The Problem of Preparing Preservice Mathematics Teachers to Teach Through Visualization
From my practice as a mathematics teacher educator (MTE) in the mathematics methods course, I know that many PTs come to their study of mathematics learning and teaching with few if any experiences learning mathematics through visualization and visual tools (Kinach 2002). It is important, therefore, for MTEs to determine what types of tasks generate within PTs’ thinking an appreciation for the role visualization plays in mathematics learning. A deep understanding of how students learn mathematics can generate such appreciation. For this, representational theories of mathematics learning are useful. In the methods course, PTs learn from these theories that the human mind learns abstract mathematical ideas not by reflection on mathematical symbols but by generalizing the abstract idea from multiple concrete representations of it (Dienes 1973). PTs also learn that it is advisable to sequence representations from concrete to pictorial to abstract, or as Bruner (1961) proposed—from enactive to iconic to symbolic—to facilitate students’ ability to infer an abstract mathematical idea from a series of representations. Representational theories perturb conceptions of mathematics learning as memorizing rules and direct-instruction conceptions of mathematics teaching, by featuring the interplay between visual representations and inferential reasoning in the formation of mathematical notions.
Appreciation for the role of visualization in mathematics learning further develops as PTs internalize the necessity of implementing the mathematics standards in their future teaching. The Representation Standard from the Principles and Standards for School Mathematics (National Council of Teachers of Mathematics 2000) recommends that students use and connect representations to communicate abstract mathematical ideas and translate across representations to solve problems. The Lesh translation model (Cramer 2003) is a cognitive tool for guiding the design of learning sequences that build representational fluency across five modes of representation: manipulatives, pictures, written numerical and algebraic symbols, verbal symbols, real world contexts (Fig. 13.1). Sequencing representations logically and visually to facilitate generalization of mathematical ideas is an art that is challenging for PTs to learn and MTEs to teach.

Lesh translation model
As researchers increasingly suggest (Presmeg 2006b), thinking of mathematics semiotically as the study of signs is likely to generate new insight into how students make sense of mathematics and how teachers ought to sequence the signs of mathematics for optimal and meaningful learning. It is for this reason that in this chapter I choose to investigate visualization as a semiotic system by focusing specifically on semiotic chaining and its affordances for developing an appreciation for the role of visualization in mathematics learning and the ability to design progressive visualization tasks that foster mathematical abstraction and generalization.
3 Theoretical Framework
3.1 Peircean Theory of Signs
Semiotics is the study of signs and how they signify meaning. A semiotic system, according to Peirce’s triadic theory of signs, consists of three parts: object, sign, and interpretant. The object is the thing represented; as conceptualized for this chapter the object is the abstract mathematical idea intended for the student to learn. PTs learning to use visualization and semiotic principles to foster mathematics learning might think of the object as the learning goal—the abstract mathematical notion to be signified through any of the five modes of representation in the Lesh translation model previously described. The sign in Peirce’s triadic model is the representation of the object; the sign is the signifier, the vehicle through which the learner comes to comprehend the object. The sign is also known as the representamen in Peirce’s theory. The interpretant is the idea about the object that the sign triggers in the mind of the interpreter (who in this chapter is the pre-service mathematics teacher or K–12 learner). The interpretant itself can be considered a sign for it represents the learner’s understanding of the sign/object relation at a particular moment in the learning process. Once formed, the initial interpretant shapes a learner’s understanding of the object providing a cognitive foundation for subsequent re-interpretation of the sign and formation of an evolved interpretant. This elaboration of Peirce’s theory of signs is based on his definition of sign as “a thing which serves to convey knowledge of some other thing, which it is said to stand for or represent. This thing is called the object of the sign; the idea in the mind that the sign excites, which is a mental sign of the same object, is called an interpretant of the sign” (Peirce 1998, p. 13).
The above description of Peirce’s theory of signs is, I believe, an accessible rendering for pre-service teachers. Mathematics teacher educators can employ it, along with his definition of sign, in the methods course to introduce pre-service teachers to (1) the role of visualization and representations in mathematics learning and (2) the practice of scaffolding visual representations to develop students’ understanding of a mathematical concept, procedure, or relation. Peirce’s definition of sign aligns with the previously discussed representational theories of mathematics learning that PTs study in the methods course. Moreover, his concept of interpretant is useful for directing teacher candidates’ attention to the sense that students make of the representations, problems, and other curriculum materials teachers use to develop understanding of mathematical notions. Students’ interpretations of learning materials are not always those intended by the teacher (Sáenz-Ludlow, this volume), implying a need for scaffolding learning experiences to allow for re-interpretation until the desired learning objective approximates the intended learning goal. This idea of learning as an interpreting game requiring informative feedback and learner reinterpreting toward the intended learning goal (Sáenz-Ludlow) is, in my experience as a MTE, an effective counter to beliefs about mastery learning gleaned from direct-instruction teaching practices.
Peirce’s theory of signs is, in fact, much more complex than the elaboration above suggested for PTs. Indeed it is necessary for the semiotic analysis of the progressive visualization task examined in this chapter to delve more deeply into Peirce’s triadic theory and to define how I will use his terms. One complexity is his use of the term sign. In the above definition, he conceptualizes sign as a signifier, specifically the thing signifying the object. In other instances (e.g., Peirce 1992), he uses the term sign to refer to the entire triad (object, sign, interpretant) in which case sign is being used in what may be thought of as both a macro-sense (SIGN) and micro-sense (sign). To avoid confusion, Peirce scholars tend to substitute the term sign vehicle for sign when discussing sign in the sense of signifier or representamen of the object. In this chapter I use the lower-case spelling of the term sign to refer to the sign in its micro sense as signifier of the object and use the upper-case spelling of the term SIGN to indicate the entire triad of object-sign(representamen)-interpretant. I employ the terms sign, representamen, sign vehicle, and representation interchangeably in this chapter for pedagogical reasons, in order to investigate whether my semiotic analysis of the visualization task is compatible with the Lesh translation model used in the methods course to motivate teaching mathematics through representations.
3.1.1 Sign as Icon, Index, or Symbol
Analysis of visualization tasks in this chapter also requires note of Peirce’s three-part categorization of signs as icon, index, or symbol. Icons refer to their objects by similarity in features, or as Peirce described, icons are “likenesses … which serve to convey ideas of the things they represent simply by imitating them” (Peirce 1998, p. 5). Indices, which Peirce also called indications (p. 5), show something about the object or thing they represent in the sense that, for example, smoke indicates fire or a highway milepost indicates miles traveled from the origin. Symbols, having no likeness or natural connection to the object they represent, refer to the thing by virtue of consensus and use within a community. Words, algebraic characters, and mathematical symbols such as + or = are examples of symbols. The meanings of symbols exist by virtue of their common usage within a community of discourse.
3.1.2 Diagrams and Diagrammatic Reasoning
Icons are further categorized by Peirce into images, diagrams, and metaphors. A diagram as a category of icon is especially relevant for the analysis of visualization tasks in this chapter as these tasks consist almost entirely of iconic diagrams. According to Peirce, the diagram is a particularly useful kind of icon because it “suppresses a quantity of details, and so allows the mind more easily to think of the important features.” For Peirce, this was the “great distinguishing property of this [type of] icon … that by direct observation of it other truths concerning its object can be discovered than those which suffice to determine its construction” (Peirce as quoted in Stjernfelt 2007, p. 358).
For Peirce all mathematical reasoning is diagrammatic. His conceptualization of diagrammatic reasoning will be instructive for the task analysis conducted later in the chapter:
That is, we construct an icon of our hypothetical state of things and proceed to observe it. This observation leads us to suspect that something is true, which we may or may not be able to formulate with precision, and we proceed to inquire whether it is true or not. For this purpose it is necessary to form a plan of investigation and this is the most difficult part of the whole operation. We not only have to select the features of the diagram which it will be pertinent to pay attention to, but it is also of great importance to return again and again to certain features. Otherwise, although our conclusions may be correct they will not be the particular conclusions at which we are aiming. But the greatest point of art consists in the introduction of suitable abstractions. By this I mean such a transformation of our diagrams that characters of one diagram may appear in another as things. A familiar example is where in analysis we treat operations as themselves the subject of operations. (Peirce 1998, pp. 212–213)
Given this conceptualization of diagrammatic reasoning, Peirce (pp. 212–213) identifies three steps for designing such reasoning. I will argue that these steps are the design principles underlying the visualization task analyzed in this chapter:
-
1.
“copulating separate propositions into one compound proposition”,
-
2.
“omitting something from a proposition without possibility of introducing error”,
-
3.
“inserting something into a proposition without introducing error”.
3.1.3 The Triadic Nature of Interpretant and Object
Just as Peirce categorizes the icon into three types, so he conceives both the interpretant and object as triadic notions. The triadic nature of each component within Peirce’s theory of signs is grounded in his conceptualization of the nature of reality: firstness, secondness, and thirdness. Firstness refers to the initial unreflected state of things. It is, for example, the first impression learners have when reading a mathematics problem—the immediate interpretant. Secondness refers to reflections on the object subsequent to the initial interpretant/impression. Secondness is an intermediate state between firstness and thirdness. During the problem solving process, secondness is the dynamic state of a learner’s understanding as it continuously refines as learners delve deeper into the relationships within a problem setting. Secondness gives rise to what Peirce called the dynamic interpretant. Thirdness is the final interpretant, the notion that the sender intended to communicate. In learning situations, thirdness is the desired learning goal; it is the taken-as-shared understanding of the object. The above gives rise to three states of being and experience (ontology and phenomenology) of the interpretant and the object: immediate, dynamic, and real. Figure 13.2 (Sáenz-Ludlow and Kadunz 2016) summarizes the relations among object, sign, and interpretant emphasizing how the sign mediates between the object and the interpretant.

Saenz-Ludlow and Kadunz (2016): Peircean triadic sign model
3.2 Semiotic Chaining
Semiotics is the study of signs and how they signify meaning. Semiotic chaining, as used in this chapter, is a process of sign-making involving the artful sequencing of signs to evolve understanding of an intended learning goal by the designer of the semiotic chain. Understanding of the intended object develops continually through a range of experiments on linked representations that manifest the intended qualities of the object. In mathematics lessons, it is recommended by Bruner and other representational learning theorists that the designer of the semiotic chain sequence representations from enactive to iconic to symbolic. Chaining therefore is based on the assumption that meaning and understanding develop over time, and are not limited to any one point in time.
Presmeg (2006b) cites two examples of the use of semiotic chains in mathematics teacher education research. Both are rooted in real world contexts. Adeyemi’s (2004) use of chains with pre-service elementary teachers centers on linking K–12 students’ activities with the mathematics curriculum while Hall’s (2000) use of chains with in-service teachers involves use of an everyday activity to motivate a mathematics concept. Specifically, Hall’s teachers evolved the concept of a batting average through the following semiotic chain:
Baseball game → hits versus at bats → success fraction → batting average (Presmeg 2006b, p. 168). Both semiotic chains are characterized as Peircean nested semiotic chains, in contrast to Saussurean dyadic chains. The sequence of signifiers (representamen) is such that each sign (representamen) ‘slides under’ the subsequent signifier, in the sense that each triad is contained in the next, after the manner of Russian nested dolls (Presmeg 2006b, p. 165). In this formulation, the new signifier in the chain stands for everything that precedes it in the chain. The previous signifier, as well as everything that it represents, is now the new signified. (p. 169)
In contrast, the semiotic chains examined in this chapter employ interactive diagrams and Peirce’s three principles of diagrammatic reasoning to foster generalization of a mathematics concept.
3.3 Krutetskii’s Problem Types and Mathematical Abilities
Krutetskii’s categorization of problem types and mathematical abilities also informs my analysis of visualization tasks for this chapter. Of the 26 problem series Krutetskii created to investigate, assess, and ultimately develop students’ mathematical abilities, three are relevant for my purposes in this chapter: Series V, Series VII, and Series XVII (Table 13.2). Series V—systems of problems of a single type (p. 100)—was intended to develop a type of generalization that Krutetskii called “subsumption under a concept.” This series introduces a new concept and provides students the opportunity to generalize the new concept from particular instances of it. The extent of students’ ability to generalize is judged by three abilities: (1) how well a student can “see a general type in different problems,” (2) how the student passes from “solving simpler problems to solving more complex ones of the same type,” and (3) how the student can “differentiate problems of one type from externally similar problems of another type” (Krutetskii 1976, p. 115). Within Series V, it is possible to abstract, or generalize, specific features despite external differences among the problems because certain “associations” (to use Krutetskii’s term) or commonalities exist across the system of problems. For Krutetskii, these associations are of two types. First, there are characteristics of the given geometric figure and its elements; and second, there is the recognition that solving the problem requires an operation or action (Krutetskii 1976, p. 52).
Series VII—systems of problems with graded transformations from concrete to abstract—was intended to develop perception, specifically the forming of a generalization. As described by Krutetskii,
this series of problems shows how easily and quickly a pupil can translate the solution of a problem into a general scheme, how capable he is of transferring from operations with concrete quantities to operations with conventional symbols that enable him to express relations between quantities in a general, abstract form. (p. 125)
The structure and rationale for this problem series is instructive for analyzing how the visualization task analyzed in this chapter transitions from concrete to abstract variants through intermediate forms. Specifically, Krutetskii describes this series to be
A system of ten problems, each of which is gradually transformed from a concrete to an abstract, general scheme. Each problem has from three to five variants. The first problem (a) is a problem on a completely clear concrete plan; the last (e) is the same problem translated onto an abstract, general level. Variants b, c, and d are intermediate representing gradual translations from a to e, with successive generalizations of increasingly greater number of elements of the problem. (p. 123)
Series XVII—direct and reverse problems—was intended to investigate the ability to “restructure the direction of a mental process, to change from a direct to a reverse train of thought” (Krutetskii 1976, p. 143). Acknowledging that not all relations are symmetric, Krutetskii separated the question into psychological and mathematical components. Primary was the question of reversibility. Was the pupil able, for example, to reverse the logical direction of a problem that asks for the area measurement of a rectangle given its dimensions to one that asks for the possible dimensions of a rectangle given its area measurement. Even with non-symmetric relations such as cats are a subset of mammals, the intention was to test ability to reverse the train of thought to mammals are a subset of cats. Mathematical accuracy, for Series XVII reversibility problems, was a secondary concern.
Table 13.1 summarizes the three Krutetskii problem series pertinent to the analysis of progressive visualization tasks in this chapter. Each series was designed to investigate certain mathematical abilities, which for the featured series are: (1) isolate form from content, (2) abstract from concrete (and I would add digital) spatial forms, (3) reverse a mental process, and (4) generalize mathematical material to see what is common in what is externally different (Krutetskii 1976). All but reversibility of thought (#3) relate to the ability to generalize mathematical objects, relations, and operations.
3.4 Visualization Task Context: The Mathematics Methods Course
In this section, I consider a digital visualization task that I have used with pre-service elementary teachers in the mathematics methods course. The task is based on the 5th grade Area of Rectangle game in the Spatial Temporal Mathematics (ST Math) curriculum. ST Math is a neuroscience-based supplementary mathematics curriculum for grades K through 8 that is available to schools through the MIND Research Institute (MRI 2014), a former research affiliate of the University of California at Irvine. This supplementary mathematics program, which develops mathematics concepts visually without words through interactive, animated digital game-like mathematics puzzles, mobilizes visual examples, animations, and informative feedback to facilitate evolution of students’ understanding of a mathematics concept.
I think of these games as progressive concept visualizations. Since 2013, through a partnership with MRI, I have been conducting design research in the methods courses that I teach for elementary PTs to determine a role for this innovative technology in the preparation of mathematics teachers. Among other things, I have employed select games to assess PTs’ mathematics content knowledge, develop their ability to write learning objectives, and model Bruner’s representational theory of mathematics learning and instructional sequencing (concrete-pictorial-abstract).
Viewed from a semiotic perspective, the games are concerned with the construction of concept(s) through signs (Kadunz 2016). The signs employed within the games are collections of Peirce icons, symbols, and indices. Each game includes interactive iconic diagrams. Experimentation with the diagrams produces informative visual feedback providing further opportunity to reason with the diagram—to notice patterns, form inductive hypotheses, and conduct deductive experiments on the icon diagram—for the purpose of discovering the game’s hidden mathematical learning goal (object). Reasoning elicited by the visual puzzles spans the reasoning types Peirce examines, from deduction to induction, hypothesis, and abduction.
Structurally each game design consists of multiple levels. Each level deploys a Series V Krutetskii system of problems of a similar type whose function it is to foster generalization of a concept, or what I identify as the Intended Interpretant for that level. Collectively the SIGNS across game levels form a Series VII Krutetskii system of problems with graded transformations from concrete to abstract, whose purpose is to facilitate generalization of the intended object (abstract mathematical learning goal) from the SIGN sequence. Levels 4 and 5 exemplify Krutetskii Series XVII direct and reverse problems for assessing ability to change the direction of a mental process. While it is impossible to depict the interactivity of these concept visualization games in print format, Fig. 13.3 provides a static visual overview of one game and its five levels.

A bird’s eye view of the visual flow of the 5-level ST Math Area Game
3.5 Analysis of Visualization Task
Figure 13.3 depicts the 5-level Area of Rectangle game, a progressive visualization task I use in the methods course to illustrate learning and teaching mathematics through visualization and representations. Below I examine the game within and across levels for chains of significance in search of design principles for a conceptual framework to guide prospective teachers’ creation of progressive visualization tasks (semiotic chains) for the mathematics classroom.
The semiotic object of this ST Math game is area. Area is essentially a geometric concept; it is the two-dimensional (flat) space within a bounded region. A related concept is area measurement, or the number of square units covering two-dimensional space. The game relates the spatial concept area to its measurement; this relationship, which is illustrated particularly for a rectangle, applies as well to other geometric figures that may be regular or irregular.
-
Level 1. In level 1 of the game, the semiotic object is area of a rectangle. The sign (representamen), which signifies both the spatial quality of a rectangle’s area and its measurement, consists of three parts: (a) rectangle icon, subdivided into unit squares, which initially appears static but breaks apart during the game to confirm the game player’s area-measurement hypotheses, (b) two linked symbols (the word area followed by the mathematical equal sign), and (c) 10-by-2 highlightable interactive rectangular icon with numerical symbol label (index) that automatically pops up to indicate the number of highlighted squares (Fig. 13.4). To solve the interactive visual puzzle, which is without verbal directions, learners must click on various parts of the screen to see what happens. For each click the game generates visual feedback. Through trial and error guided by this visual feedback, students infer the level 1 puzzle’s underlying mathematical concept, the intended interpretant (II 1 ), namely that the interior space of the rectangle is called area and that its size can be determined by counting the unit squares in the interior of the rectangle.
Fig. 13.4 
Level 1 problem type

Students infer the II1 through noticing what happens to the highlighted unit squares of the dynamic 10-by-2 rectangle. Once highlighted, a numeral automatically pops up to indicate the quantity of highlighted squares after which the highlighted squares break up. The game then provides visual feedback to show whether or not the highlighted squares can be arranged into a shape that is congruent to the interior of the given rectangle. If this occurs, JiJi the penguin avatar walks across the screen to indicate mathematical success. If not, JiJi’s path will be blocked and an opportunity to retry the visual puzzle provided.
Another important semiotic feature of level 1, and all levels of the Area of Rectangle game, is the Krutetskii Series V system of similar problems that comprise the level. Multiple examples and opportunities for experimentation on the representamen (diagrams) are required to generalize the intended game-level concept (Krutetskii 1976) or interpretant for, as Peirce maintained, with any communication, inferring the intended interpretant from one example is unlikely as there is always a certain range of interpretation (Peirce as quoted by Joswick 1996, p. 100). To arrive at the intended consensus interpretation, the interpreter (or in this case the learner) requires multiple signs exemplifying the concept (object) with opportunity to experiment on them in order to experience the concept, reason with it (Joswick 1996, pp. 100–101), and ultimately infer the qualities of the intended object from the sign (representamen). For example, a common initial interpretation of the sign in level 1 is that the aim of the visual puzzle is to highlight a shape congruent to the given rectangle. Through experimentation learners notice however that the highlightable squares activate linearly in order from 1 to 10 making it impossible to highlight a rectangle comprised of three squares in row 1 and three squares directly above in row 2. Thus, the learners’ initial conjecture must be re-thought and a new hypothesis formed and tested. Further, as Peirce explains, even if a particular puzzle were to be solved correctly on the first attempt, it is unlikely that the desired level of generality for the intended interpretant will be noticed on the first inference (Peirce 1998, p. 212). The series of similar problems at game level 1 (as well as for the similar problem series at each of the other game levels) therefore provides, according to Peirce, opportunity for thought to develop about the intended object through experimentation on the level 1 sign. This experimentation produces a sequence of inductions and hypotheses that ultimately yield dynamic interpretants that tend toward the intended interpretant, that is, the desired ultimate consensual understanding of the initial intended object.
In sum, the intended interpretant (II1) for game level 1 is the spatial concept of area of a rectangle, its measurement, and the following inductive argument: If highlighted squares can be arranged into a shape that is congruent to the interior space of the rectangle, then the rectangle interior is called the area of the rectangle and the rectangle’s area measurement can be found by counting the unit squares of the given subdivided rectangle. This interpretant is a generalization derived from the series of eight similarly structured problems for which Fig. 13.4 serves as exemplar. The dimensions of other rectangles in the problem series vary from 3-by-2 to 4-by-3 to 3-by-4 to 5-by-2 to 2-by-4 to 1-by-6 to 2-by-3 to 2-by-5.
-
Level 2. The semiotic object for game level 2 is the same as for level 1, area of a rectangle. The sign (representamen) for level 2 is identical to that for level 1 with the exception that the numerical dimensions of the given rectangular icon are labeled (Fig. 13.5). Diagrammatically, therefore, the sign for level 1 is a subset of the sign for level 2. Generalizing from the Krutetskii Series V system of eight similar problems in level 2, and benefiting from the interpretive lens that the Intended Interpretant from level 1 (II1) provides, students infer the level 2 puzzle’s underlying mathematical concept, the intended interpretant (II 2 ): the area, or interior space of this rectangle, can be measured in one of two ways, either by counting unit squares of the subdivided rectangle or by multiplying the numerical linear dimensions of the rectangle. In fact, it is possible that level 2 game-interpreters may solve the visual puzzle but not notice that the product of the rectangle’s dimensions equals the area measurement of the given rectangle. This inference, however, will be required for game level 3. Notice here how each level of the game changes the previous sign to open up a new perspective on the object (Kadunz 2016, p. 35).
Fig. 13.5 
Level 2 problem type
-
Level 3. The semiotic object for game level 3 is, again, area of a rectangle. As for prior game levels, the sign (representamen) for level 3 represents two qualities of the intended object—its spatial character and its numerical measurement. The sign for level 3 is nearly identical to that for level 2 with the exception that the given rectangle is not subdivided into unit squares (Fig. 13.6). The interpreter must either hypothesize the number of unit squares to highlight (and have this confirmed or rejected by the interactive puzzle) or recall the relation discovered in level 2 (i.e., area measurement of a rectangle can be determined by either counting the unit squares within the rectangle interior or multiplying the rectangle dimensions). With the benefit of the intended interpretant from level 2 (II2), a reasonable conjecture for the area problem in Fig. 13.6 is to highlight 6 unit squares. The game will provide visual feedback identical to that previously described: highlighted squares will break apart and either cover (or be shown to not cover) the interior space (area) of the rectangle. From this experimentation on the level 3 sign/representamen, students infer the level 3 puzzle’s underlying mathematical concept, the intended interpretant (II 3 ): the area, or interior space of this rectangle, can be measured by multiplying the numerical linear dimensions of the rectangle.
Fig. 13.6 
Level 3 problem type
-
Level 4. The semiotic object for game level 4 is, as for previous levels, area of a rectangle. While the component parts of the sign (representamen) for level 4 are identical to that for levels 1 and 2, their order and relation are reversed (Fig. 13.7). Whereas levels 1, 2, and 3 posit a rectangle of given magnitude and require inference of the rectangle’s area measurement, level 4 posits the rectangle area measurement pictorially as a collection of unit squares and requires creation of a rectangle whose magnitude equals the given area measurement. Through experimentation on the representamen students infer the level 4 puzzle’s underlying mathematical concept, the intended interpretant (II 4 ): area of any rectangle equals the product of its dimensions. For the given area of 6 square units in Fig. 13.7 a variety of rectangles (1-by-6, 2-by-3, 3-by-2, or 6-by-1) could be drawn on the interactive digital grid to solve the visual puzzle.
Fig. 13.7 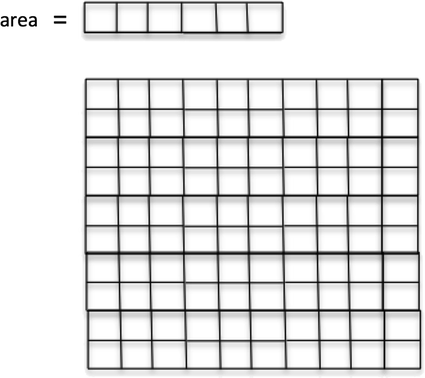
Level 4 problem type
-
Level 5. Level 5 maintains the structure and reversed logic of level 4 but presents the area measurement of the rectangle numerically (e.g., 6 cm2) instead of as a picture of unit squares (compare Figs. 13.7 and 13.8). Given the area measurement of a rectangle numerically, players must manipulate the representamen diagram to create a partitioned rectangle whose area measurement equals the given measure. Essentially, therefore, the intended interpretant of level 5 (II 5 ) is the symbolic formula for area of a rectangle, Area = length times width, or A = L × W.
Fig. 13.8 
Level 5 problem type


3.6 Semiotic Chaining Analysis
To determine whether the area of rectangle game is a semiotic chain, I analyzed the game from a variety of perspectives. First, I examined the representamens across game levels for a Peircean nested semiotic chain in the sense reported by Presmeg (2006b) for Adeyemi and Hall. Analysis of the game’s representamen failed to produce such a chain. Second, I examined the argumentation that produced the Intended Interpretants for each game level. Finally, I analyzed the game according to Peirce’s design principles for diagrammatic reasoning sequences.
3.6.1 Chaining by Argumentation Through Deductive Inference
Given that the SIGN at each level of the Area of Rectangle game includes representamens comprised of iconic diagrams that for Peirce invited deductive reasoning, it is a logical move to explore deductive inference as the source of a syllogism that might yield a semiotic chain within this game. Recalling Peirce’s claims that all mathematical reasoning is diagrammatic and that reasoning with diagrams has the power to reveal things hidden from view about the logical structure of the diagram, about the relationship of its parts to one another, and about the analogical relation of these parts to the intended object, I examined the argumentation within the game. Table 13.2 illustrates the results of my analysis also elaborated below.
In the following argument, I define A, B, and C to hold the following meanings:
A = area = rectangle interior space
B = measure(A) = count A’s unit squares
C = measure(A) = multiply dimensions of A
Level 1 diagram implies:
Through diagrammatic reasoning on the level 1 diagram, students discover:
measure(A) = B
Level 2 diagram implies:
Through diagrammatic reasoning, students discover:
measure(A) = B,
measure(A) = C.
Through deductive reasoning, students discover that two things equal to the same thing are equal to each other, or B = C.
Level 3 diagram implies:
Through diagrammatic reasoning OR through application of relationships learned at level 2, students discover:
measure(A) = C.
Through inductive reasoning conducted on the level 3 system of similar problems, students discover the formula:
Area measurement of rectangle = length x width.
Level 4 diagram implies:
Through diagrammatic reasoning OR through application of relationships learned at levels 1 and/or 2, students discover:
if B = measure(A), then a rectangle interior (A) of appropriate size can be created to equal B square units.
Level 5 diagram implies:
Through diagrammatic reasoning OR through application of relationships learned at levels 2 and/or 3, students discover:
if C = measure(A), then a rectangle interior (A) of appropriate size can be created to equal C square units and the dimensions of this rectangle will be factors of C.
Argued more succinctly, it follows that if the area measurement of the rectangle subdivided into unit squares equals the number of unit squares covering the rectangle interior (II1), and the number of unit squares covering the rectangle interior equals the product of the rectangle dimensions (II2), then by deductive argument, the product of a rectangle’s dimensions equals the area measurement of a rectangle subdivided or not (II3). From an inferential reasoning point of view, the concepts and relations inferred across levels 1, 2, and 3 form a semiotic chain based on deductive inference in the sense that the argumentation for level 1 implies the argumentation for level 2 which in turn implies the argumentation for level 3 because it was already established in level 2. The model of chained inferential reasoning described above does not extend to levels 4 and 5. I argue, however, that a semiotic chain based on deductive inference exists across game levels 1–3.
3.6.2 Chaining by Design: Peirce’s Three-Step Plan for Chaining Diagrams
At this point, it would be instructive for the reader to return to Peirce’s description of diagrammatic reasoning quoted earlier in the chapter. In this passage, he alludes to the design of chains of signification with diagrams (Peirce 1998):
We not only have to select the features of the diagram which it will be pertinent to pay attention to, but it is also of great importance to return again and again to certain features. Otherwise, although our conclusions may be correct they will not be the particular conclusions at which we are aiming. But the greatest point of art consists in the introduction of suitable abstractions. By this I mean such a transformation of our diagrams that characters of one diagram may appear in another as things. (p. 213)
To create such a sequence of diagrams, Peirce proposes a plan based on three basic principles of inference: principle 1, “copulating several propositions into one compound proposition;” principle 2, “omitting something from a proposition without introducing error;” and principle 3, “inserting something into a proposition without introducing error” (Peirce 1998, p. 213). I will argue that these principles undergird the Area of Rectangle game.
Table 13.2 illustrates application of Peirce’s three principles to the design of semiotic chains based on diagrammatic reasoning in the representamen and argumentation columns. Beginning with the level 1 diagram (representamen), apply Peirce’s third principle to yield the diagram (representamen) for level 2. This results in the addition of numerical dimensions to the level 1 diagram without introducing error. At level 2, experimentation with the diagram produces a diagrammatically reasoned and previously confirmed (true) proposition m(A) = B along with a newly inferred true proposition m(A) = C. Following Peirce’s first principle, form these two propositions into a (true) compound proposition, m(A) = B and m(A) = C, using the laws of logic for truth tables. Next apply Peirce’s second principle: drop one of the true propositions (m(A) = B) from the compound statement to infer the true proposition at level 3, namely m(A) = C: since both members of the conjunction (“copulation” in Peirce’s terminology) are true, one of the members of the conjunction can be dropped without changing the truth value of the conjunction from True to False.
3.7 Towards a Conceptual Framework for Semiotic Chaining
Peirce’s three design principles constitute the basis for a conceptual framework of semiotic chaining grounded in diagrammatic reasoning. The semiotic chain revealed by the above analysis is an application of Peirce’s design principles for diagrammatic reasoning. I suggest that the innovative progressive concept visualization task analyzed above exemplifies a new type of semiotic chain that I characterize as a Peircean diagrammatic semiotic chain. As illustrated by the progressive concept visualization task analyzed in this chapter, the links within diagrammatic semiotic chains are Peircean iconic diagrams sequenced with the planned inferential logic of the Peircean design principles for true statements: A, A and B, B. Also noteworthy in the above analysis is the role that translation of representations may play in the design of diagrammatic semiotic chains. In this instance, the insertion without adding error of a numerical representation into a pictorial one makes application of Peirce’s third principle possible. I suggest the three Peircean principles of diagrammatic reasoning provide mathematics teacher preparation with an accessible, conceptually clear visualization-pedagogy for use with pre-service teachers to guide their planning of progressive visualization tasks that (1) link visual and symbolic representations of the same mathematical notion and (2) foster mathematical generalization and abstraction. The diagrammatic reasoning structure proposed by Peirce, together with the principle of translating representations, provide the basis for a specialized conceptual framework of semiotic chaining grounded in Peircean iconic diagrams. Future reflection and comparative research on the affordances of the three types of semiotic chains—dyadic, nested, diagrammatic—will help to close the gap in our understanding of visualization practices for mathematics teacher preparation.
References
Adeyemi, C. M. (2004). Semiotic chaining: Preservice teacher belief and instructional practices (Doctoral dissertation). Retrieved from ProQuest Dissertations and Theses. (Accession Order No. AAT 3172873).
Arcavi, A. (2003). The role of visual representations in the learning of mathematics. Educational Studies in Mathematics, 52, 215–241.
Bishop, A. (1980). Spatial abilities and mathematics education—A review. Educational Studies in Mathematics, 11, 257–269.
Bruner, J. S. (1961). The process of education. Cambridge, MA: Harvard University Press.
Cramer, K. (2003). Using a translation model for curriculum development and classroom instruction. In R. Lesh & H. M. Doerr (Eds.), Beyond constructivism: Models and modeling perspectives on mathematics problem solving, learning, and teaching (pp. 35–58). Mahwah, NJ: Lawrence Erlbaum.
Dienes, Z. P. (1973). A theory of mathematics learning. In F. J. Crosswhite, J. L. Highins, A. R. Osborne, & R. J. Shunway (Eds.), Teaching mathematics: Psychological foundations (pp. 137–148). Ohio, OH: Charles A. Jones Publishing.
Hall, M. A. (2000). Bridging the gap between everyday and classroom mathematics: An investigation of two teachers’ intentional use of semiotic chains. Retreived from ProQuest Dissertations and Theses. (Accession Order No. AAT 9971753).
Joswick, H. (1996). The object of semeiotic. In V. M. Colapietro & T. M. Olshewsky (Eds.), Peirce’s doctrine of signs: Theory, applications, and connections (pp. 93–102). Berlin, Germany: Walter de Gruyter & Co.
Kadunz, G. (2016). Geometry, a means of argumentation. In A. Saenz-Ludlow & G. Kadunz (Eds.), Semiotics as a tool for learning mathematics: How to describe the construction, visualization, and communication of mathematical concepts. Rotterdam, The Netherlands: Sense Publishers.
Kinach, B. M. (2002). A cognitive strategy for developing pedagogical content knowledge in the secondary mathematics methods course: Toward a model of effective practice. Teaching and Teacher Education, 18, 51–71.
Krutetskii, V. A. (1976). The psychology of mathematical abilities in school children. Chicago, IL: University of Chicago.
MIND Research Institute. (2014). Spatial-temporal (ST) math. Irvine, CA: The MIND Research Institute.
National Council of Teachers of Mathematics. (2000). Principles and standards for school mathematics. Reston, VA: Author.
National Governors Association Center for Best Practices, Council of Chief State School Officers. (2010). Common core state standards (Mathematics). Washington, DC: Author.
Peirce, C. S. (1992). The essential Peirce (Vol. 1, 1867–1893). In N. Houser & C. Kloesel (Eds.). Bloomington, IN: Indiana University Press.
Peirce, C. S. (1998). The essential Peirce (Vol. 2, 1893–1903). In Peirce Edition Project (Eds.). Bloomington, IN: Indiana University Press.
Presmeg, N. (2006a). Research on visualization in learning and teaching mathematics. In A. Gutierrez & P. Boero (Eds.), Handbook of research on the psychology of mathematics education: Past, present and future (pp. 205–235). Rotterdam, The Netherlands: Sense Publishers.
Presmeg, N. (2006b). Semiotics and the “connections” standard: Significance of semiotics for teachers of mathematics. Educational Studies in Mathematics, 61, 163–182.
Presmeg, N. (2013). Contemplating visualization as an epistemological learning tool in mathematics. ZDM—The International Journal on Mathematics Education, 46, 151–157.
Rivera, F. D., Steinbring, H., & Arcavi, A. (2013). Visualization as an epistemological learning tool. ZDM—The International Journal on Mathematics Education, 46, 1–2.
Sáenz-Ludlow, A., & Kadunz, G. (2016). Constructing knowledge seen as a semiotic activity. In A. Sáenz-Ludlow & G. Kadunz (Eds.), Semiotics as a tool for learning mathematics: How to describe the construction, visualization, and communication of mathematical concepts (pp. 1–21). Rotterdam, The Netherlands: Sense Publishers.
Stjernfelt, F. (2007). Diagrammatology: An investigation on the borderlines of phenomenology, ontology, and semiotics. Dordrecht, The Netherlands: Springer.
Author information
Authors and Affiliations
Corresponding author
Editor information
Editors and Affiliations
Rights and permissions
Copyright information
© 2018 Springer International Publishing AG
About this chapter

Cite this chapter
Kinach, B.M. (2018). Progressive Visualization Tasks and Semiotic Chaining for Mathematics Teacher Preparation: Towards a Conceptual Framework. In: Presmeg, N., Radford, L., Roth, WM., Kadunz, G. (eds) Signs of Signification. ICME-13 Monographs. Springer, Cham. https://doi.org/10.1007/978-3-319-70287-2_13
Download citation
DOI: https://doi.org/10.1007/978-3-319-70287-2_13
Published:
Publisher Name: Springer, Cham
Print ISBN: 978-3-319-70286-5
Online ISBN: 978-3-319-70287-2
eBook Packages: EducationEducation (R0)