It is very important to motivate primary school students in a way that they enjoy mathematics, e.g. by encouraging their creative perspective on it. This could be achieved by using everyday tools, i. e. tools children are familiar with in regard to manipulation. With respect to, for example, graph theory teachers can introduce the subject matter by giving the instruction to draw and play with several graphs with paper-and-pencil, or with the help of advanced technology. This technology is a precious tool for conjecturing activities due to the high variety of cases that can be observed and compared simultaneously – which is also a lot less time consuming than with paper-and-pencil activities. In this chapter, we describe selected graph theory activities for third and fourth classes of primary school which were designed for the application of technology; for this purpose, we named these activities mathematics laboratory.
Everyone should enjoy
learning because if you enjoy what you do – in comparison
to doing something because it is your obligation
to do so – you get maximum results with a minimum
of effort. This is particularly
true
for children
. At the beginning of institutionalized education
, i.e. for pre-school children, mathematics
is not yet that “monster
” as some older
children might perceive mathematics. Five-year-old children tend
to enjoy mathematics as an internalized experience
(Vygotsky 1986) rather then externally suggested to them. Thought
and emotion
agree
; this influences
the learning process
positively
because as Brown (2012, p. 186) states: affect
, far from being the “other” of thinking
, is a part of it. Affect influences thinking, just as thinking influences affect (see, e.g., Chapter “A Framework for Failed Proving Processes in a Dynamic Geometry Environment”, this volume
).
As soon as children enter young adulthood
, they commonly develop a negative
attitude
towards mathematics (Di Martino 2007) which originates from many causes, including the experience of unfit
teaching methodologies
. These include
, for example
, learning without manipulating, learning without self-generated hypotheses
, or without connecting mathematical concepts
to reality
(Mammana and Milone 2009a, b). This possibly results in an alienation
of pupils
from mathematics as well as from the viewpoints
of thinking and affection.
Too often, teachers
do not integrate all the potentialities
of their digital native students
, who could make use of their natural inclination
towards technology
to learn better and faster. On the other hand, the use of technology is already integrated in teaching mathematics
: just think of 2.0 classes, or the high variety of software
and apps designed for math teaching and learning. Of course, technology is not a panacea
for all math related problems, which can be seen by the many ongoing studies that are concerned with the advantages and disadvantages of technology in the classroom practice
such as Drijvers’ study (2012). Obviously, the use of technology is not self-sufficient
in a way to ensure learning to occur in favourable
ways.
This strongly
technology-based
teaching experiment with primary school children is build up on laboratorial modalities as well as learners’ real-world experiences
that we called “horizontal teaching
” (Ferrarello et al. 2014). Horizontal teaching is a kind of teaching in which the teacher aims to envision
the student’s perspective
and set up a learning environment that originates from this shared perspective. Horizontal teaching necessitates that the teacher acquires knowledge on the students’ perspective on life
, to understand their needs
, to analyse their reality. This consequently requires an extra effort of the teacher, but it is effective and promises
to enlarge not only the students’ knowledge, but also the teacher’s knowledge (see Fig. 1).
In this context
, we apply the term “reality
” not only to physically existent, touchable objects
, but also to situations and characters that are familiar to children with the aim
to motivate their effort to study. These could be, for example, cartoon characters, personal relationships, etc. And by “envisioning the student’s perspective” we refer not only to the application
of mathematical concepts
familiar to the pupils, but also to code switch
to a level
of language
use to which students can adapt to.
In this sense
, the use of technology is intended to be a language
that is familiar to pupils and therefore could be applied to the above-mentioned setting up of a learning environment that originates from a shared perspective of teacher’s and student’s knowledge.
In this respect, we developed a mathematics
classroom activity
for primary school children on the concept of graphs. In fact, a small variety of graph-theory
concepts are sufficiently simple enough to be proposed to primary school children. The basic mathematical concept of a graph is quite straightforward: a graph G = (N, E) consists of a set N, whose elements we call nodes
, which we represent as points; and a set E, formed by couples of nodes that we call edges, which are represented as lines; i.e., an edge is a line connecting two nodes A and B in the set N, if the couple {A, B} is in E.
The prior
, situational aim
of this teaching experiment is to make children enjoy mathematics; the secondary, future-oriented aim is to familiarise children with the concept of modeling real-life situations with the aid of graphs. The mathematical concept of the graph is well suited for this intention
because it is easily visualizable, drawable, open for an explorative, creative take on it, and also because it is quite useful to describe real-life situations by schematizing them.
It is not by chance that there is an increasing attention towards graph theory in several international projects (e.g., http://math.illinoisstate.edu/reu/). Not only is there an undeniable effectiveness graphs and their several representations, but also National Standards
– in Italy, at least – ask for tools that enable to “represent relations and data and, in significant situations, use the representations to get information, formulate opinions and make decisions” as an aim for students at the end of primary school
(Ministero dell’Istruzione, dell’Università e della Ricerca 2012) in order to support a concept
of mathematics
as “a context to solve and pose significant problems”. These tools are provided by graph theory, but despite such precise requests, Italian teachers often do not integrate graph theory into their teaching in primary school; even further, quite a high amount of teachers are not familiar with the basic concepts of graph theory
.
The approach of this activity
is adapted from the one described in Aleo et al. (2009) and based on mathematics laboratories
(Chiappini 2007). For our teaching environment, we altered the activities in such a way that they fit
the requirements of eight to nine years-old students. Additionally, they are enriched
with the use of technology as described in the following sections
. Theoretical
references to topics
can be found in Higgins (2007) and Wilson (1996).
The next part of the chapter deals with the methodology
used in the teaching experiments and further presents the technology provided to the children – namely the software
and games
used. We give a description of all the aspects and suitable activities of graph theory involved in the courses. Moreover, for a more detailed insight in our study, we describe a complete instructional unit
in detail. Finally, we present the main results and draw possible conclusions. A short glossary of the basic definitions
we used in our teaching experiment (in alphabetical order), together with a collection of activities, is provided in the appendix at the end of the chapter.
Methodology
The teaching experiment activity has been carried out three times
, twice during the school year 2012/2013 and once in school year 2013/2014. It was led by the author
– who is not a primary-school teacher – and therefore was both a researcher as well as a teacher during the teaching experiment activities. In regard to practical duties, she was tutored by an assistant. Each teaching experiment activity – which had a total duration of about three month – consisted of 12 weekly meetings
; the children participated voluntarily. They came from different morning classes – but from the same grade
– and were put together into groups of 14 to 20 children. In total, about 50 students participated.
Some activities, like Eulerian and Semieulerian
graphs, were given the time of more than one meeting because the different sub-contents
were based upon one another, so the children were given the time to think about the subject matter at home as well as the possibility to enjoy
the topic
instead of consuming it in a “fast and furious” way. Other activities, like the ones on nodes and edges, were introduced simultaneously because they relate to the same mathematical concept
.
The activities were embedded
within the laboratorial methodology
, which means that they were embodied-mind oriented by making children manipulate the objects and discover their properties. Activities
proposed by the teacher (i.e. the author of this chapter) as problems to be solved were introduced to the children on the whiteboard. This led to the situation that some students attempted to solve the posed problem directly on the whiteboard while other students tried to solve it in their exercise
books or suggested a strategy
to their fellow
students. Intermediate
and final tests
, combined with satisfaction questionnaires, were collected and analyzed. The teaching experiment was not filmed, except for selected moments during the production
of a poster
.
Technologies
As it was said before, technology is a significant tool for our activity. In agreement
with diSessa et al. (1991), “we believed that design
, construction
, and exploration
of dynamic games and simulations would provide a rich context for an initial exploration into what children’s science might involve” (p. 3). We used different technologies, e.g. paper-and-pencil
, coloured chalks, etc. and dynamic software to handle graphs, online games, etc.
The whole teaching experiment activity was held in classes with Multimedia
Interactive Whiteboards in addition to a classical blackboard and chalks. This resulted in children who manipulated graphs with paper-and-pencil, dragging nodes and deforming edges both with a dynamic graph editor
and online games namely with the YED Graph Editor
(http://www.yworks.com/en/products_yed_ about.html) which is a dynamic software that is designed to draw and explore graphs. Its main advantage is that you can easily draw nodes
just with a click; and you can choose nodes of many shapes
which represent several objects (e.g. people, geometric shapes, but also any kind of picture you want to import – just by dragging the pictures into the working area). For example, to draw an edge from node A to node B you just have to click on A and – keeping the mouse pressed – move on B – and release.
To drag nodes and to adjust edges with the help of this software is a very explorative and creative take on the mathematical concept of graphs. In our activity, many potentialities
of the software there were not intended to be applied; the children were just asked to use the basic functions, i.e. the ones sufficient to our purposes such as drawing graphs, moving nodes, changing shapes to edges, colouring nodes and edges with different colours, creating a random graph, or changing the layout
of the graph by putting it in a random shape.
Although the tool bar was in English, children did not encounter any difficulties in using the software. They learned to use the software by mimicking the teacher and trying for themselves afterwards.
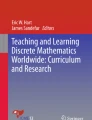
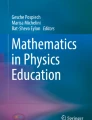
The pictures below illustrate an online game that includes Eulerian, Semieulerian
, and Hamiltonian
paths
in given graphs (see Fig. 2, Fig. 3) by wrapping the string
around the nails
to create the given shape
in each level.
It is not an educational software
, it is just a game. Moreover, it is not a game that is intended for children. However, this game was probably the most successful activity within our teaching experiment because children quickly learned how to construct and play with Eulerian graphs although they were not able to reach level 5 without knowing “the trick
” (see paragraph “An instructional unit
: Eulerian and Semieulerian graphs”). After they discovered and explained “the trick” about the degree
of the nodes
, they succeeded to complete all nine Eulerian levels.
The levels on Hamiltonian
graphs were more difficult to complete – even for adults – mostly because of the lack of a clear winning strategy. This is presumably why children were not able to solve more than four levels.
Not all children succeeded in the completion of this game. In order to make all the students enjoy the activity and make them practice their mathematical skills without risking frustration due to failure, we used YED to draw random
planar graphs and changing the layout randomly. Then, the students came to the whiteboard and dragged the nodes to put each graph in a planar layout
.
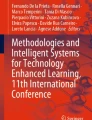
Strand is another online game whose aim it is to draw planar graphs with nodes of given degrees
. This game is quite helpful to understand the basic concept of planar graphs because there are more basic levels to solve compared to Fly Tangle. Moreover, while Fly Tangle
graphs are already drawn, Strand graphs are to be constructed. It showed that it was easier for children to build planar graphs step by step instead of adjusting tangled graphs. Furthermore, this game
is applicable to reason about degrees. In fact, every node has a variable number
that is the number of nodes yet to be connected with it. For instance, in the graph of Fig. 5, there is a missing edge between the two nodes with a “1” degree left, while the “0” degree nodes are complete.
In the following, we describe a selected variety of the activities that have shown to be the most intriguing examples arising from “real” problems, by using multiple software, and online games. As examples, we briefly present the activities 1), and 3) as well as justifying our motivation
to use them. The whole path on Eulerian and Semieulerian graphs, including activities 6), 7), 8), is discussed in detail in the following section while other activities are illustrated at the end of the chapter, in the appendix
.
Introduction to Graph Theory
Activity (1) The Königsberg Bridges
Problem
This puzzle
has been introduced by telling the well-known Königsberg bridges story, and making the children try and find a possible path in the map of Königsberg by touching every bridge just once. A schema of the Königsberg city was drawn which included the Pregel river, the islands, and the seven bridges. It was drawn on the blackboard
, and in a second step students tried to find a proper path. Then, the children were told how a famous mathematician, named Euler, had the idea
to model
this problem by assigning a point to every region of the city and a line to every bridge. Children were asked to draw the appropriate graph upon the map of Königsberg
by using the appropriate software (in this case
YED) to handle graphs.
After the graph (Fig. 6) was completely drawn, the children copied it in their exercise books and continued to work on it by themselves with pencil-and-paper. Whenever some of them claimed to have found the solution, he/she came to the whiteboard to show his/her possible solution. We did not immediately reveal that the problem does not have a single solution, so the children continued to work on the activity at home – also asking their parents about this problem.
Fig. 6
Model of the Königsberg’s problem by graphs (made with YED)
Additionally, other examples of graph problems that required every edge to be visited just once were given in order to make pupils aware that similar problems are actually solvable. Later on, the problem of Königsberg was shown to be unsolvable when Eulerian and Semieulerian graphs were introduced.
One of the greater misconceptions
of mathematics – since primary school – concerns “the” solution of a problem: every problem – they taught us – has a solution; and it has just one solution, preferably reachable with a particular method and only that method. This idea of mathematics does not really do justice to the complex and creative concepts of mathematics; and, above all, it does not fit the real world. If we want to teach real mathematics in real world situations, we should make students aware that many problems are “open” to no solution, or multiple solutions. The Königsberg’s puzzle was one of the “no solution” problems we posed while several “multiple solutions” problems were handled, for instance
, by using the game Strand
.
Activity (3) The Matching
of Disney Princesses
with Their Boyfriends
A drawing of Disney princesses and their boyfriends was given to the students (see Fig. 7); each princess had an assigned boyfriend. But, all princesses and their boyfriends were mismatched
. So, the students were asked to correct
and redraw the connections to end up with the right matches (see Fig. 8). It could be observed that they had a lot of fun with this activity – partly because they had more knowledge about the right matches than the teacher. This graph is useful to introduce the degree
of a node
.
Fig. 7
Wrong
connections between princesses and boyfriends (made with YED)
Moreover, it is useful to introduce isolated nodes
.
Teacher: Does Ursula have a boyfriend? Which degree
does Ursula have?
Students: Zero
!
After the students have finished to match up the princesses with their boyfriends, one can use these graphs for to explain the mathematical notion of a function: if we take Ursula out of the equation
and follow the requirement that every princess has to have only one boyfriend, we develop a function from the set of princesses to the set of boyfriends – a non onto function, actually, because of Gaston and Sebastian, who have no girlfriend.
Finally, we adjusted the graph by putting all the princesses upside and all the boyfriends downside (as older students usually do with bipartite
graphs), so that the graph is ready to represent a function with a separated domain
and image
set.
This is one of many examples of graphs that can be used in order to introduce the notions of functions and relations.
In general, the activity was appreciated because of its integration into the students’ reality
. If it is true that the “concrete
” is the “abstract” that becomes familiar – also fictional objects such as cartoon princesses – they thereby become real objects. Presumably, this is why the children manipulated these objects with naturalness and straightforwardness. It was natural for them not only to connect matching characters with a line and correct wrong connections, but also to move nodes in such a way that the set of nodes resulted in two split
partitioned
sets
.
An Instructional Unit
: Eulerian
and Semieulerian
Graphs
In this section, we describe concept of Eulerian and Semieulerian graphs in detail. For matters of clarification
, we named Eulerian and Semieulerian graphs “walkable”.
At first, we briefly refer to the process of acquiring and using knowledge described by Spijkerboer (2015) with the use of the O.B.I.T. model: Remember
, which means to acquire knowledge by the use of appropriate words or images; Understand, which refers to the acquisition of knowledge by practising procedures; relate, i.e. the use of already acquired knowledge by relating it to new situations; and Creative Application
, which includes the use of knowledge in order to establish individual approaches of how to deal with a task.
The first two items, Remember
and Understand
, are linked to the surface approach, and focus on reproduction and memorization in order to relate “what I know” to “how to do it”. The other two items, Relate
and Creative Application
, are part of the deep approach and focus on relationships among different aspects of the content and the competencies to “know what to do with what I know”. Quite often, we are tempted to think that the deep approach is better than the surface approach. But, both approaches have a value, especially for kids, who need the surface approach. What we, as teachers, should not do is to stop at the surface approach, but to use also the insight
and creativity
to make students able to apply their creativity as well. Further, we should give the students time and space
to grasp the concept of what they are working on – to deepen their understanding of it, to elaborate on it, and to use it creatively.
As we are going to explain in detail
, in this teaching experiment we used both approaches; and we focused on the appropriate use of words and included story-telling to strengthen the chances that the mathematical concepts are being remembered. Further, we included games for practicing the reproduction of solving strategies, we used insight and argumentation to deepen the concept, we used stories as tasks to make it easier to apply knowledge that is already there, and we encouraged students to transfer their newly acquired knowledge to their own daily-life
problems or to observe reality in order to draw further connections to the mathematical concept of graphs.
We started with the Remember phase of the O.B.I.T. model: For matters of simplification, we named Eulerian and Semieulerian graphs closed walkable and open walkable, respectively, because the concept of walking is graspable for students while the mathematical technical terms are not. Further, it made them recall the activity where they walked through the edges of the graph and therefore had an idea of what is requested for a graph to be walkable.
The instructional unit
proceeds with the following phases:
Historic Introduction
The topic
was introduced by the seven bridges problem (activity 1). We retold the story and invited the students to think about a possible solution
for the inhabitants of Königsberg
. As discussed before, the students were guided to solve the problem with an appropriate mathematical model, i.e. a graph. This was when we passed from the real-life situation to the graph of Fig. 6, which is based on the picture of the city of Königsberg with the help of the YED software. This mathematical problem remained unsolved for a couple of lessons
. During that time, it sometimes happened that parents
asked their children
whether they had managed to solve that problem. For us, this meant that children got highly involved into the problem and even thought about it outside
of the classroom situation – eager to solve it.
For reasons of motivation
, solvable
problems – as the classical cabin of Fig. 13 – were presented to the students to make them aware that not all problems are unsolvable or difficult, so that they would have fun and acquire a sense
of self-efficacy
during the process.
After nodes
, edges, and degrees
were introduced, the children could practice on those walkable graphs. By analyzing and practicing on these graphs, the students were asked to identify similarities among walkable graphs and to discover that such graphs had only nodes of even degree – which are mathematically defined as Eulerian graphs, but we called them closed walkable –, or just two nodes of odd
degree – which are mathematically defined as Semieulerian
graphs, but we called them open walkable. Then, students practiced with several graphs, decided whether they were walkable or not by hand, drew walkable graphs without lifting the pencil from the paper (activity 6), and practiced paths in walkable graphs – especially by means of the online game Icosien
(activity 8). In addition, we realized such graphs also with strings
(see Fig. 9).
A variety of figures was presented to the group of primary school children (see Fig. 10). They were then asked to draw the individual graphs in one go and the premise to pass every edge just once.
In general, we noticed that students were quite excited about this activity. At the beginning, they were convinced that it was always possible, especially after several consecutive
successes. When they failed to accomplish to redraw a graph (e.g. graph e in Fig. 10) they were convinced that they had made a mistake rather than thinking about the possibility that it might be impossible to do so, so they went on trying and trying. When we claimed that it was impossible to redraw “graph e” as a walkable graph, they did not believe it and kept on trying.
Practice with Sentences
After that, we practiced on words and sentences. The graph in Fig. 11 was used to practice paths – especially Semieulerian paths. For this purpose
, we posed the question “Can you read the sentence hidden in the graph?”
Fig. 11
Semieulerian graph
to represent a sentence
(made with YED)
Starting from a node of an odd degree – in this case G – you end up in the other node of odd degree – in this case E. The sentence that has formed is “Grafo percorribile”, which is Italian for «walkable graph». As explained in the following, this graph was further used to introduce loops and multiple edges. When letters occur twice such as “R” in the word “percoRRibile” they have to be repeated, which means that we have a loop
in “R”, i.e. an edge that connects a node to itself. When there is a sequence
of three letters whose first and third letter are the same, as the two I of IBI in the word “percorrIBIle”, you have to return to the first letter by passing the second letter. In this case, you need a multiple
edge between the first and the second letter.
Children played not only with sentences as in Fig. 11, but also with anagrams and graphs related to possible configurations
of letters, e.g. as in the popular game Ruzzle, where letters can be used consecutively if they are neighbours in vertical, horizontal, or diagonal direction
. The graph associated to a Ruzzle level is made of the letters shown in the game board
as nodes
; two letters are connected by an edge if you can use them consecutively in a word. For example, to form the word “sea” you have to follow the path ‘s’, ‘e’, ‘a’. You can do that because ‘s’ and ‘e’ are connected and ‘e’ and ‘a’ are connected. However, you cannot form
the word “tea” because ‘t’ and ‘e’ are not connected (see Fig. 12).
Fig. 12
A Ruzzle frame and a graph related to some letters of the frame
Figure 12 illustrates a graph that is linked to the highlighted rectangle
. After they were shown this example, the students were asked to think about their own set of letters with their individual connections among such letters. The aim
was to find a set with the least possible number of letters, but with the most possible number of words. The students did this activity at home; and when they were back in school, they were quite proud to show the word-graph
they had produced on their own. Such examples are considerably useful to practice on paths, but for them it was rather challenging to identify walkable paths. This is why they came up with the idea that not all graphs are walkable even though it was the first concept of graphs that had been introduced to them. Before the introduction of this activity, they had always been induced to consider eulerianity in every graph they were confronted with, even if the task made explicit that they were dealing with, for instance
, a Hamiltonian
graph, or trees.
Conjecturing by Online Games
The online game “Icosien” proofed
to be quite useful to practice on Eulerian and Semieulerian
graphs. This is partly because this game clearly indicates actions that are not allowed. For example, if you intend to connect two nodes that are not connected by string
, or you want to cross an edge twice the string – that is yellow – becomes red. While working with the online game, the children were independent from the teacher’s advises. We intervened only occasionally because it was our aim that every child tries by him/herself – aided by the software
or receiving suggestions
by classmates
if necessary. Rarely, a student quit the game because he/she failed a level. In the majority of cases the atmosphere among the students was collaborative, so if someone needed assistance
the other students helped him/her. At the beginning, the children tried to construct graphs by wrapping the string around the nails starting off from an arbitrary node. This solving strategy
stopped working out at level 4, and they began to notice that for some graphs – the Eulerian ones – the starting point is irrelevant while for other graphs – the Semieulerian
ones – only two nodes were suited to be the starting point. The strategy of odd-degree nodes was evident in the graph of Fig. 13, the cabin they were able to solve also with paper and pencil, and we decided later on to use just this graph for reasoning activities. Little by little, they identified that if there are two nodes with odd degrees (the degree of a node was already introduced in the previous lessons), they needed to start from one of them.
In the end, with the help of this winning strategy, all students were able to solve all levels of the online game. What was striking was that the students were solely satisfied to have established a strategy to win the game; however, they did not show any interest
in the motivation
why their strategy was successful. Instead, they preferred to think that it was a trick. In other words, they were satisfied with the surface
approach, being on the stage
of having memorized (Remember
in the O.B.I.T. model) the concept and to know how to act to “win the game” (Understand in the O.B.I.T. model).
The following activities were closer linked to the deep approach because it was our aim to establish a full understanding of the concept instead of letting “whatever works” to be sufficient
. This turned out to be quite challenging for such young students.
Argumentation
by Chalk (In Case That Technology Does Not Work)
Technology was indeed quite useful for experimenting activities; however, it would not have been useful for reasoning
. The online game was not suitable for the purpose to argue about odd degrees in Semieulerian graphs because the children would have been too focused on the game itself rather than on reasoning. This is why, instead of the whiteboard and our fingers, we used the blackboard and coloured chalks. Even though we did not explicitly talk about directed graphs
, we used oriented edges
(see Fig. 13). We argued about Semieularian paths on the basis of students’ examples, i.e. {1,2}, {2,3}, {3,4}, {4,2}, {2,5}, {5,4}, {4,1}, {1,5}. Due to this approach, the students did not encounter any difficulties in using oriented edges; on the contrary, they intuitively made use of arrows to follow a path
. Then, we coloured every source with a green chalk and every sink with a red chalk. After that, we focused on the two nodes 1 and 5 – they are the starting source and the ending sink
– and counted the green and red edges. In 1, we counted two green edges and a red one because the path first goes through edge {1,2}, then through edge {4,1}, and finally through edge {1,5}. After passing {1,5}, the path abandons node 1 because our path equals a Semieulerian graph. This is because of the odd number of edges. In that case, the first two edges are edges were the path changes its direction – but will pass the edges for a second time – while the last edge indicates the end of the path. We did similar
examinations
on node 5, which we also pass twice, i.e. in {2,5} and again in {5,4}, and then we end the path in {1,5}. So this second path has one green starting source and two red ending sinks – one of which is used to complete the path.
The other nodes are classified as passing nodes because their amount of being a starting source and ending sink is equal.
This figure proofed helpful to make young students understand the motivation for the two odd-degree
nodes of Semieulerian graphs. In regard to Eulerian graphs, we identified that the starting point coincides with the final point, i.e. we have the same number of outgoing and incoming edges. The entire phase of argumentation
was teacher-led who stimulated the students with questions, encouraged them to express their thoughts
, made them reflect on their own actions and claims, and, finally, thanked them for their insights
and reflective
reasoning
.
Ongoing Test
: Eulerian Carnival
Halfway through each activity we integrated a test to monitor
each student’s learning progress. In the first year, the test was about Eulerian and Semieulerian graphs. The students were given a variety of graphs and were asked whether these are Eulerian or not. In the case of a positive
answer, they were asked to give an example. The majority of students completed this test successfully. In the second year, additionally to a selection of classical exercises, we decided to integrate a story which was already used in the first year as a whole class
activity – “The Eulerian carnival”.
The story taken from Aleo et al. (2009, p. 112) is the following:
We are in a strange place called Polygonsland
, peopled by polygons, namely the Decagon, that is the king of the land, Mr. Equilater Triangle, Mr. Isosceles Triangle, Mr. Square, Mr. Rectangle, Mr. Pentagon and Mr. Hexagon. For the three days of Carnival, the naughty king Decagon, as he usually does every year, announces a contest. The inhabitants of Polygonsland are requested to walk in the path drawn in Fig. 14, by passing from every street, but only once. Each inhabitant
starts from an assigned emplacement, as shown in Fig. 14: A for Isosceles
Triangle, B for Rectangle, C for Square, D for Pentagon, E for Equilateral Triangle, F for Hexagon
.
Fig. 14
Path for Polygonsland
contest
(Aleo et al. 2009, p. 112)
In the emplacement O there is a treasure, when you pass by O you can take the treasure. It is not requested that O is the last emplacement to visit.
Question 1:
Why did we say that the king was naughty
? … Is the king sure that no one could win? … Why? …
But during the night Mr. Isosceles
Triangle, who is smart and knows graph theory, decides to modify the trace
by adding a new street in such a way to win.
Question 2:
Which street is built by Isosceles Triangle to win the contest? …
So, the first day of the contest Mr. Isosceles Triangle wins. The king is surprised, but the contest goes on. Mr. Equilateral
Triangle, who knows graphs too, and understood everything, during the second night also modifies the path, in such a way he wins.
Question 3:
Which street is built by Equilateral Triangle to win? …
So, the second day of the contest Equilateral
Triangle wins. The king is disappointed, but the show must go on. Finally Mr. Rectangle, who is smart as his brothers Triangles, decides that is right to give to all the possibility
to win. And during the third and last night modifies the whole path in such a way everyone could win.
Question 4:
Which change can Rectangle do in such a way everyone could win? …
The solving of the questions required from the children to apply acquired knowledge about Eulerian and Semieulerian
graphs. The results were that the students were able to answer to the first question correctly. This was a result that we did not definitely expect because the students were only used to count the degree
of the nodes
– but while working with Eulerian or Semieulerian graphs – they were not used to more than two nodes of odd
degree. Usually, when they identified a graph they could classify, they started to count the degree of nodes until they encountered a node of odd degree which they used as a starting point. The only graphs they had encountered before which were not Eulerian or Semieulerian were the graphs of Fig. 10. And in that case, they had managed those graphs before starting to count the degrees. So, the situation described in question one was unusual.
By the time that they identified that the graph of Fig. 14 neither Eulerian nor Semieulerian, they had already acquired enough knowledge in order to know how to make it Semieulerian. The aim of the task was to build a street. A few children solved the task by deleting an edge so that the two nodes connecting that edge changed their parity. Of course, this was a possible solving strategy and such answers were positively
considered.
Some difficulties arose on question four, even though all students were familiar with the fact that an Eulerian path could start anywhere in the graph. We later identified that a few of them had not understood that the request could have been translated into “make the graph Eulerian” – possibly because question two and three both asked for semieulerianity.
Finally, we conclude – on the basis of the test
results – that the majority of students were able to relate acquired knowledge with the presented task.
Embodiment
with Wool Strings
As a final activity in class, the children created posters
which summarized the main ideas that had arisen during the teaching experiment. One of these deliverables was solely on walkable graphs (see Figs. 9 and 15) and was realized by manipulated real wool strings which were wrapped around split
pins, similar to the online game
Icosien
.
In order to make every child an active part of the activity, the class was divided into three homogeneous teams according to the self-assigned preferences of students, i.e. drawers, writers, and thinkers. In each group, students designed their poster together once the teacher assigned the task to each group. The thinkers then defined the graphs to be used. In the whole, they worked as a team
, but each student had an individual role. At the beginning of the working progress, each student in each group proposed his/her own graph to the others. After that, they decided which one they want to use. The drawers were asked to apply their ability of drawing which resulted in a mixture of experimenting and purposeful
manipulating of the graphs; It was not a mere copy of the thinkers’ graphs. The writers were in charge of the title and subtitles, e.g. in Fig. 15 they decided for “inizio” and “fine” – Italian words for “begin” and “end” respectively. As for the wrapping of the strings, all members of the team were asked to participate because it is important to join mind and body as well as putting the concepts they had studied into practical actions. This requirement did not pose any difficulties; all students were quite eager to participate in this activity.
Final “Fighting” with Parents
In the first year in which we carried out this teaching experiment, their children from the very beginning, especially in regard to the online games, involved the parents. In the second year, the teacher asked the students not reveal “the trick
” of walkable graphs, so that the parents could be invited to the last meeting of the experiment for a “Children vs Parents Contest” based on the online games
. The games that were used for the contest
were Icosien and Strand; and the children clearly won the contest. In fact, it showed that the children had not only practised on Eulaerian and Semieulerian graphs during the teaching experiment, but they also had internalized the underlying definition and reasoning. Further, it showed that the children were very proud to win against their own parents which implemented that they knew something that their parents did not. The parents, on the other side, were proud to see their children so happy and excited about mathematical contents.
Results and Conclusion
This teaching experiment had two major aims
. Firstly, mathematical oriented, we wanted the children to be able to represent relations and data and – in significant situations – use representations to get information. Secondly, emotionally oriented, we wanted the children to be happy when doing mathematics. We will briefly discuss both aspects.
The majority of children were able to master the activities as is shown by the ongoing and final tests. Moreover, in the first lessons, when the basic concept had been introduced, the teacher asked the students to name suitable examples from their everyday life. They were able to identify the model of a graph in many settings, which indicates that they mastered the “Creative Application” ability the of O.B.I.T. model. An example is illustrated in Fig. 16. The figure represents a city, but indeed it can be interpreted as a graph. The children successfully connected the studied topic with the real life situation.
In the ongoing of the teaching experiment, it has clearly shown that the YED artefact, which was used to draw several graphs, was a helpful tool. At the beginning of each activity, objects
were presented by the software as one precise symbol
, e.g. pictures of cartoon characters, letters, cities, persons, etc. The software provided a high variety of symbols and included the possibility to drag each object into the working area so that it could be used as a node
of a graph
. But, whenever a topic had been mastered, the children went on by using standard symbols of nodes – which was usually a dot. They were able to abstract from the real objects and worked on the model rather than on the problem itself; they manipulated not only real objects (e.g. characters, cities, etc.), but also mathematical objects (e.g. graphs). Moreover, they were able to use conceptual metaphors: they inferred properties of a certain source
domain
(i.e. real objects) by manipulating a target domain (i.e. graphs) (Lakoff and Núñez 2001). The software contributed to this transition.
Another feature
of the software – the possibility to drag nodes or change the shape of edges – made children aware of isomorphisms among graphs which look different at first sight. As a matter of fact, they were able to transform a graph without deleting or adding an element, but by simply changing the shape. Not every child was able to grasp this concept by him/herself, but at the end of the teaching experiment – after various manipulations
of graphs on the YED software – they were all convinced that it is possible to preserve mathematical properties in differently looking graphs.
The major disadvantage that we encountered on the use of the software was the English language; but, as we mentioned earlier, the tools that were required for our purposes were self-explanatory so that the Italian translations were not needed.
As for the online games
, we focus on Icosien because it was the most frequently used during the teaching experiment. The wide range of possibilities to freely experiment was highly appreciated by the children, and they eagerly lined up to come to the whiteboard in order to do so. From a teaching and learning point of view, the game is useful because students can experiment by themselves without the constant assistance of a teacher. The game itself restricts actions and signals the end of it. The children are guided without any external
intervention
. Another disadvantage of such a game is that it makes the students primarily focus on the game itself. Their focus of attention was on winning the game, not on the analysis why a certain property is held. Due to this, we used the game to conjecture, but we did not use it to reason or argue. Even though the use of technology has a high variety of advantages, it showed that time as well as pencil-and-paper
activities help students to reason successfully.
From the emotional point of view, students of both schools were enthusiastic to encounter mathematics as we did in our teaching experiment that is without numbers, calculations
, or systematic
operations
, but rich of princesses
, relatives, football players, and real-life situations. They encountered “another mathematics” which was different from what they previously experienced. Somehow, they saw mathematics with the eyes of a mathematician. The students understood mathematics as a game. Indeed, the activities required reaching a target while obeying the “rules
of the game”. On the basis of previous experiences, teachers often focus too much on the application of rules of mathematics instead of making students analyse the origin of such rules. If mathematics could be understood as a game more frequently, students would be more encouraged to think about how to improve the rules on higher levels as well as about strategies that are important in order to achieve your aim: Aside from playing by the rules it is allowed to use creative strategies to win in the most elegant and fastest way.
Young students appreciated the possibility to play with mathematics through online games – even at home. It happened that children insisted on their parents to play with them, and even a grandfather was invited to play. They further enjoyed the possibility to draw their own graphs once they understood how to do so (see Fig. 17).
With reference to the paper-and-pencil activity in the previous section, after the teacher said that the graph f in Fig. 10 was not walkable, Lorenzo, an eight-years-old student, said:
Lorenzo:
Then graph g is not walkable either; they are the same!
This showed that the student was able to identify the model underneath the drawings without any guiding explanation of the teacher.
Technology had a fundamental part in this teaching experiment. As mentioned before, we used “old technology
” (e.g. pencils, paper, blackboard, and chalks) to reason and to fully understand, but the application of “new technology” was very useful in the practical part because it made children independent. This was also previously discussed on Icosien. There, the students constructed different graphs without the assistance of the teacher, and they continued to work independently at home – with the online games and with YED. The possibility to drag nodes and/or change shapes to edges made the manipulation
of graphs
easier; otherwise, one would have been obliged to continuously redraw each representation of the same graph. Moreover, by transforming the graph instead of redrawing it, the students identified that the features of a graph do not change by the mere alteration of its representation.
In addition
to observing the students, other teachers of the students have been interviewed. They noticed that the children’s logical skills increased as well as their active participation in class. They posed questions more frequently instead of passive
listening
. So, the students learnt to learn, and they transferred this new skill to their whole learning process.
What was difficult was the argumentation activity. The students were much more interested in experimenting and learning new “tricks” rather than in reasoning on possible explanations. But when they were actively engaged into the discussion
and invited to participate actively instead of mere listening, this helped them to concentrate on the topic
.
In the second year of my teaching experiment, my tutor – a primary school teacher – took notes at each of my lectures
and then organized meetings with other primary school math teachers to share materials
and ideas for possible future math sessions. It showed that this teaching experiment was highly appreciated by teachers because primary school teachers – but also high-school teachers – are not familiar with the underlying aspects of graph theory. Further, they appreciated the idea that graphs can be used to model problems from real life situations, to represent relations, to mathematize situations. Additionally, the teachers who took part to these meetings had the opportunity
to address questions about innovative teaching/learning processes of mathematics.
Finally, this chapter ends on comments written by children in the final satisfaction
questionnaire
: “I think that graphs are more funny than games”, “I think that this laboratory
on graphs helped me to reason more quickly”, “Mathematics is beautiful, intriguing
and is of help”.
Notes
1.
Activities written in bold are those we are analyzing within this chapter.
References
Aleo, M. A., Ferrarello, D., Inturri, A., Jacona, D., Mammana, M. F., Margarone, D., Micale, B., Pennisi, M., & Pappalardo, V. (2009). Guardiamo il mondo con i grafi. Catania: La Tecnica della Scuola.
Di Martino, P. (2007). L’atteggiamento verso la matematica: Alcune riflessioni sul tema. L’Insegnamento della Matematica e delle Scienze integrate, 30(6), 651–666.
diSessa, A., Hammer, D., Sherin, B., & Kolpakowski, T. (1991). Inventing graphing: Meta-representational expertise in children. The Journal of Mathematical Behavior, 10(2), 117–160.
Mammana, M. F., & Milone, C. (2009a). I grafi: Un percorso possible (parte prima). L’Insegnamento della Matematica e delle Scienze Integrate, 32(2), 109–132.
Mammana, M. F., & Milone, C. (2009b). I grafi: Un percorso possible (parte seconda). L’Insegnamento della Matematica e delle Scienze Integrate, 32(4), 427–440.
Laboratoire de recherche : S2HEP, EducTice - InstitutFrançais de l’Éducation - École Normale Supérieure de Lyon, Lyon, France
Gilles Aldon
Département de mathématiques (GROUTEAM), Université du Québec à Montréal, Montréal, Québec, Canada
Fernando Hitt
Dipartimento di Matematica, Università degli Studi di Torino, Torino, Italy
Luciana Bazzini
Fachbereich Erziehungswissenschaft und Psychologie, Freie Universität Berlin, Berlin, Germany
Uwe Gellert
Appendix
Appendix
This appendix provides a short glossary of those concepts in graph theory we dealt with in the chapter and a collection of some activities we carried out with the children.
Short Glossary of Graph Theory
Bipartite graphs: a graph G = (N, E) is said bipartite if it is possible to divide the set N into two subsets N1 and N2, in such a way that every edge in E joins a node in N1 with a node in N2.
Coloring of a graph: a colouring of a graph is a function from the set of nodes to a set of colours, that assigns a colour to every node in such a way that connected nodes have different colours.
Complete graph: a graph is complete if every couple of nodes is connected by an edge. A complete graph with n nodes is indicated by Kn.
A bipartite graph with bipartition sets N1 and N2 is said complete bipartite if every node in N1 is connected to every node in N2. A complete bipartite graph with m nodes in N1 and n nodes in N2 is indicated by Km,n.
Cycle: a cycle is a path that is closed. Moreover, the starting node is the only node repeated in the path (repeated as the ending node). For instance, in the graph G = (N, E) with N = {1, 2, 3, 4, 5} and E = {(1,2), (1,3), (2,3), (2,4), (3,4), (3, 5), (4,5)}, the path C = [(1,2), (2,3), (3,1)] is a cycle, while the path P = [(1,2), (2,3), (3,5), (5,4), (4,3), (3,1)] is not a cycle because not only node 1 is repeated, but also node 3.
Degree of a node: the degree of a node in a graph is the number of edges involving the node.
Eulerian and Semieulerian graph: a graph is called Eulerian if there is a closed path containing every edge of the graph just once. (An Eulerian graph has all the nodes with even degree). A graph is called Semieulerian if there is an open path containing every edge of the graph just once (a Semieulerian graph has exactly two nodes with odd degree).
Graph: A Graph G = (N, E) consists of two sets, N and E. N is called the set of nodes, and its elements are represented by points. E is a set of couples of nodes, called edges. If two nodes are a couple in E, then the two points representing the two nodes in the edge are joined by a line. Whenever the couples are sorted, the graph is said “directed”, otherwise it is said “undirected”. When we say just graph, without specifying directed or undirected, we implicitly mean undirected.
Two nodes A and B can be connected by one edge, in this case we indicate the edge with (A, B), or by two or more edges, in this case we indicate the edges with s1=(A,B), s2=(A,B), …. Edges connecting the same couple of nodes are called multiple edges, and a graph with multiple edges is said multigraph.
Hamiltonian graph: a graph is called Hamiltonian if there is a cycle involving all the nodes (it is not requested that this cycle involves all the edges). This cycle is called Hamiltonian cycle.
Loop: a loop is an edge connecting a node with itself.
Path: a path in a graph G = (N, E) is a sequence of consecutive edges, for instance if we have N = {1, 2, 3, 4, 5} and E = {(1,2), (1,3), (2,3), (2,4), (3,4), (3, 5), (4,5)}, a path could be P = [(1,2), (2,4), (4,3)]. A path is said open if the first node of the first edge in the path (starting node) is different by the last node of the last edge in the path (ending node), closed otherwise.
Planar graph: a graph is planar if it can be drawn in a plane without graph edges crossing, i.e. if it can be drawn in such a way an edge can touch another edge just in the common node.
Tree: a tree is a graph without cycles and connected, where a graph is connected if there is always a path between any two nodes.
Some Activities on Graph Theory in Primary School
Activity on Hamiltonian Graphs (We Called Hamiltonian Graphs “Visitable”) Violetta’s Tour
How can we help Violetta (a pop singer very popular among children) to adjust the trip of her Italian tour in such a way that she stays in every city she planned to visit just once? This problem is connected to reality, not only because the cities are the real stops of Violetta’s tour in 2014, but also because we checked for flights between the cities in question (but, for the sake of simplicity, only with just one airline,). The children constructed the graph in Fig. 18 without difficulty by connecting cities joined by a flight.
Fig. 18
Hamiltonian graph to represent a tour (made with YED)
The use of the software was irreplaceable. Even when the graphs are simple, with just a low number of nodes – like the previous one – the same activity is much more difficult to be carried out with paper-and-pencil. In fact, the students made first attempts in their exercise books by drawing several cases or by colouring used edges, but this was unsuccessful. As soon as they came to the whiteboard and could drag nodes digitally, the task could be resolved easily. Additionally, several Hamiltonian graphs were explored by means of the online game Icosien. But the students met difficulties in finding Hamiltonian paths because they did not have any strategy to follow.
Activities on Planar Graphs
As for planar graphs, we applied the well-known three cottages problem (another unsolvable problem, after the “seven bridges” impossible path): there are three cottages and three utilities, each cottage has to be connected to each utility, but we want to draw connections in such a way that they intersect just in utilities and cottages.
The children started by constructing the requested bipartite graph in their exercise books: they drew the six nodes in two separated lines, as they were used to due to the Disney’s princesses graph. Then, they started to draw the edges from cottages to utilities one by one, avoiding making them touch. All students were successful up to the fifth edge, but they failed at the sixth edge because the problem is not solvable. Then, a few children tried to solve the task at the whiteboard. This time, the edges were already drawn – by the teacher – and the students dragged the nodes, unsuccessfully of course. After that, a modified version of the problem – simplified with three cottages and two utilities – was posed and solved very soon.
This problem was useful to introduce complete graphs with n nodes, named Kn and complete bipartite graphs with n and m nodes in the two sets of nodes, named Kn,m. The children were asked to analyse complete graphs and were guided to discover the “trick” of triangulations when they have a K4 inside a graph as shown in Fig. 19.
Fig. 19
A planar graph containing a subgraph K4 (made with YED)
The “triangulation trick” was often used in the games at school (as fly tangle, see paragraph “Technologies”) and in the home-made games which consisted of adjusting planar random graphs produced by the YED software. The students were guided to discover that for K5 – and higher – complete graphs are not planar and so are graphs containing not planar graphs. Similarly, they easily grasped that complete bipartite graphs are planar until K2,3 They tried this with the K3,3 of the cottages problem and hence found an easy solution for K2,3.
Ferrarello, D. (2017). Graphs in Primary School: Playing with Technology.
In: Aldon, G., Hitt, F., Bazzini, L., Gellert, U. (eds) Mathematics and Technology. Advances in Mathematics Education. Springer, Cham. https://doi.org/10.1007/978-3-319-51380-5_8