
Abstract
Product data of long-living and complex systems is essential for efficient through-life engineering services (TES), since it is the basis for systematic planning, operation and documentation activities. The product structure represents the data backbone and carries geometrical, technological and system relevant information. Product Lifecycle Management (PLM) systems are used to maintain the product data and to track product changes. However, in the maintenance, repair and overhaul (MRO) sector lifecycle based documentation of changes regarding product configuration, condition and functionality is still a weak spot, especially if the MRO service provider is not the original manufacturer. In such cases MRO processes start with an exhaustive product diagnosis to identify parts that have to be maintained or to determine if spare parts are needed to guarantee product’s performance. Existing 3D scanning and data processing methods have to be improved to acquire structured product data in an efficient process. This chapter presents a method for automated derivation of product structures from 3D assembly models and its application in various scenarios of through-life engineering services. The input may be a system model coming from a 3D scanning process. In order to identify spatial relations between parts a 2D contact graph is automatically created by a neighborhood analysis. Subsequently related parts are hierarchically structured into sub-assemblies by a cluster analysis. Iterative use of these two principles results in the complete product structure. Results can be exported via a XML interface for use in PLM systems.
Access provided by CONRICYT-eBooks. Download chapter PDF
Keywords
- Product Structure
- Building Information Modelling
- Product Service System
- Product Lifecycle Management
- Contact Graph
These keywords were added by machine and not by the authors. This process is experimental and the keywords may be updated as the learning algorithm improves.
1 Introduction—Structured Product Data and Its Remodelling
The method proposed in this chapter addresses an issue which is not predominant in the domain of through-life engineering services. For a general understanding this introductory section will answer to questions to the reader:
-
1.
What is structured product data?
-
2.
How is product data structured?
1.1 What Is Structured Product Data?
During the product creation process using computer aided design (CAD) and engineering (CAE) methods various data is created in order to build models of the emerging product. These models evolve in an evolutionary process from merely text based descriptions of requirements up to highly functional virtual models of the system. Advanced design methods are not only able to produce geometrical models of the system, but to build “digital twins”, which mirror the behaviour of the system into the virtual world before it even came to existence in reality. Virtual product models require the incorporation of a high number of different data elements [1]. The sum of this entire product related data is here referred to as “product data”. The product does not remain in a static after its definition in design. The production process may result in variations, during its use the product may be altered and service activities may include modifications. In an ideal situation (Fig. 9.1) this evolution of the product throughout its lifecycle is mirrored in the corresponding product data, foremost the model and bill of material (BOM) representing the current state of the product. Of course this ideal situation is not always met in industrial practice.

Ideal situation for availability of product data throughout the product lifecycle
1.2 How Is Product Data Structured?
In order to store, manage and retrieve the product data it is commonly structured in relational databases. The product data structure—commonly shortened to “product structure”—can be, but does not have to be similar to the building structure of assemblies, subassemblies and parts of the physical system. Structuring elements can also be stages of production processes or functional units. The favored approach is dependent on the primary stakeholder of the structured product data [2]. For the initial generation of the product structure in design the two major rivalling perspectives are those of engineering and manufacturing. Whereas designers prefer assembly or functional oriented structures as this complies with their thinking about products, manufacturers favor structures mirroring the production process. As other stakeholders in later lifecycle phases—e.g. MRO and other services—have divergent requirements, the use of different product structures for the same system throughout its lifecycle is common. Workload for creation, conversion, updating and linking of these product structures cumulates in a substantial matter of expense.
Definition of product structures in PLM systems is a manual task if it cannot be retrieved from an assembly structure in a linked CAD system. Large corporations require departments of “structure managers” for product structure generation and management. They perform an extensive, highly manual process, sometimes totally separating engineers from the PLM environment:
-
Single part files have to be coded following a company specific naming and structuring convention as part of an internal enterprise information standard. This is done by creation of PLM structure templates which include main structure nodes representing sub-assemblies and related parts. These templates are generic, but for each product it has to be decided which nodes are used.
-
CAD models in order to be processed have to be saved in a proprietary file format with a specific title and ID according to the structure template.
-
Afterwards all CAD files are imported into the PLM system.
-
For high-performance visualization additional files such as JT formats have to be created from the proprietary files and stored with the correct data set.
This highly manual process is of course both error-prone and resources-intensive.
1.3 What Is Remodelling?
“Remodelling” in this context is meant to describe the retroactive recreation of a virtual product model from the physical system.
The term has been chosen in order to enable differentiation from methods of reverse engineering, with their negative connotation due to links to intellectual property violations. It is not purpose of remodelling to recreate a physical clone of the product. The virtual product model created by remodelling is used to enable activities supporting the original product.
Today comprehensive knowledge on the respective product is needed to manually model a proper product structure in order to provide structured product data for through-life engineering services [3]. Automatic identification of product structures for 3D product models currently requires the availability of assembly structure as defined in the authoring CAD system. For long-life systems and third party service contractors this knowledge and data is usually not available.
Most research on reverse engineering is focused on recognition of surfaces rather than on entire systems and their structures. Approaches are based on basic shapes like spheres, cylinders, cuboids [4] or other features and constraints [5]. Segmentation methods are used to detect edges and surfaces [6, 7], not assemblies and their parts. In the construction domain the retrieval of single object information is pursued in order to create unstructured component lists [8, 9] by Building Information Modelling (BIM) applications used for reconstruction of large scale infrastructure. Despite attempts for semi-automated features for reverse engineering the high effort still poses an barrier for wide spread application [10–12].
Primal result of 3D scanning methods is a cloud of data points which include x-, y-, z-information as well as a normal direction. Such a point cloud is then transformed to a mesh or polygon surface. The meshing commonly requires post-processing as shiny or concave surfaces result in incomplete meshes and artefacts. For the further processing and modification in CAD systems surface reconstruction is necessary, resulting in Non-Uniform Rational B-Spline (NURBS) surfaces.
The remodelling process to create assembly models consisting of separate parts contains the following steps:
-
1.
3D scan of the complete assembly,
-
2.
3D scans of each single disassembled part,
-
3.
3D polygon models of the parts are referenced to the initial assembly scan
(requires reference markers on the object’s surface).
For the additional creation of CAD assembly models the single part’s 3D polygon models have to be converted to surface models. These CAD parts are manually assembled in a CAD tool. More details on an enhanced process for automated reverse engineering of assembly models are described by [13].
2 Motivation—Need and Availability of Structured Product Data in Through-Life Engineering Services
After the introduction of structured product data as the subject matter, this section will answer the two following questions in order to explain its relevance for through-life engineering services:
-
1.
Why do through-life engineering services need structured product data?
-
2.
Why does the product data have to be remodelled?
2.1 Why Do Through-Life Engineering Services Need Structured Product Data?
Through-life engineering services benefit largely if structured product data is available and the product data structure can be employed for the structured storage of data created within these activities:
-
Inspection and planning
Assessing degradation of a component in service using non-destructive evaluation techniques and automating the assessment process are two major trends in maintenance [14]. An as-designed model of the system can be consulted as reference for analysis of changes of the system throughout its lifecycle. This deviation analyses can even be automated, if an as-used model is created by methods of 3D scanning. In case the as-designed model is not at hand, it can either be automatically searched in a database by the created as-used model, or the latter can be used to recreate the as-designed model, for example by statistical analysis of a great number of identical used parts, e.g. turbine blades.
-
Repair, overhaul and replacement of parts
van Houten et al. [15] identified the product data model to support model based maintenance planning. The aforementioned deviation analysis will allow defining repair and overhaul measures. In case the damaged part has to be replaced, reproduction of spare parts not in stock and for which no as-designed model exists will be enabled by the created models. In common practice the parts are “re-designed” manually, which is time consuming and error prone.
-
Monitoring and documentation
Throughout its lifecycle further product related data is created, describing either the status of the product itself or accompanying processes involving the product. Such lifecycle information can be quality data from the production process, changes in hard- or software configuration or reports on through-life engineering services. Managing lifecycle data is essential for an integrated maintenance planning capability [16]. Storage and access to such data is supported by linking it to product structures.
2.2 Why Does the Product Data Have to Be Remodelled?
In today’s industrial practice the structured product data as created during the design process is often not transferred and employed in later stages of the product lifecycle. As well lifecycle based documentation of changes regarding product configuration, condition and functionality is still an unsolved problem for holistic product lifecycle management approaches [17]. Common barriers are organizational structures within or between companies, the use of segregated IT systems and data incompatibility, particularly problematic for long-life systems.
In traditional hardware-sales-driven business models the designing and producing companies are not closely involved in the operation and service of their products. Operators and third party service provider on the other hand do not have access to the original product data. Even if the product lifecycle lies within the hands of one company, isolated departmental structures can have similar effects.
The different roles allocated to the product lifecycle in Fig. 9.2 are not mutually exclusive inherited by separate players, but also one role may be split up among several players. Numerous constellations can be found, e.g.:

Roles and access to product data throughout the product lifecycle
-
Design and manufacturing may be distributed among several tiers of suppliers.
-
Nevertheless design and manufacturing are often controlled by one OEM, with more or less portions of both being outsourced.
-
This OEM may even stay owner and operator of the product, while the user is a customer.
-
Many OEMs also act as service providers, for maintenance or in context of product service systems.
-
But then again the user may also take care of operation and maintenance by himself, or employ a third party service provider.
Depending on the constellation of players and their business relations, reality of product data availability may vary vastly from the ideal situation.
Aside from the organizational barriers the use of isolated or sparsely related IT systems is the major reason for discontinuity in data flow throughout the product lifecycle. PLM-Systems thrive to cover the entire product lifecycle and have over the last years incorporated many additional features supporting activities traditionally solved by independent software tools. Thoroughly permeation of the product lifecycle nevertheless is still to come. Companies fear the vulnerability of monolithic IT solutions and the dependency on their vendors. Existing landscapes of diverse IT systems are robust and any changes are risky.
The situation of data availability in many cases is unsatisfactory, as there are many TES actives which would largely benefit from the availability of structured product data. Efficient data reconstruction or retrieval strategies are needed [13].
3 Method—Remodelling of Structured Product Data
The developed method for automated generation of product structures is a two-step procedure.
- Step 1: :
-
Identification of spatial relations between parts by neighborhood analysis using contact graphs
A graph \({\mathbf{G}}\) is an abstract datatype which represents a structure. It consists of a finite set of vertices (or nodes) \({\text{V}}\) and edges \({\text{E}}\). Additionally, it is possible to assign attributes \(\upeta\) to edges and \(v\) to vertices given a node label alphabet \(L_{v}\) and an edge label alphabet \(L_{e}\) [18].
Applied to product structures, vertices represent parts of the product while an edge represents a direct spatial contact between two parts. The relations between the parts are saved in an adjacency matrix or list. In a basic form the attributes of a vertex only consist of its name and an ID for internal processing. The undirected edges of the graph own no attributes; this means the only information contained is the existence of a connection between two parts.
The contact graph is created by analysing the neighborhood of the parts of a product in its 3D model. Geometric 3D models can be represented in various formats. It is important to consider the possible input formats before deciding about a transformation method. This method uses tessellated surface models as input data, which requires the complete transformation of the point cloud generated via scanning into a global coordinate system. Goal of the neighborhood analysis is to identify all possible spatial contacts between the product parts. In order to reduce computing time by avoiding superfluous comparisons of triangles the method uses a three-stage neighborhood analysis.
The first two stages on component and mesh level as shown in Fig. 9.3 are based on the highly simplified axis alignment comparison of bounding boxes, which reduces the computation time significantly. The last stage consists of tri-tri Möller intersection tests of two triangles at a time [19]. The procedure starts with assigning bounding volumes to each part of the product. If they possess no intersection there is no contact edge between these parts and the analysis can turn to other parts. If they intersect, the level of detail is increased for the analysis of this segment. Now the bounding volume intersection test is repeated on the mesh level. This means, bounding volumes are assigned to every triangle of the two considered parts and mutually tested for intersection. If each intersection test is negative there is once again no edge between these parts. If there is an intersection a detailed tri-tri Möller algorithm is applied to these two triangles for verification of the contact.

Three stage intersection test method for neighborhood analysis
- Step 2: :
-
Hierarchical structuring of related parts by cluster analysis
In the second step the derived contact graph is subject to a cluster analysis. By applying a cluster algorithm to the graph it is possible to divide it in several subsections. In order to build a product structure with more than one level it is necessary to apply a cascading sequence of clustering steps in a top-down process (Fig. 9.4).

Top-down process for product structuring by cluster analysis
Graph theory provides different algorithm for clustering. Based on the assumption that assemblies as the structural groups of a product structure are well-separated modules with sparse connection between each other, the Girvan-Newman algorithm was selected. This algorithm has been developed for identification of community structures in social and biological networks. It is based on the “edge betweenness” which is calculated for every edge of the created graph.
Edge Betweenness is a measure of an edge’s centrality in a network. It is equal to the number of shortest paths from all vertices to all others that pass through that edge. A high value of edge betweenness is an indicator for connecting edges between two communities.
The edge betweenness is calculated by the sum of shortest paths between pairs of vertices that run through the edge. The communities are formed by progressively deleting the edges with the highest betweenness value and recalculating the betweenness values. The stop mechanism can be set by a betweenness-threshold or a minimum number of communities [20]. This cluster analysis is resulting in a single graph only. To build a product structure with hierarchical levels it is indispensable to repeat the cluster analysis on every node of the future product structure. A manual check for correctness to enable potentially needed modifications is recommended after each cluster analysis. For example very small gaps between parts may mistakenly result in a contact area if the product model was created by 3D scannig.
The top down procedure of structuring the product hierarchically (Fig. 9.5) starts with the root node of a product structure which represents the entire system. Afterwards, those clusters are selected which require further subdivision.

Hierarchical structuring of related parts by cluster analysis
4 Application—Implementation and Use Cases
For its application the method has been implemented in a software prototype, which consists of five functional elements:
-
1.
STL Importer: Parsing of single part STL files.
-
2.
Neighborhood Analyser: Creation of contact graph from imported STL files.
-
3.
GN-Cluster Analyser: Division of selected graphs into subgraphs.
-
4.
Graphical User Interface:
-
3D visualization for manual group selection and corrective actions,
-
product structure display with highlighted selected structure knots via 3D visualization,
-
drag and drop feature for manual manipulation of product structures.
-
-
5.
PLMXML Exporter: Enables combined and comfortable import of the derived product structure and the STL files in a PDM system (Fig. 9.6)
Fig. 9.6 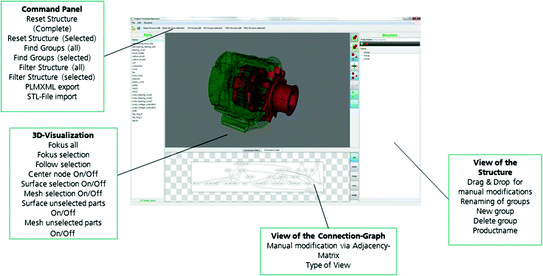
GUI of the software prototype

As outlined in the motivational section, there are various constellations of both required and available product data. If there is no product data available at all, the processes of recreating those are much more elaborate, since the as-designed model has to be derived from the current system status. If service providers can access at least as-designed models of the product, this will help to accelerate proceedings substantially.
4.1 Use Case 1: Remodelling of As-Used Systems
The major use case for the developed method is the creation of virtual as-used models of the system as input for various through-life engineering services. The 3D scanning of defective systems enables detection of deviations between as-used and as-design conditions. If as-designed models are not available they can be recreated based on the digitized as-used system. When relevant deviations are found the digitized as-used system model can be employed in the following for the definition of repair measures or spare part production. As defective systems are rarely isolated components, structuring of the digitized system is necessary. The ability to generate structured models by 3D scanning systems without prior disassembly is highly favorable in terms of downtime reduction [13].
Step 1—Neighborhood analysis using contact graphs—is demonstrated by application of the method to a 3D scanned car alternator (Fig. 9.7).

3D model of a car alternator generated from 3D scan data (1. Pulley, 2. Fan, 3. Rotor, 4. Inductor, 5. Housing)
The parts have been optically 3D scanned separately and automatically matched in a scan of the assembly by a best-fit algorithm. The prepared STL files of the referenced parts are imported and analysed in the software prototype, resulting in adjacency matrix (Table 9.1).
The connections have been analysed correctly, except for the connection between rotor and inductor. The misleadingly identified connection between these parts resulted from a very small gap in the 3D model between these parts which implies high demands on the referencing process.
4.2 Use Case 2: Structuring of 3D CAD Models for Deviation Analysis
Structuring of given 3D CAD models is necessary when an as-used model generated by 3D scanning has to be compared with the related as-designed model. A software supported comparative analysis of product models requires identical product structures. By application of the proposed method identical structures can be generated for both the original and the scanned model.
Demonstrated on the as-designed model of the introduced car alternator—imported as 25 separate tessellated STL files—the part’s neighborhood could be detected without errors in the first step. When applied to the root node in the second step, the clustering algorithm automatically allocated the first level of the product structure in three different groups. The first and second clusters are defined by the static parts grouped respectively to the two-parted-housing. The third group is characterized by the rotating parts of the alternator, which is subjected to a repetition of the procedure in order to validate the generation of a multi-level product structure. The algorithm separated the coil and its holders from the rest of the group. The entire structure as shown in Fig. 9.8 was created without manual post-editing.

Structured as-designed model of car alternator
4.3 Use Case 3: Restructuring of Product Data for Deviation Analysis
A special variant of the aforementioned use case is a situation with an existing model coming with a given product structure in a PLM system. Unless the given structure has been generated analogue to the clustering algorithm in the first place a restructuring of the product data is prerequisite for the model-based failure detection in MRO processes. This use case is demonstrated by the clustering of a fuel system. The as-designed model and its product structure were provided by an automotive manufacturer. The model consists of 37 parts which should be clustered in three groups as shown in Fig. 9.9.

Target groups for clustering of a fuel system
As the algorithm is not able to identify the structural unconnected small parts (joining elements), the parts of this group were excluded from the analysis. Thus, only the fuel tank assembly and the tank pipe assembly had to be found. The algorithm created three clusters. The two assemblies were clustered correctly, except for one part each, which has been assigned to the wrong assembly respectively. The third cluster contained only a single part, which should have been included in the tank pipe assembly.
More details of the tests run on the software prototype related to the three described use cases have been described in [3].
5 Conclusions and Outlook
Concluding on the current status of the method and the options for further development two questions have to be answered:
-
1.
What is left to do?
-
2.
What are the future prospects?
5.1 What Is Left to Do?
5.1.1 Further Automation for Industrial Application
The neighborhood analysis works error-free, as long as the imported model is error-free as well. Thus, if the 3D assembly model is derived from a 3D scanning process the results have to be precise and reliable to avoid manual corrections. The multi-step process as implemented in the prototype contains some need for human interference as well. The top-down process is a possible way to create a multilevel product structure. This process relies on a manual selection for further clustering. An industrial application of the method would call for a further automation of the process in order to increase the efficiency and reduce the potential for failures in the operation.
5.1.2 Up-Scaling to High Complexity Systems
The method has been validated by a prototypical implementation, which was successfully applied in various use cases. These test cases have been sufficient for the evaluation but do not inherit the complexity of many technical systems subject to through-life engineering services. The large scale evaluation on highly complex system will lead to further development of the method.
5.2 What Are the Future Prospects?
5.2.1 Closing the Gaps in Product Lifecycle Management
The term Product Lifecycle Management (PLM) is meant to express the continuous support of a products lifecycle with its related processes, information and data [21]. Although the term PLM is widely used both by software vendors and their customers in industry, PLM-systems are often primarily used for team data management (TDM), restricted to the management of geometrical models within the design department. The ability to close gaps in the data flow throughout the product lifecycle by the developed method could be a chance to foster the dissemination of the PLM approach.
5.2.2 Digital Twins for Continuous and Smart Maintenance
Digitalization of products and their production processes is the dominant technological trend in the second decade of the 21st century. Technological developments such as Internet of things, Cyber Physical Systems, Smart Products and the Industrial Internet or Industry 4.0 are building blocks of an interconnected world of technical systems. In order to create and operate these systems digital twins are required, enabling a paradigm shift in our ability to better understand the health of a product and plan maintenance based on the availability of significantly large volume of data [14]. Therefor the role of virtual product models will increase, predictably spreading their use over the entire product lifecycle. The inevitable integration of existing long-life systems into this connected world and the application of smart maintenance methods to them will require the remodelling of structured product data.
5.2.3 Big Data Analytics for Structured Product Data
The developed method is not limited to the presented applications within through-life engineering services. An interesting future area of application could be a comparison of products by means of pattern matching between two contact graphs. This could enable fast query search of structural related products in big data stocks. As the algorithms employed in the method lead to reproducible results, the method could be applied to systematically create original product structures from CAD data, in order to eliminate human-induced variations in product structures. The same principle could be applied to restructure product in order to achieve comparability. An application for this approach could be a metadata independent product variant analysis, e.g. in order to reduce repetitive design of redundant components. The large scale data analysis would be enhanced by the facilitation of data exchange between prior incompatible software systems or structure conventions by provision of a platform independent template structure in the PLMXML format.
References
Stark R et al (2010) Competing in engineering design—the role of virtual product creation. CIRP J Manuf Sci Technol 3(3):175–184. http://www.sciencedirect.com/science/article/pii/S1755581710000854
Eigner M, Stelzer R (2009) Product lifecycle management: Ein Leitfaden für product development und life cycle management, 2nd edn. Springer
Stark R, Grosser H, Müller P (2013) Product analysis automation for digital MRO based on intelligent 3D data acquisition. CIRP Ann Manuf Technol 62(1):123–126
Wang J, Gu D, Yu Z, Tan C, Zhou L (2012) A framework for 3D model reconstruction in reverse engineering. Comput Ind Eng 63(4):1189–1200
Kang L, Li Y, Chen ZM (2012) An integrated reverse modeling approach based on reconstruction of features and constraints. AMM 215–216:639–642
Ma T-C et al (2012) Features detection from industrial noisy 3D CT data for reverse engineering. In: Lee R (ed) Studies in computational intelligence, software and network engineering. Springer, Berlin, pp 89–101
Digne J, Morel J-M, Mehdi-Souzani C, Lartigue C (2012) Mesh segmentation and model extraction. In: Hutchison D, Kanade T, Kittler J, Kleinberg JM, Mattern F, Mitchell JC, Naor M, Nierstrasz O, Pandu Rangan C, Steffen B, Sudan M, Terzopoulos D, Tygar D, Vardi MY, Weikum G, Boissonnat J-D, Chenin P, Cohen A, Gout C, Lyche T, Mazure M-L, Schumaker L (eds) Lecture notes in computer science, curves and surfaces. Springer, Berlin, pp 236–252
Oreni D, Brumana R, Cuca B (2012) Towards a methodology for 3D content models: the reconstruction of ancient vaults for maintenance and structural behaviour in the logic of BIM management. In: 2012 18th international conference on virtual systems and multimedia (VSMM), pp 475–482
Ehm M, Hesse C (2014) 3D-Laserscanning zur Erfassung von Gebäuden—Building information modeling (BIM). Bautechnik 91(4):243–250
Yoon S, Jung J, Heo J (2015) Practical implementation of semi-automated as-built BIM creation for complex indoor environments. Int Arch Photogramm Remote Sens Spatial Inf Sci XL-4/W5:143–146
Hidaka N, Michikawa T, Yabuki N, Fukuda T, Motamedi A (2015) Creating product models from point cloud of civil structures based on geometric similarity. Int Arch Photogramm Remote Sens Spatial Inf Sci XL-4/W5:137–141
Barazzetti L et al (2015) BIM from laser clouds and finite element analysis: combining structural analysis and geometric complexity. Int Arch Photogramm Remote Sens Spatial Inf Sci XL-5/W4:345–350
Grosser H, Stark R (2014) Advanced 3D scan data analysis for performant reengineering maintenance processes. In: Farinha JT, Galar D (eds) Proceedings of maintenance performance measurement and management (MPMM) conference 2014. Imprensa da Universidade de Coimbra, pp 73–80
Roy R, Stark R, Tracht K, Takata S, Mori M (2016) Continuous maintenance and the future—foundations and technological challenges. CIRP Ann Manuf Technol 65(2):667–688
van Houten FJAM, Tomiyama T, Salomons OW (1998) Product modelling for model-based maintenance. CIRP Ann Manuf Technol 47(1):123–128. http://www.sciencedirect.com/science/article/pii/S0007850607628005
Ni J, Jin X (2012) Decision support systems for effective maintenance operations. CIRP Ann Manuf Technol 61(1):411–414. http://www.sciencedirect.com/science/article/pii/S0007850612000674
Stark R, Grosser H, Beckmann-Dobrev B, Kind S (2014) Advanced technologies in life cycle engineering. Procedia CIRP 22:3–14
Cook DJ, Holder LB (eds) (2007) Mining graph data. Wiley-Interscience, Hoboken, NJ
Möller T (1997) A fast triangle-triangle intersection test. J Graph Tools 2(2):25–30
Girvan M, Newman MEJ (2002) Community structure in social and biological networks. Proc Natl Acad Sci 99(12):7821–7826
Stark R et al (2011) Virtuelle Produktentstehung in der Automobilindustrie. Informatik Spektrum 34(1):20–28
Author information
Authors and Affiliations
Corresponding author
Editor information
Editors and Affiliations
Rights and permissions
Copyright information
© 2017 Springer International Publishing AG
About this chapter
Cite this chapter
Adolphy, S., Grosser, H., Stark, R. (2017). Remodelling of Structured Product Data for Through-Life Engineering Services. In: Redding, L., Roy, R., Shaw, A. (eds) Advances in Through-life Engineering Services. Decision Engineering. Springer, Cham. https://doi.org/10.1007/978-3-319-49938-3_9
Download citation
DOI: https://doi.org/10.1007/978-3-319-49938-3_9
Published:
Publisher Name: Springer, Cham
Print ISBN: 978-3-319-49937-6
Online ISBN: 978-3-319-49938-3
eBook Packages: EngineeringEngineering (R0)