
Abstract
Traffic control is one of the biggest problems faced by the surveillance department in every country. Manual surveillance supported by well-defined rules and effective equipment is a common solution to this problem. But, often traffic personnel fail to isolate and recognize the number plate and hence to penalize the owner of the vehicle who violated the traffic rules due to the speeding vehicle and mounting of number plates at arbitrary parts of the vehicle. Hence, his inability renders the traffic surveillance a challenging research area. The automatic vehicle number plate recognition system provides one of the solutions to this problem but constrained by various limitations. The most challenging aspect is to detect the number plates itself present in an image. The presence of multiple vehicle number plates and cluttered background makes our work different from earlier approaches. A single step process may not be able to detect all the number plates in an image, hence we propose Hierarchical Filtering (HF) approach which employs several transformation functions on the input image. The proposed HF models the characteristics of vehicle number plates and label them by fitting the Logistic Regression model. The proposed method is able to detect all the number plates present in an image but at the expense of some non-number plate regions in the form of a minimum bounding rectangle. The proposed model is tested on a wide range of inputs, and the results are profiled in terms of precision and recall measures.
Access provided by Autonomous University of Puebla. Download conference paper PDF
Keywords
These keywords were added by machine and not by the authors. This process is experimental and the keywords may be updated as the learning algorithm improves.
1 Introduction
Population growth, the rise in living standard, an increase in the number of cars in a family, the cheaper rate of investment or loans on cars, etc., increases the number of vehicles and its users. Thus, managing traffic and tracking of vehicles is a troublesome task and utmost important to deal with. The image-processing technique is used to identify vehicles by their vehicle number plate. Number plate detection is considered as the most crucial stage in the number plate recognition system. For detecting different shapes under cluttered background [1], the black and white image is considered. There are many algorithms for detecting number plates, such as edge detection [2], corner detection, template matching [3], histogram analysis, morphological operations, threshold based techniques [4], wavelet transformation method [5], coarse-to-fine strategy [6] and color based approaches [5]. But, all these approaches are constrained by various factors. This paper proposes a method of detecting multiple number plates from cluttered scenes in various environmental conditions.
Automatic Vehicle Identification (AVI) system has a camera monitoring the roads and captures video. The study confines to segmentation process, region discovery, and region labeling in a hierarchical manner. Since the objective of this study is to detect multiple vehicle number plate from an image having cluttered background so, the domain knowledge pertains to vehicle number plate and its characteristics which are provided in Sect. 2. The captured frames i.e. image is subjected to image analysis for identifying particular rectangles which represent the number plate. The process of hierarchical filtering of rectangles is discussed in Sect. 3. Identified rectangles are then labeled using Logistic Regression (LR) modeling. This LR classifier is built based on a training & testing set which is discussed in Sect. 4. Section 5 discusses the results of experimentation on several images in traffic prone area. Observations are provided in Sect. 6, and it also concludes the study.
2 Vehicle Number Plate Characteristics
There are two types of standard vehicle number plates available, as shown in Fig. 1(a), (b), (c) and (d). The format of the standard number plate is described in Fig. 2.

Types of number plates (Color figure online)

Standard vehicle plate format
-
1.
Country Code
-
2.
State Code
-
3.
District code
-
4.
Type of Vehicle (Two wheeler, four wheeler, commercial etc.)
-
5.
Actual Registration Number
According to Central Motor Vehicle rules, 1989, and Central Motor Vehicles (Amendment) Rules,1993, various standards for size of number plate are as listed below-
-
For two and three wheelers: Front: 285\(\,\times \,\)45 mm, Rear: 200\(\,\times \,\)100 mm.
-
For light motor vehicles/passenger car: 340\(\,\times \,\)200 mm or 500\(\,\times \,\)120 mm.
-
For medium/heavy commercial vehicles and trailer/combination: 340\(\,\times \,\)200 mm
-
For agricultural tractors: Front: 285\(\,\times \,\)45 mm, Rear: 200\(\,\times \,\)100 mm.
The size of letters and numerals of the number plate have also been standardized. The dimension of letters and figures of the registration mark and the space between different letters and numerals and edges of the plain surface shall not be less than indicated dimensions as shown in Table 1 (Substituted by G.S.R. 338(E), dated 26-3-1993 (w.e.f. 26-3-1993)):
Several variations such as environmental effects, illumination change, blurring, and reflection, make single feature unable to detect multiple number plate in an image. We can get high success rate for number plate detection by considering multiple characteristic features of the number plate. These features of number plate can be given as:
-
1.
Aspect ratio, i.e. width to height ratio which is ranges from [1, 3.5].
-
2.
Black to white pixel density and black to yellow pixel density.
-
3.
Location of a number plate should not be more than 1 m above the ground.
-
4.
Area of standard vehicle number plate.
-
5.
Number of connected objects in a number plate.
3 Image Analysis and Filtering
The suggested method is a hierarchical solution containing three main stages, (1) extraction of the possible region of interest i.e. number plate by various filtering techniques, (2) collection of statistical information of extracted components, and (3) fitting of the logistic regression model for labeling of extracting candidate components. The proposed technique can also detect multiple number plates with different orientations and sizes (front and rear), present in an image. Figure 3 shows the proposed architecture of hierarchical filtering approach.

Proposed architecture
3.1 Filtering Based on Characteristic Properties of a Vehicle Number Plate
The proposed method used characteristic features of a vehicle number plate, as discussed in Sect. 2 for detecting multiple vehicle number plate in an image. We performed filtering based on different characteristics of a number plate such as black to white pixel density, aspect ratio, the number of connected objects and area.
Initially, Connected Component Analysis (CCA) is performed on input images. CCA is a flood fill algorithm to label all the pixels of the image into connected components. Then Minimum Bounding Rectangle (MBR) is applied on each connected component of the image. This process is able to form rectangles on each connected components which further can be filtered, based on the presence of number plate or non-number plate. The output of an input image after performing CCA and applying MBR is shown in Fig. 4.

Input image (Color figure online)
Filtering techniques are applied after getting MBRs. The process is described below:
Filtering Based on Black to White Pixel Density and Aspect Ratio. The range is given for applying filtering based on black to white pixel density (bw_den), and aspect ratio (asp_ratio) is bw_den \(>=\) 0.25 and asp_ratio is [1, 3.5]. The minimum rectangles are stored in variable min_rect. ’N’ is the size of the total number of input images. The algorithm for applying filtering based on black to white pixel density and aspect ratio [7] is given by Algorithm 1.

Further filtering is required as some charts or stickers containing alphabets, adhere on vehicles or signboards, in the images that taken at traffic signals makes the above range of values fit for them. So, some non-number plate rectangles are still present in extracted rectangles from filtering. We put number of connected objects in extracted rectangle from the previous filtering, as our next filter.
Filtering Based on Number of Connected Objects. Since every number plate possess a format given in Fig. 2. By this format, every number plate should have ten connected components as they have total ten alphanumeric characters. The algorithm for applying this filtering technique is as follows:

But this number varies due to various reasons such as: (1) blurring, (2) varying distance of the image from a camera, (3) more than one character can be taken as a single component when the distance between vehicle and camera increases, (4) auxiliary characters are written on the number plate and, (5) orientation of number plate. Still, some extracted rectangles containing non-number plate lies within this range. So further analysis is required.
Filtering Based on Area. Further, the extracted rectangles from Algorithm 2 are filtered by area of number plate, as standard number plate has predefined area as discussed above. Area based filtering technique is described by Algorithm 3.

This filter drastically reduces the number of extracted rectangles containing the non-number plates. After using this filter, some non-number plate rectangles remain that fit into the given range of area due to different orientations, noise, the variation of the distance between vehicle number plate and camera, and blurring in the image. For further refining our search result of detecting vehicle plate, LR based predictor is used. This LR model predicts the candidate regions from the extracted rectangular components that remain after above filtering techniques.
4 LR Modeling
LR is one of the popular statistical regression models and is often used as supervised Machine Learning approach for classification. Mathematically, LR can be given by Eq. 1:
where Y is the dichotomous dependent variable and X is a vector of independent variables. We are given training data of size N, \([X_{i} Y_{i}]\) for i = 1, 2, 3, ... N. \(Y_{i}'s\) will be 0 or 1 while \(X_{i}'s\) are p-dimensional real vector.
One can build the model by considering different structures for G(X). The following are the two instances of G(X) by considering p = 3, which is known as linear and quadratic and are given by Eqs. 2 and 3 respectively.
Here a, b and c are the parameter of G(X). The values of parameter a and \(b_{i}'s\) in the case of linear and a, \(b_{i}'s\) and \(c_{i}'s\) in case of quadratic are estimated using the training dataset.
4.1 Dataset Creation
A training dataset is created for providing training to LR model, and then testing dataset is created for labeling of extracted rectangles into a number plate or a non-number plate. We collected statistical properties of extracted rectangles that include mean, standard deviation and mixed proportions.
Calculation of Mixed Proportions, Mean and Standard Deviation. All input images, each of size (m\(\times \)n) are compiled as input data and is used to train Expectation Maximization (EM) algorithm [8]. It is an unsupervised learning approach and of maximal likelihood nature, whereas LR is supervised learning and uses the least square method. It is applied to grayscale images. There are two steps in EM algorithm i.e. Estimation step and Maximising Likelihood step. These steps are performed iteratively for finding values of statistical properties. EM algorithm use empirical distribution of the histogram of an image (number of peaks in image’s histogram) for deciding the number of iteration of EM algorithm. Here mean and sigma is distribution parameter and mixed proportions are the mixed parameter and represented by mu, sigma, and alpha respectively. After knowing the value of mixed proportions, we can analyze following property of an image:
-
1.
with alpha factor = 0.5; the image is mixed equally in foreground and background pixels.
-
2.
with alpha factor < 0.5; the background pixels are contributing more to the image.
-
3.
with factor > 0.5; the foreground pixels are contributing more to the image.
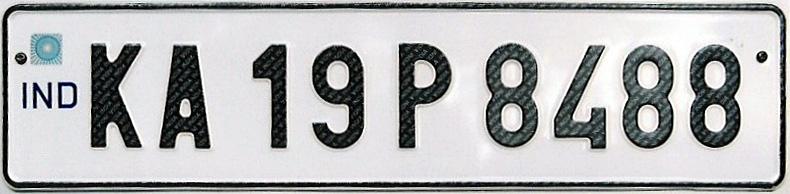
Statistical parameter values of standard number plate, as shown in Fig. 5 are, mixed proportions is 0.5952, mean = 217, and standard deviation = 98.1688.

Standard number plate (“Image Source: http://www.plateshack.com/y2k/India/indiapl8.jpg)” (Color figure online)
The steps taken for creating training and testing dataset are given by Algorithms 4 and 5, and generated sample datasets are given in Tables 2 and 3 respectively, where D_mu, D_alpha, and D_sigma are euclidean distance between standard number plate statistical properties values and the extracted rectangles statistical properties values.


Fitting of LR Model. After creating the training and testing dataset, we fit LR model on the extracted set of rectangles from area filtering. This model label the rectangles into number plate or non number plate based on the training set provided to it. The result of the labeled rectangles after fitting logistic regression model on provided training set is shown in Table 4.
The overall algorithm for the proposed approach can be given by Algorithm 6. The experimental results after applying this algorithm are shown in next section.

5 Experimental Result and Analysis
Several images were taken from immediate traffic area and were analyzed thoroughly. The proposed method is applied on 50 images and found that all the number plates present in the images with cluttered background are detected in the extracted rectangles with the expense of few non-number plates which later can be identified by doing the structural analysis on images. Figure 6 presents the process flow of hierarchical learning approach and a sample of resulting images at every stage. Figure 6, shows that proposed method is able to detect all the three number plates, which are present in the given input image with some non- number plate regions.

Results of hierarchical filtering (Color figure online)
6 Observations and Conclusions
The proposed approach follows hierarchical method to solve the problem of detection of multiple number plates as single process may not be able to achieve this purpose.
One should pay particular attention while creating training dataset for modeling of logistic regression. Training dataset should be a good representative set so that it can properly label the testing dataset.
The experimental results show that our approach has a significant effect in application. So, no matter how the environment change, all the vehicle number plates present in an image are always detected. The calculated average precision of the proposed method for 50 input images is 36.5 % and the average recall is 100 %. The reason of moderate precision in some cases can be broadly classified into three major categories.
-
The distance of camera and moving vehicle is more so that taken image is not clear enough.
-
Fast moving vehicles.
-
Multiple sizes & shape of number plate within one image.
References
Gao, D.-S., Zhou, J.: Car license plates detection from complex scene. In: 5th International Conference on Signal Processing Proceedings, 2000. WCCC-ICSP 2000, vol. 2, pp. 1409–1414. IEEE (2000)
Lalimi, M.A., Ghofrani, S., McLernon, D.: A vehicle license plate detection method using region and edge based methods. Comput. Electr. Eng. 39(3), 834–845 (2013)
Chen, S., Cremers, D., Radke, R.J.: Image segmentation with one shape prior-a template-based formulation. Image Vis. Comput. 30(12), 1032–1042 (2012)
Chang, S.-L., Chen, L.-S., Chung, Y.-C., Chen, S.-W.: Automatic license plate recognition. IEEE Trans. Intell. Transp. Syst. 5(1), 42–53 (2004)
Sengur, A., Guo, Y.: Color texture image segmentation based on neutrosophic set and wavelet transformation. Comput. Vis. Image Underst. 115(8), 1134–1144 (2011)
Amit, Y., Geman, D., Fan, X.: A coarse-to-fine strategy for multiclass shape detection. IEEE Trans. Pattern Anal. Mach. Intell. 26(12), 1606–1621 (2004)
Naito, T., Tsukada, T., Yamada, K., Kozuka, K., Yamamoto, S.: Robust license-plate recognition method for passing vehicles under outside environment. IEEE Trans. Veh. Technol. 49(6), 2309–2319 (2000)
Chillarige, A., Kamakshi Prasad, V.: Gray image segmentation using expectation maximization approach. In: ICRAMAV - 2012: International Conference on Recent Advances in Design, Development and Operation of Micro Air Vehicles, pp. 359–371. BS Publications (2012)
Author information
Authors and Affiliations
Corresponding author
Editor information
Editors and Affiliations
Rights and permissions
Copyright information
© 2016 Springer International Publishing AG
About this paper
Cite this paper
Kirti, Rao, C.R., Wankar, R., Agarwal, A. (2016). A Hierarchical Learning Approach for Finding Multiple Vehicle Number Plate Under Cluttered Background. In: Sombattheera, C., Stolzenburg, F., Lin, F., Nayak, A. (eds) Multi-disciplinary Trends in Artificial Intelligence. MIWAI 2016. Lecture Notes in Computer Science(), vol 10053. Springer, Cham. https://doi.org/10.1007/978-3-319-49397-8_8
Download citation
DOI: https://doi.org/10.1007/978-3-319-49397-8_8
Published:
Publisher Name: Springer, Cham
Print ISBN: 978-3-319-49396-1
Online ISBN: 978-3-319-49397-8
eBook Packages: Computer ScienceComputer Science (R0)