
Abstract
In this chapter, coating properties are discussed in the light of the coating microstructure which is the topic of a first specific subchapter due to specific features related to the cold spray itself. The chapter refers to particles, splats and coatings, which result in subheadings but not systematically. The content mainly elaborates on characteristics, phenomena and properties, but also on particular characterization methods provided that they are not conventional and especially suitable for the study of cold spray issues. The first subchapter (Sect. 4.1) is devoted to microstructure since this cannot be disconnected from that, and it is more commonly termed as coating properties. This emphasis is all the more justified as, all in all, microstructures are rather seldom discussed in publications dealing with cold spray. However, considering microstructures is highly relevant to discuss the mechanical and physical behaviour of cold spray coatings due to some specific aspects of cold-sprayed materials, at a submicronic scale in particular. The authors try to highlight what is typical of cold spray rather than adopting a systematic approach to properties per material or per application. For this reason, the scope remains mainly limited to metallic coating materials even though some parts may refer to polymers and ceramics, which can still be considered as exotic, not to say unsuitable, materials for cold spray.
Access provided by Autonomous University of Puebla. Download chapter PDF
Keywords
These keywords were added by machine and not by the authors. This process is experimental and the keywords may be updated as the learning algorithm improves.
4.1 Microstructure
Due to the ever-spreading range of applications for materials, it is more and more relevant to consider a given microstructure as made of two components, that is, on the one hand, that made of plain material and on the other hand, that made of voids. The latter is commonly termed as porosity. This division was kept for this subchapter.
4.1.1 Particulate and Grain Microstructure
A typical cold spray (CS) microstructure is dual due to the mere fact that the starting material is powder. At the particle scale, the microstructure is made of splats, that is, particles which were deformed at the impact. At a lower scale, the microstructure is of a metallurgical type due to the intra-particle grains. At both scales, the driving force is deformation which results in two types of phenomena, that is, material flow and grain transformation. These can lead to either a rather general description of the microstructure or a more local description which involves crystallography and interface considerations.
4.1.1.1 General
Deformation due to particle impacts results in a splat-typed microstructure which is not always easy to reveal through conventional metallography. Depending on the nature of the cold-sprayed material, the use of specific etching and/or image analysis may be required. When successful, metallography reveals a typical microstructure of splats (Fig. 4.1), the shape of which looks like that of a blobfish (Fig. 4.2). This is due to the fact that plastic deformation of a particle at the impact can be compared to the adaptation of the blobfish body to the high pressure in deep water.

Cross-sectional scanning electron microscopy (SEM) image of cold-sprayed Al a as slightly “Keller’s” etched and b after image processing. (Courtesy of Quentin Blochet, MINES ParisTech 2014)

Blobfish. a General. b Upside down inserted in cold-sprayed Cu (cross-sectional SEM image); in comparison with finite element (FE)-simulated splat (in blue)
Material flow behaviour is shown not only by the outline of the deformed particles but also by the former grain (in the broadest sense of the term) boundaries as a sign of particle heredity (Fig. 4.1). Depending on the feedstock particle production, the starting particles showed a more or less marked fine-grained microstructure (see Chap. 3). For example, the microstructure of a given particle from an atomized powder can range from a dendritic microstructure to a finely cellular microstructure as a function of the cooling rate when atomized (Fig. 4.3). Since rather fine powders, that is, below 30 µm in size, are generally used for CS, dendritic particles are not frequent.

Cross-sectional SEM image of a nitrogen-atomized Al particle, “Keller’s reagent”. (Courtesy of Quentin Blochet, MINES ParisTech 2014)
Coating observation at this scale gives an idea of the homogeneity of the material, which reflects the degree of uniformity in the coating build-up process (Chap. 2) as a function of powder characteristics. To go into this aspect, with a quantitative assessment in particular, one has to develop an approach to morphological parameters using specific tools, on which Sect. 4.2 elaborates. From the observation of the overall microstructure, that is, when considered at the scale of the splat/particle, as described in this section, one may suspect what could happen at a lower scale during the build-up process. The corresponding phenomena are actually those which govern the final (mechanical and physical) properties of the coating.
4.1.1.2 Crystallographic and Interface Characteristics
When colliding, a given particle can undergo extreme conditions for plastic deformation, as described in Chap. 2. For further details, one may refer to various comprehensive descriptions such as recently those by Moridi et al. (2014a, b), Jeandin et al. (2014), and Cinca et al. 2013a, b). As a reminder, one may say that, at particle impact, strain and heating rates can, respectively, reach 109 s−1 and 109 K s−1 typically. In these conditions, three paramount phenomena can occur, that is, grain refinement, strain accommodation and phase/interface transformations and can be distinguished even though these are not entirely independent. Each of them involves various basic mechanisms which result in various microstructure characteristics.
4.1.1.2.1 Grain Refinement
Grain refinement results from dynamic recrystallization as a result of high plastic deformation at particle impact. The basic phenomenon can be well exhibited using transmission electron microscopy (TEM) of a whole elementary slat after CS in nominal conditions. Specific splat-collecting experiments, namely “splat experiments”, were carried out on this for different materials (e.g. the “historical” paper by Dykhuizen et al. (1999), and, more recently, that by Descurninges et al. (2011)). For example, a thin foil of a Ti splat ascertains the popular schematic which was already proposed in 2009 by Kim et al. (2008; Fig. 4.4).

Schematic illustration of dynamic recrystallization at impact between a given particle and the substrate. (After Zou et al. 2009)
Depending on the type of materials, the degree of recrystallization is more or less pronounced. When spraying Ti onto Ti–6Al–4V, grain refinement through recrystallization can involve about half of the volume of the splat (Fig. 4.5).

Dark-field TEM image of a thin foil of a Ti cold-sprayed splat onto a Ti–6Al–4V substrate. (After Giraud et al. 2014)
In the actual coating, during the build-up stage, dynamic recrystallization occurs at the particle interfaces. The process is in keeping with the general basic mechanism which was proposed by Meyers et al. (2007) but applied to the particle–particle interface (Fig. 4.6). Recrystallized grain size and misorientation depend on the particle melting temperature and stacking fault energy (SFE) of the sprayed material (Borchers et al. 2005). This was particularly evidenced in the cold spraying of face-centred cubic (fcc) materials such as Cu, Al or Ni. The latter, for example, due to a rather high melting temperature coupled with a rather low SFE, recrystallizes dynamically in rather small numbers of ultra-fined grains. Electron backscatter diffraction (EBSD) analysis consists of a powerful tool to show this, as successfully applied to Ni in an early work by Zou et al. (2009; Fig. 4.6).

EBSD inverse pole figure (IPF) map of cold-sprayed Ni with, inserted, a misorientation profile crossing a particle–particle boundary (after and below a schematic illustration of the corresponding recrystallization process at this same boundary. (After Zou et al. 2009)
At the prior particle boundaries (ppbs), grains can grow till a size in the micron range typically, due to temperature increase at impact in adiabatic shearing conditions (Assadi et al. 2003; Guetta et al. 2009).
4.1.1.2.2 Solid-State Strain Accommodation Mechanisms
In addition to dynamic recrystallization which can also be considered as due to strain accomodation, other mechanisms can occur due to severe plastic deformation at impact. This subsection deals with solid-state phenomena, which are not located at interfaces exclusively. The mechanism of dislocation rearrangement is not discussed in this chapter because it is rather conventional. Dislocation rearranges in conventional cells which can be precursors of grains or subgrains. For illustrations, the reader can refer to one of the first papers on this topic, that is, Mc Cune et al. (2000), or to one of the most recent papers, that is, Jeandin et al. (2014). Moreover, the phenomena which involve melting at interfaces are covered in a subsequent section since they show a prominent role.
-
Twinning can occur, all the more easily, as the material shows a low SFE, for example, along the (111) planes in fcc metals such as Ag. A 40° misorientation between the slip bands and the plastic deformation direction can thus be obtained typically according to the general shearing mechanism (Paul et al. 2007). Deformation involves regions from a rather large scale to the nanometric scale. This can lead to slip bands crossing an entire splat and/or nanotwinning within shearing bands (Fig. 4.7).
Fig. 4.7 
Stain accommodation evidences. a Slip planes in a cold-sprayed dark-vadored Manta-typed Ti splat (inserted, magnification; courtesy of Damien Giraud/MINES ParisTech 2014). b Nanotwinned shear band in cold-sprayed Ag. (Courtesy of Gilles Rolland/MINES ParisTech 2010)

-
Solid-state phase transformation due to strain accommodation can result in amorphization and disordered structures with randomly oriented nanocrystallites, which can be partly stabilized to some extent due to the presence of impurities (Xiong et al. 2011; Fig. 4.8).
Fig. 4.8 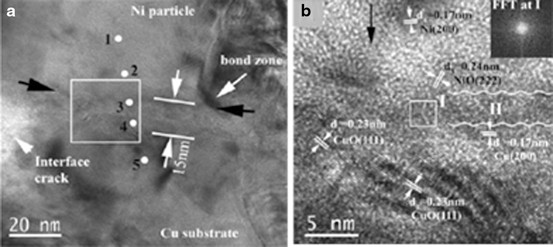
High-resolution transmission electron microscopy (HRTEM) images of cold-sprayed Ni onto Cu. a General view. b Magnification on the box region, showing the disordered and amorphous-like structure. FFT fast Fourier transform. (After Xiong et al. 2011)

4.1.1.2.3 Phase/Interface Transformations
Due to high-energy and short-term material interactions at impact, as already seen, CS microstructure exhibits submicronic, not to say nano-sized, features, the knowledge of which is crucial to understand, therefore possibly control, coating adhesion and cohesion. These features are located at splat–splat or splat–substrate interfaces. The approach to the corresponding phenomena is rather complex due to nonequilibrium conditions. One may, however, put them into two classes depending on whether they contribute to melting or/and cleaning the interface. Solid-state transformations were discussed in the previous sections.
-
Melting can be considered as the culmination of material interaction due to the impact. Evidences of melting are rather difficult to find out due to the small size of the interaction areas which, moreover, cannot be described through—powerless—modelling. TEM analysis is therefore the best tool for investigation, especially when involving materials which can react with each other or when using a low-melting temperature spray material. For example, in an early study, Barradas et al. (2007) thoroughly described the formation mechanisms of intermetallic phases when cold spraying Cu onto Al and proposed an interface phenomenological diagram. These phases revealed transient melting at the coating–substrate interface through eutectic or peritectic zones in particular (Fig. 4.9a). This is all the easier as the melting point can decrease with increasing strain, for example, for fcc metals (Lynden-Bel 1995). When considering the CS coating itself, using a low-temperature material such as zinc can promote a liquid phase (Fig. 4.9b, Li et al. 2010).

-
An advanced stage of the melting process can result in a rather extended interface layer of molten material, possibly amorphous, provided the cooling rate is high enough for the involved material. Amorphization can outline a great part of the splat–substrate interface (Fig. 4.10).
Fig. 4.10 
Bright-field TEM image of a Ti cold spray splat onto Ti–6Al–4V above two dark-field magnified TEM images of the amorphous layer at the interface. (Courtesy of Damien Giraud, MINES ParisTech 2014)

-
An intermediate interaction state between purely solid-state transformation as described in a subsequent section (Fig. 4.8) and interface fusion consists in a so-called viscous forced mixing of the two interacting materials. These can remain either partly at the solid state or not, depending on the nature of the starting materials and on processing conditions. The involved mechanism can be compared to that encountered in mechanical alloying, explosive processes or in a two-body contact area under wear–friction conditions. Typical vortices can form at the interface as a result of adiabatic shearing instabilities which relate to the Kelvin–Helmotz instability phenomenon (Fig. 4.11; Champagne et al. 2005; Ajdelsztajn et al. 2005).

-
Cleaning, to use a general term, means removing, at least partly, contaminants, inclusions and/or external phases such as oxides, nitrides, etc. The most common effect rests on fragmentation and/or partial removal of the oxide layer which exists at the surface of the starting powder (Fig. 4.12). This occurs due to particle impact at the coating build-up stage. The effect is especially marked and beneficial for reactive and oxygen-sensitive materials such as Ti or Ta (Giraud et al. 2014; Jeandin et al. 2014; Descurninges et al. 2011).
Fig. 4.12 
High-resolution (HR) TEM image of a commercial feedstock Ta powder. (After Jeandin et al. 2014)

-
The oxygen content varies along the particle impact interface due to temperature and strain differences at impact. Here again, basic phenomena could be better elucidated from splat experiments, knowing that these can be transposed to the coating build-up level. Oxygen generally decreases from the centre to the periphery of the splat because of temperature increase along the outline, as shown by modelling of the particle impact (e.g. Guetta et al. 2009; Schmidt et al. 2009). Temperature increase promotes oxygen diffusion at both the solid and liquid state. For the latter, it can be assumed that part of the superficial oxide layer at the surface of the sprayed particle could break and leave a purely metal-to-metal contact at impact, as already shown for alumina in the cold spraying of Cu onto Al (Barradas et al. 2007). Solid-state diffusion of oxygen from the splat–substrate/splat interface could be exhibited in several studies of CS microstructure, using Energy dispersive X-ray spectroscopy (EDX) analysis in TEM (Giraud et al. 2015; Jeandin et al. 2014; Fig. 4.13).
Fig. 4.13 
Dark-field TEM image and (top left) HRTEM image of a Ti splat–Ti–6Al–4V interface with EDX linescan profiles across two lines (drawn in red in the image). (After Giraud et al. 2014)

-
Oxide fragmentation can also be assumed to contribute to oxygen variation at the interface. However, this has not yet been shown specifically in research work despite a great deal of presumptions. Oxide layer fragmentation can play a specific role in the context of that of the oxygen content because of consequences on the mechanical behaviour of the involved interfaces, for example, for the coating–substrate bond strength and coating cohesion which will be developed in Sect. 4.3.6. Oxide fragmentation should give fine oxide fragments the role they show in oxide dispersion-strengthened alloys. An oxide dispersion at CS interfaces can exist as could be encountered in dynamically compacted powder metallurgical (P/M) superalloys some time ago (Morris et al. 1987), which can be beneficial for resistance due to composite reinforcing effect at interfaces.
More generally, all of the above-mentioned interface microstructural CS features can influence coating mechanical properties, that is, vortices as pegging sites for adhesion, intermetallics as pegging sites also or (more detrimental) as embrittling phases, amorphous interlayer as a protecting barrier, oxide dispersion as a local composite, etc. There is therefore a strong demand for assessing mechanical properties which correspond to these typical CS microstructural characteristics. To meet this demand, a local approach to these properties is required since all these characteristics involve the nanometric range, which may lead to say that cold-sprayed coating systems are nano-length scale governed. A local investigation into mechanical (interface) properties would be used as an input for micro-to-macro modelling provided that a significant development could be done in the future to involve very fine microstructures and ultra-rapid phenomena. First steps in this scope are discussed in Sect. 4.3.6.
4.1.2 Porosity
Even though (or because) CS was formerly developed to achieve fully dense coatings due to high-kinetic processing conditions which were suitable for that, coating porosity assessment is of high concern. This is all the more true because subsequent development also showed that CS can be used to obtain porous coatings deliberately, for example, for biomedical applications (Sun et al. 2008; Cinca et al. 2010).
Porosity strongly depends on the coating build-up process. Porosity forms due to insufficient particle deformation at the impact and/or an insufficient particle velocity, which are not independent parameters. One cannot be more precise since these required parameters, that is, deformation and velocity, are local depending on the size and morphology of the particles and the roughness of the substrate. In the coating formation process, “substrate” means, first, the actual bulk substrate for the first layer to be deposited and, second, that made of the already-deposited particles. Porosity creation therefore consists of a random process governed by the particle impinging. One may give only general trends on its evolution within the coating to integrate the random variation over a high number of splats, typically above a few hundred. The major trend results from the peening effect, that is, tamping due to successive impact from the succeeding particles, which is cumulative till a certain coating thickness. In the upper part of the coating, porosity is therefore higher due to a lower number of impacts the material had to undergo. Consequently, a cold-sprayed coating exhibits a gradient from the coating–substrate interface to the coating surface. The gradient profile depends on the materials and spraying conditions, primarily powder grain size and distribution, therefore the particle velocity field, powder flow rate, number of passes and the nature of the substrate. This can be well exhibited when cold spraying a hard-to-densify material, for example, a Ti-based alloy, using two passes (Fig. 4.14).

Cross-sectional SEM images of cold-sprayed Ti–6Al–4V onto Ti–6Al–4V. (After Christoulis et al. 2011)
However, this peening effect needs a certain time prior to be established, which corresponds to the time from which the underlayer (made of the already-deposited particles) is stable. This time is all the longer the substrate material shows a high shock-absorbing capacity such as a polymer (Fig. 4.15). To shorten this time and promote adhesion and densification, a metallic bond coat can be used, for example, using tin (Ganesan et al. 2012).

SEM micrographs of cold-sprayed aluminum onto PA66 using three passes at 2.5 MPa–250 °C. (Courtesy of Damien Giraud/MINES ParisTech 2014)
To determine the void content, that is, the porosity level as commonly said, several, not to say many, methods exist actually (reviewed in Adreola et al. (2000), for example). Common methods are physical methods such as Archimedean porosimetry, mercury intrusion porosimetry (MIP), gas permeation and pycnometry. However, these are not quite often convenient due to characteristics typical of CS, that is, generally a very low and/or heterogeneous porosity. The best way to proceed consists in using conventional two-dimensional (2D) metallography or three-dimensional (3D) techniques.
4.1.2.1 Two-Dimensional Metallography
Conventional 2D metallography can be suitable provided that smearing and undeliberate material removal can be prevented when polishing. Smearing is all the more frequent that ductile materials are often employed for CS coating. In contrast, undeliberate material removal is promoted by the presence of hard phases or due to local differences in hardness as can be seen at the coating–substrate interface or at the edge of pores. Even though it is a very common issue in the preparation of materials prior to observation, special care is required when characterizing cold-sprayed materials. If not, this can result in over- or underestimating porosity (Fig. 4.16).

Cross-sectional optical images of a specimen (the same for the two pictures) of cold-sprayed Ag onto Cu. a After a rather mediocre polishing. b After careful polishing. (Courtesy of Gilles Rolland, MINES ParisTech 2010)
Polishing quality is therefore the main source of potential errors for subsequent porosity measurements, which is now conventionally carried out using quantitative image analysis (QIA; Fig. 4.17). For a given polishing state, the degree of uncertainty to the result is rather low at this stage and can be said to be limited to a maximum of ± 5 % (relative value).

Cross-sectional image of a cold-spray Al coating of PA66 before (left) and after (right) image processing. (Courtesy of Damien Giraud, MINES ParisTech 2014)
4.1.2.2 Three-Dimensional Metallography
Compared to 2D methods, the strength of 3D methods for porosity assessment results from the bypassing of the materials preparation stage due to the direct observation within the material. Incidentally, pseudo-3D methods based on the use of serial cross sections are not satisfactory due to the need of polishing again, even though there were attempts in the thermal spray field (Ctibor et al. 2006). The most popular techniques are based on X-ray microtomography (XMT) or laminography, despite the development of ultrasmall-angle X-Ray or small-angle neutrons scattering. However, the latter remain rather marginal and mainly restricted to ceramic materials. XMT and variants (primarily laminography) can now show the required high resolution. The application of these techniques to cold-sprayed coatings was particularly developed successfully in the past 5 years (for the most recent, Delloro et al. 2014a, b).
-
XMT is a powerful tool for investigating into porosity in thermally sprayed coatings which could reveal characteristics which had not yet been exhibited or even suspected (Amsellem et al. 2012). XMT can show the influence of powder characteristics on porosity (Fig. 4.18). Beyond the determination of the mere porosity level and distribution, XMT can result in the thorough study of morphological parameters using stereological protocols coupled to image analysis. These aspects are discussed in Sect. 4.2, including CS materials parameters other than porosity.
Fig. 4.18 
3D XMT images (reconstructed volumes of 280 × 280 × 573 mm3) of porosity in cold-sprayed Ag. a For a fine powder. b For a coarser powder. (After Rolland et al. 2008)

-
Computed laminography (CL), in contrast with tomography, yields images of object slices by a simple linear translation of the object relative to the tube–detector system. Reconstruction algorithms are nearly the same as those used in computed tomography. Compared to XMT, laminography is particularly suitable for characterizating anisotropic features, for example, porosity gradient along a given direction, that of spraying typically or surface roughness along the coating–substrate interface. The latter is discussed in Sect. 4.2. Regarding the assessment of in-depth evolution of porosity within a CS coating, a striking example results from the already-described shock absorbing combined to tamping effects in CS metallization of a polymer (Fig. 4.19).
Fig. 4.19 
3D CL image of porous cold-sprayed Al. Porosity in red, Al in beige and reconstructing/analysis plane (of 175 × 183 µm2 in size) in purple. (Courtesy of Damien Giraud/MINES ParisTech 2014)

4.1.2.3 Comparison between 2D and 3D Techniques
3D techniques for porosity assessment (and more generally for microstructure analysis) can remove all doubts on porosity assessment from the prevention of any artifact due to sample preparation (see Sect. 4.1.2.1). Differences between 3D and 2D assessments are significant, whatever be the analysed region within the coating (Fig. 4.20). Differences can result in either underestimation or overestimation depending on the type of involved materials which would promote either smearing or material removal effects. In Fig. 4.20, the error bars correspond to a given preparation method (2D or 3D) actually. They do not therefore overlap.

Comparison between the global void content (i.e. porosity) obtained from 2D and 3D techniques. (After Rolland et al. 2008)
CS microstructure is multifaceted. Features range from the nano- (as formerly stated by Grujicic et al. 2004) to the macroscale. The latter is well illustrated by the web video illustration of additive manufacturing of freestanding components by CS (Halterman 2013). In addition to the mere dimensional aspect, an essential part of the CS coating properties relates to the morphology of these same features. This results from specific processing and metallurgical characteristics involved in CS, as previously described. A good knowledge of coating properties therefore requires morphological studies. These result in the material of the subsequent section in which morphological concerns are discussed. The whole will help in developing more powerful and realistic modelling of coating microstructures therefore properties.
4.2 Morphological and Physical Properties
The so-called morphological properties (see the definition in Sect. 4.2.1) are discussed in the same section as that for physical properties, even though these should have been discussed in a separate section. This was not done due to the fact that they result in a constantly changing domain in which a high amount of research work is still in progress with many advances still to be made. The chapter, the scope of which is to deal with these aspects, gives, however, a flavour of these due to the associated promising outlook.
4.2.1 Morphology
To give a definition, morphological properties relate to the shape and size of the various parts which result in the coating, that is, from the particle to the coating itself through all microstructure-relevant features. In addition, some relevant morphological features can relate to the substrate, primarily surface roughness and coating–substrate interface.
As previously shown, the coating microstructure and therefore coating properties strongly depend on local parameters such as particle velocity, temperature, consequently strain rate, which directly result from mainly local morphological characteristics (Cinca and Guilemany 2013; Cinca et al. 2013a, b). A description of these, which can be a 3D description in the most advanced development, is therefore required. The description is carried out prior and after CS deposition, to go into the process and final properties of the products, including the feeding of models. This should also help in enriching approaches to the process, including well-established approaches such as that based on the so-called particle critical velocity. This description is the material of this subchapter. The latter will not revert to porosity, which was already discussed in Sect. 4.1.2.
4.2.1.1 Particle Morphology
A view shared by a larger and larger number of people is that powder is the key factor in the development of CS (Jeandin et al. 2014; see the above introduction of Sect. 4.2.1 and Chap. 2). Spherical powders are no more considered as the best powders for the process, which is inconsistent with what the doxa said in the early stages of CS (and still say from time to time). There is therefore a high demand for developing tailored powders, which corresponds to a major economic issue. This development requires thorough characterization of particle morphology for better understanding of consequences on coating properties consequently for powder optimizing.
Conventional characterization methods such as optical and SEM methods are rather limited even when coupled with image analysis. Moreover, laser-based imaging diagnostics and granulometers are not suitable for morphology assessment. Numerical 3D classification of particles therefore consists of a paramount step, especially for use as a data supplier for modelling input. Advanced classification (Delloro et al. 2014a) from XMT can show three stages typically, that is, (1) image processing (e.g. using segmentation), (2) shape criteria application (using various measuring operations), and (3) cluster analysis (e.g. using the K-means method). The method can involve several thousands of particles, the shape distribution of which can be given (Fig. 4.21).

Tantalum irregular powder for cold spray. a SEM image of the loose particles. b Shape distribution obtained by XMT (each sector of the pie diagram shows the number of analysed particles and the corresponding XMT image of the representative shape with x, y, z axis vectors of 15 µm in length). (After Delloro et al. 2014a)
This morphological approach can be extended to agglomerates the use of which is expected to be promoted in CS, as could be done for WC–Co (Li et al. 2013), Ag-based composites (Zeralli et al. 2014; Rolland et al. 2012) or ceramics (Yamada et al. 2009). Here again, 3D microtomography is a powerful tool for characterization (Fig. 4.22).

Example of agglomerated powders for cold spray. a SEM image of WC–Co powder (after Li et al. 2013). b XMT image of Ag–SnO2 powder. (Courtesy of Yassine Zeralli, MINES ParisTech 2013)
4.2.1.2 Splat Morphology
A prominent interest in the study of splat morphology is to set correlations with that of particle morphology through the deformation behaviour. Proceeding particle by particle, that is, to study it for a given particle, remains an experimental challenge, which could be successful in the near future using advanced techniques such as laser shock-based techniques (Barradas et al. 2007; Jeandin 2011; see Sect. 4.3.6.3). Currently, the approach is statistical and applied to either a single splat or the whole coating. Two- and three-dimensional techniques can be employed. The subsequent subsections will not elaborate on 2D techniques, of which Sect. 4.1 already gave an illustration indirectly. One may say only that 2D imaging is generally combined to image analysis and measuring of the splat deformation ratio, for example. In contrast, in 3D techniques, the principal stage is that of image asquiring, as discussed below exclusively:
-
Single splat morphology can be studied from linescan-typed collecting experiments. Dimensional and morphology assessment of the emerging part of the splat is fairly easy to achieve by conventional 3D optical or SEM profilometry (Sect. 4.1). Complete characterization, that is, including the part which is embedded into the substrate, requires an additional study of cross sections to establish a shape typology from the knowledge of the emerging part. Otherwise, direct complete characterization can be obtained from XMT or better laminography (CL; Delloro et al. 2014a). This is all the easier to apply as the splat differs from the substrate material due to X-ray absorption contrast. If not, the sample has to be prepared specifically (Delloro et al. 2014b). Selective etching, infiltration or coating (of the splat, provided that this does not influence the impact) can be used for that purpose (Fig. 4.23). In addition, XMT and laminography could be used to go into inner splat morphological features such as deformation contours due to porosity within a splat aggregate (Li et al. 2013).
Fig. 4.23 
XMT images of cold-sprayed Al onto Al 2017. a General. b With numerically extracted splats. (After Rolland et al. 2008)
-
In-coating splat morphology can be obtained using XMT or CL provided that the just above-mentioned preparation of the sample could be used to extract a given splat from the surrounding splats (Fig. 4.23; Rolland et al. 2008).

-
The use of these 3D techniques ascertained that deformation is not uniform actually at the splat scale, which highlights the role of local parameters such as particle shape therefore local velocity and temperature.
4.2.1.3 Roughness
Interface roughness is the relevant parameter to be considered due to its influence on splat–splat and splat–substrate adhesion properties, consequently on coating cohesion and bond strength (Sect. 4.3.6). Interface roughness results from particle morphology (discussed in Sect. 4.2.1.1) and substrate surface roughness prior to CS.
-
Surface roughness of the substrate can result from pretreatment, including grit blasting and/or the first CS pass—with heating and cleaning effects. Once again, conventional methods such as those mentioned in the introduction of Sect. 4.2.1.2 are suitable (Gan and Berndt 2014; Blochet et al. 2014). As already mentioned, a more thorough investigation can be based on the use of X-ray laminography (Fig. 4.24).
Fig. 4.24 
3D CL image of coating surface and coating–substrate interface roughness for cold-sprayed Al onto PA66 (reference planes—in blue and red—of 175 × 183 µm2 in size). (Courtesy of Damien Giraud/MINES ParisTech 2014)
-
Interface roughness can be more or less accurately assessed depending on the selected characterization method. For example, the latter can go as far as describing vortex-like features (back to Fig. 4.11) which govern pegging effects. 2D or 3D techniques in addition to quantitative image analysis (Blochet et al. 2014) can be applied (Fig. 4.24).

4.2.1.4 Macroscopic Shape
“Macroscopic shape” is understood as a shape related to the substrate or coating geometry. Involved dimensions are therefore commensurable with coating thickness typically. In the first case, the relevant geometry is that of the substrate. A corresponding issue might be that of repair, for which the filling of cavities is of high concern (Blochet et al. 2014; Jones et al. 2011). Second, the relevant geometry is that of the shape of the coating. This can relate to the control of coating thickness for conventional coating applications for CS. However, beyond this, this can relate to application of CS to additive/direct manufacturing of parts, namely freedom fabrication. The latter was already claimed to be very promising at the beginning of CS development, even though at this time the control of the coating build-up could be rather difficult (Pattison et al. 2007). Today, the achievement of rather complex shapes, for example, using micronozzles (Sova et al. 2013a, b), and controlled deposition without masking, for example, for electrode circuits (Kim et al. 2013), can be envisaged (Fig. 4.25).

Shaped deposits for application to freedom fabrication by cold spray. a Optical top view of an Al deposition cone using a micronozzle (after Sova et al. 2013a, b). b Optical view of Al–Cu vertical wall using a triangular tessellation scheme. The scale graduation of the rule is 1 mm. (After Pattison et al. 2007)
4.2.1.5 Approach to Morphology Through Multiscale Modelling
All the points which were discussed in the four previous sections strongly depend on the coating build-up process. With regard to CS, their understanding, validation and prediction impose the obligation of developing modelling and numerical simulation since any empirical approach is basically limited. The main difficulties to overcome result from the multiscale nature of the process. Build-up involves phenomena which occur at the particle scale and the coating scale, knowing that the submicronic scale cannot yet be described through computational modelling, as already mentioned. This section aims only to give a few key elements on modelling from the morphological standpoint to go into CS process and applications. Incidentally, this area is booming, which justifies a snapshot of it only.
-
Computational fluid dynamics (CFD) must involve particle morphology due to its influence on spraying gas velocity. Since this type of modelling is continuously under development, for example, Lupoi and O’Neill (2011), morphological aspects will play a greater and greater role. The approach will be refined from the former use of drag coefficients of irregularly shaped particles (Tran-Cong et al. 2004) (Fig. 4.26).
Fig. 4.26 
Various typical shapes of particles, based on agglomerated spheres, used for the calculation of drag coefficients. (After Tran-Cong et al. 2004)

-
Finite element (FE) simulation is very popular to simulate particle deformation at impact. Numerous publications, for example, Gu (2013) and Xie et al. (2013), including impressive videos on the web, are available. However, for the vast majority, they deal with spherical particles and/or in a 2D approach. Recent advances relate to irregular powders (Assadi et al. 2014; Yin et al. 2014), even though the irregular character remains still rather limited and the number of involved particles is low. However, great expectations exist actually from improvements in FE 3D calculations applied to real particles (i.e. obtained from XMT, see Sect. 4.2.1.1) in addition to the involvement of the so-called morphological models based on the use of statistics (Delloro et al. 2014a; Fig. 4.27). The latter permits a significant increase of the number of particles to be simulated in the coating build-up process.
Fig. 4.27 
FE 3D simulation of the impact of a real irregular particle. a Top view at the initial stage prior to impact. b and c At the end of the impact with a cross-sectional view (c). (After Delloro et al. 2014a)

-
Morphological models consist of a class of models which put ahead the morphology of the particles. Their development in thermal spray date back to about one and a half decades ago when applied to particles which were plasma-sprayed onto rough materials, for example, fibers (Cochelin et al. 1999). At this time, they were based on a lattice-gas automaton that reproduces the hydrodynamical behaviour of fluids. They could be then developed for the modelling of CS coating build-up (Delloro et al. 2014a; Jeandin et al. 2014; Fig. 4.28) with the final objective to be coupled with FE modelling to result in a general powerful model using real images (see Sect. 4.2.1.1) as numerical inputs.
Fig. 4.28 
Simulation from 3D morphological modelling of the coating build-up for cold spray of Ta. (Courtesy of Laure-Line Descurninges, MINES ParisTech 2013)

-
A striking advantage of this class of morphological model rests on the high number of particles which can be involved, that is, several thousand.
4.2.2 Electrical and Thermal Conductivity
Conduction is the transfer of energy, either thermal or electrical, through molecular communication within a medium or between mediums in physical contact. The transfer of thermal energy, for example, could be dominated by elastic impact as in fluids, or by free electron diffusion as in metals or phonon vibration as in insulators (Seo et al. 2012a). The thermal and electrical conductivities of metal and composite coatings deposited by CS are reported to be strictly related and directly result from the feedstock powders characteristics, the deposition process (and post-process) conditions and especially from the influence of these factors on the average coating quality in terms of microstructure and morphology (Koivuluoto et al. 2012; Stoltenhoff et al. 2006); in this sense, the behaviour and discussion of both thermal and electrical conductivities can be associated being dominated by the nature of chemical and physical bonding among atoms and grains. Regarding the materials of interest in the world of CS, up to now, the study of thermal and electrical conductivities is still restricted to copper- and aluminum-based coatings as reported, for example, in Seo et al. (2012a, b), Koivuluoto et al. (2012) and Sudharshan et al. (2007) and the reason is essentially the excellent intrinsic high conductivities of these metals which lead to their extensive use for the electrical and thermal management in the majority of industrial applications.
4.2.2.1 Conduction Properties on CS Coatings
The quality of the boundary between grain and particles is the key factor to understand and describe the behaviour of conduction properties in CS coatings. Unlike in bulk annealed materials, the microstructure consists of large grains with low-defect boundaries in metallurgical contact between each other; in the case of CS coatings, the microstructure is very different: the presence of pores, oxides, highly plastically deformed zones and high dislocation density due to the cold working is typically encountered, as well as the presence of extended nonhomogeneous particle–particle boundaries which can depend on deposited materials and process conditions. Indeed, during the coating growth, the impinging particles plastically deform and stick together with the substrate, thanks to several mechanisms such as adiabatic shear instabilities, mechanical anchorage and local micro-welding processes, so that the description and characteristics of the particle–particle boundaries network is a really complex issue and the conditions of things are that only a qualitative evaluation based on micrographic investigation can be performed. Unfortunately, the contact resistance provided by these boundaries is precisely the key factor determining conductivity properties of the deposited coatings and as a consequence the lack of tools to analytically describe these boundaries lead to the impossibility to predict and control the conduction properties of CS coatings. Some attempts have been made during the years, for example, in Sudharshan et al. (2007) a general formula according to the Matthiessen rule has been considered to describe the electrical resistivity of Al and Al–Al2O3 composite coatings:
where ρ is the electrical resistivity of the material (coating), ρ 0 is the temperature-dependent contribution caused by the thermal vibration, ∆ρ gb is the contribution of the grain boundaries, ∆ρ disl is the contribution of dislocations, ∆ρ por is the contribution of porosity and ∆ρ fil is the contribution of the (eventual) ceramic or other filler embedded in the metal matrix. However, after an accurate evaluation of each term of Eq. (4.1), the conclusion was that the only significant contribution is the ρ 0 term or rather the intrinsic properties of the deposited material that is strongly in disagreement with the reported experimental data for cold-sprayed Al and Al–Al2O3 composite coatings (Sudharshan et al. 2007). At the same time, in Litovski et al. (2014), an empirical relation for apparent thermal conductivity, λ app, has been formulated to describe the thermal conductivity of Al and Al–Al2O3 composite coatings:
where λ solid is the thermal conductivity of the solid phase in the range of interest, f(porosity) is a function of total porosity with a numerical value of about 0.5 and M is a microstructural parameter accounting for the size of the relative contact area between particles. By using this approach, an M value of 0.02 has been back calculated by using the experimental results of thermal conductivities and taking into account that the original particle size was in the range of 20–30 μm. A contact area between particles of about 300 nm was estimated and confirmed experimentally by the authors, thanks to cross-sectional SEM investigations (Litovski et al. 2014). However, the variation of the defined M value as a function of coating material and deposition conditions are hard to determine, and the consequent validity of Eq. (4.2) must be checked each time, limiting the powerfulness of the formula.
Anyway, considering that up to now it is hard to give an analytic description about the influence of specific coating microstructural characteristics on conduction properties of cold-sprayed coatings, it is still true that some details and trends based on experimental results are evident and can help the understanding of these phenomena.
4.2.2.2 Effect of Coating Microstructure and Post-deposition Annealing
The effect of coating porosity and crystallite size on thermal conductivity of pure copper CS coatings, for example, is extensively discussed in Seo et al. (2012a, b) as a function of powder manufacturing process, spray parameters and equipment as well as post-deposition annealing conditions as summarized in Fig. 4.29. Certainly higher coating porosity leads to poorer thermal conductivities; however, the quality of the original feedstock is important, and, for example, as-sprayed coatings (indicated with mark 1 in Fig. 4.29) obtained with electrolytic powders (A) or water atomized (B) even if characterized by low porosity exhibit poor thermal conductivity probably due to the larger quantity of oxygen in respect to gas atomized. Moreover, certainly a post-deposition thermal annealing is effective in reducing porosity and heat-treated specimens always exhibit higher thermal conductivities in respect to corresponding as-sprayed coatings, even if the annealing must be properly tuned as a function of coating material and also deposition parameters. In this sense, higher temperature (condition 6, 600 °C) can be either detrimental, for example, in the case of helium-sprayed coatings because of a significant increase in porosity and crystallite size (D), either beneficial in the case of electrolytic powders (A) or leading to no significant effects with respect to a treatment at lower temperature (B, C, E).

Thermal conductivity of cold spray pure copper coatings as a function of coating porosity and crystallite size. Coatings are obtained by using feedstock powders produced by electrolysis (A) water atomization (B) and gas atomization (C, D, E). Coatings have been sprayed with air at 400 °C and 0.6 MPa as carrier gas (A, B, C) or helium at room temperature and 0.62 MPa (D) and 3.0 MPa (E). Samples have been heat-treated isothermally in high vacuum up to 600 °C (as-sprayed, 200, 300, 400, 500 and 600 °C) for 1 h as referred to by marks 1, 2, 3, 4, 5 and 6, respectively. (Seo et al. 2012b)
Similar considerations are reported in Coddet et al. (2014) to explain the evolution of the electrical conductivity of Cu–0.5Cr–0.05Zr cold-sprayed coatings as a function of post-deposition annealing temperature. The conductivity ranged between 15.5 mS/m (i.e. 25 % International annealed copper standard (IACS)) obtained in as-sprayed coating up to 49 mS/m (i.e. 84.5 IACS) with a properly tuned post-deposition annealing. Same situation is observed for Cu–Al2O3 nanocomposite cold-sprayed coatings obtained by using mechanically milled nanocrystalline copper alumina powders where the coatings exhibited electrical conductivity lower than 20 mS/m in as-sprayed conditions, while up to about 50 mS/m resulted after annealing (950 °C) as reported in Sudharshan et al. (2007). The correlation between microstructure evolution and electrical conductivity is further highlighted in Koivuluoto et al. (2012), wherein the performances of high-pressure CS (HPCS) and low-pressure CS (LPCS) are compared in the deposition of Cu coatings starting from Oxygen-free high conductivity (OFHC) Cu feedstock. Figure 4.30 showed the cross-sectional micrography and fractography observations of as-deposited and annealed coatings obtained with HPCS and LPCS; a further comparison with composite Cu–Al2O3 LPCS coating is reported. The high plastic deformation upon impact, particle flattening and related average quality of the microstructure obtained with HPCS enabled the obtainment of electrical conductivity up to 79 IACS in as-deposited conditions compared with only 46 obtained with low pressure. Even after a post-deposition annealing (400 °C—2 h) the gap is still unchanged having 90 IACS versus 69 IACS obtained, respectively, starting by high- and low-pressure cold-sprayed coatings. After annealing, the presence of dimples is a proof of the effectiveness of the treatment for the promotion of atomic diffusion and microstructure consolidation and as a consequence for the enhancement of conduction performances.

Different cold spray 6-hydroxy-5-flucytosine (OHFC) coatings morphology and fractographies (before and after annealing) obtained with different spray equipment and feedstock. HPCS high-pressure cold spray, LPCS low-pressure cold spray. (Koivuluoto et al. 2012)
When the coating microstructure exhibited a poor particle–particle cohesion as in the case of LPCS pure copper coatings, the addition of a small percent of ceramic alumina particles in the feedstock can enhance the peening effect leading to a more significant particle deformation, porosity reduction and subsequent enhancement of the average compactness of the microstructure. This variation, despite the strongly insulating characteristics of alumina particles embedded in the coating as shown in Fig. 4.30, resulted in an average increase of the electrical conductivity of the LPCS coating (60 and 83 IACS, respectively, before and after thermal annealing) confirming once again the crucial role of coating microstructure in respect to all other parameters, still including material intrinsic characteristics, in determining the conduction properties.
As for electrical conductivity, similar considerations are reported in the evolution of thermal conductivity, for example, in the case of Cu–Cr cold-sprayed composite coatings as reported in Kikuchi et al. (2013). In particular, vacuum heat treatment at 1093 K is reported to promote a beneficial evolution of coating microstructure with the vanishing of particle–particle flattened boundaries typical of as-sprayed morphology and with the obtainment of a full recrystallization of Cu particles and crystal grain growth up to 10 µm. As a consequence of this microstructural change, an increase of thermal conductivity of about 10 % resulted.
Electrical resistivity is reported in Choi et al. (2007) to show anisotropy among in-plane and through-thickness properties in the case of as-sprayed pure Al coatings with through-thickness resistivity value typically higher in respect to in plane.
Summarizing, the coating microstructure and in particular porosity and morphology of particle–particle boundaries are reported to be the major factors influencing the conduction properties of cold-sprayed coatings even if up to now no detailed models are available to analytically describe the mechanisms. As a matter of fact, the key to control these microstructural features is fundamental to enable a significant enhancement in conduction performances of the as-sprayed coatings; in this sense, a post-deposition thermal annealing is certainly the more available, quick and, for these reasons, also investigated approach. A convincing as well as a qualitative mechanism proposed to describe the influence of thermal annealing is reported in Seo et al. (2012a) regarding the evolution of thermal conduction in cold-sprayed pure copper coatings: in the case of as-sprayed material (Fig. 4.31a), interfaces with voids and oxides between splats are formed as well-distributed porosity depending on deposition conditions and material characteristics (strength, critical velocity, etc.). These interfaces act as an interceptive gap in the conduction, hindering the energy transfer and being responsible for typical poor conduction properties of the as-deposited coatings. Thanks to a properly tuned annealing treatment (Fig. 4.31b), porosity coalesced, and particle–particle interfaces can progressively vanish thanks to the atomic diffusion and deep contact establishment between splats and grains. These are the optimal performances achievable; typically, they provide conduction properties still lower in respect to correspondent bulk material due to the residual presence of porosity and thicker interfaces. Annealing over the optimal conditions (as shown in Fig. 4.31c) lead to abnormal grain growth further increasing the interfaces between grains and rearrangement of voids. This is detrimental by the point of view of conduction properties as well as mechanical cohesion promoting a strong deterioration of the coating properties.

Schematic description on optimization of annealing process. a Grains in as-sprayed copper coating. b Uniformly grown grains after optimal annealing. c Abnormally grown grains over optimal annealing temperature. (Seo et al. 2012a)
4.2.2.3 Conduction Properties: CS Versus Other Thermal Spray Techniques
Finally, it is further interesting to highlight the conduction properties of CS coatings in respect to other thermal spray technologies. The behaviour of electrical conductivity for copper coatings deposited by CS, high-velocity oxygen fuel (HVOF) and arc spraying in the as-sprayed conditions and after different post-deposition annealing is shown in Fig. 4.32. The low processing temperature of CS in respect to the other thermal spray technology is the key of its suitability to obtain denser coatings with a lower oxygen content and as a consequence with improved conduction performances. As expected and according to the previous discussion, a post-deposition annealing is beneficial for all coatings and considering the specific conditions explored in this study, a higher annealing temperature leads to a progressively significant improvement of the electrical conductivity. The gap between CS coatings and other thermal spray coatings is still preserved confirming the excellence of CS in the deposition of pure metal coatings. On the other hand, all coatings, even after post-deposition annealing, exhibit conduction properties lower in respect to bulk Cu even if it must be noticed that a properly tuned CS process and post-deposition treatment allow the achievement of performances very close to the correspondent bulk material.

Electrical conductivity of copper coatings deposited by cold spray (CS), high-velocity oxygen fuel (HVOF) and arc spraying (AS) in the as-sprayed conditions and after different annealing. Annealed bulk Cu data are reported as reference material. (Stoltenhoff et al. 2006)
4.3 Mechanical Properties
The mechanical resistance and structural integrity of thermal spray and CS coatings are generally one of the main issues for several industrial applications. For example, CS is often applied in maintenance, repair and overhaul (MRO) in aeronautic, military and automotive industries (Champagne and Helfritch 2014; Jones et al. 2011) for both refurbishment and structural recovery, where mandatory restrictions on coating adhesion to the base materials and cohesion strength are present. Furthermore, hard metals and cermet are employed as wear-resistant coatings where specific characteristics in terms of surface properties, such as hardness, scratch resistance and specific wear resistance, are required. In the panorama depicted by thermal spray, the coatings obtained by CS offer a significantly different picture regarding coating morphology, microstructure and mechanical properties, due to the low temperature and unique solid-state growth mechanism. The severe plastic deformation during impact and growth and the consequent cold working of deposited coatings, as previously discussed in this book, lead, for example, to a significant compressive residual stresses state along the through thickness of the coatings up to the first layer of the substrate (Shayegan et al. 2014) opening, for example, new opportunities to control and enhance the fatigue behaviour. On the other hand, the typically high stiffness and low elongation properties exhibited by cold-sprayed coatings still represent a restriction for many structural applications (Jones et al. 2011).
This section aims to give a survey on mechanical properties of CS coatings; it has the ambition to represent a useful summary for a CS expert as well as a tool to guide students and industrial end users to a rapid understanding of the process characteristics and potentiality for specific industrial applications.
4.3.1 Hardness
Hardness is defined as the resistance of a material to indentation (Rösler et al. 2007); in a coherent manner, indentation is the universally most employed and diffused experimental method to determine the hardness of a material (Revankar 2000). According to ASM international definitions, the hardness (indentation) tests may be classified using various criteria, including in particular the (1) type of measurement and (2) magnitude of indentation load (Kuhn and Medlin 2004).
-
1.
Concerning the Type of Measurement, the more diffused classification criterium distinguishes between the hardness evaluated by the measurement of dimensions of the indentation (Brinell, Vickers, Knoop) and the hardness evaluated by measuring the depth of indentation (Rockwell, nanoindentation).
-
2.
Concerning the Magnitude of Indentation Load, it is possible to define three different classes: macrohardness, microhardness, and nanohardness tests. For macrohardness tests, indentation loads are 1 kgf or greater: Rockwell test (max 150 kgf) and Brinell (max 3000 kgf) tests are generally the most diffused and employed. The microhardness tests (Vickers and Knoop in particular) use smaller loads ranging from 1 gf to 1 kgf, the most common being 25–500 gf. The nanoindentation test, also called the instrumented indentation test, depends on the simultaneous measurement of the load and depth of indentation produced by loads that may be as small as 0.1 mN, with depth measurements in the 20 nm range. Berkovich penetrators are used in these tests (Revankar 2000).
Since the nineteenth century, indentation is carried out on minerals and bulk materials to determine macro hardness (DIN 50359-1 1997) In this case, the volume of material interested by plastic deformation upon indentation and the related indented area are so significant with respect to the material microstructure and (eventual) phase distribution that commonly it is allowed to consider the resulting hardness as a representative average behaviour of the indented material. On the contrary, the hardness determination in thermal spray (TS) and CS coatings is a slightly more slipping field: the low coating thickness avoids the possibility to perform indentation on the surface at high load or penetration depth without including the influence of the substrate (a general rule of thumb suggests that the penetration depth should be no more than the 10 or 20 % of the whole coating thickness in the case of hard coating on soft substrate and soft coating on hard substrate, respectively; Fischer-Cripps 2000); indeed, the tests are generally performed on cross-sectioned and polished coatings and microindentation loads typically range between 25 and 500 gf depending on whole coating thickness and specific characteristics following, for example, the guidelines reported in American Society for Testing and Materials (ASTM) B933-04. The indented area is reduced progressively with indentation load enhancing the hardness reliance on local microstructure, phase distribution and composition. In addition, due to a coating build-up process significantly out of the thermodynamic equilibrium, the use of composite, agglomerated powder feedstock (i.e. agglomerated carbides such as WC–Co, WC–Ni; Ortner et al. 2014) powder blends (Sevillano et al. 2013) or coated powders as well to the presence of specific microstructural features as splats (especially in plasma spray; Pawloski 2008), voids, cold working and strained and fine grains (especially in CS; Papyrin et al. 2007) quite complex and nonhomogenous microstructures are generally exhibited by TS and CS coatings with respect to traditional bulk materials further enhancing local variation of the hardness results and data scattering.
4.3.1.1 Hardness of CS Coatings
In this scenario, micro-hardness of CS coatings is extensively investigated and reviewed in the literature for a wide range of materials (Luo et al. 2014a, b). The microhardness of a metal-based CS coating typically balanced a positive contribution coming from the high particle deformation upon impact and the related cold working that induces an enhancement of coating microhardness in respect to correspondent bulk materials; with a negative contribution coming from the presence of pores and defects that induce a reduction of coating microhardness due to the lack of cohesive strength at the particle–particle boundaries. For these reasons, the ductile materials able to achieve high plastic deformation at low temperature exhibit the highest hardness enhancement with respect to the property of corresponding bulk material. Moreover, the process parameters, able to induce an increase of particle plastic deformation during the coating growth (i.e. carrier gas pressure) and an increase in the final coating compactness, are the ones allowing the achievement of the higher coating microhardness. This behaviour can be evidenced for the deposition of a ductile metal such as pure silver as reported in Chavan et al. (2013) and shown in Fig. 4.33; the experimental trends of microhardness evolution (Vickers penetrator, 100 gf indentation load) as a function of carrier gas temperature and pressure in the range of 250–450 °C and 1.0–2.0 MPa, respectively, (related particle velocity up to 480 m/s) are reported highlighting the beneficial effect of both gas temperature and pressure as beneficial contributions to the increase of particle velocity. Moreover, the mean coating hardness is more than triple the hardness of annealed bulk silver (25 Vickers), thanks to the severe cold working of the ductile particle upon impact.

Behaviour of cold spray silver coating microhardness as a function of a carrier gas temperature and pressure and b corresponding mean particle velocity according to Chavan et al. (2013)
A similar trend is observed in pure copper coatings: The deposition of pure copper coating has also a historical role considering that the whole CS process understanding is essentially based on the deposition of this material; coating microhardness as a function of process parameters are extensively discussed in the case of both high pressure (Stoltenhoff et al. 2001; Schmidt et al. 2009) and low pressure (Papyrin et al. 2007). Luo et al. (2014a, b) recently reviewed the hardness of metal coatings, mainly pure metals, emphasizing the differences among corresponding annealed bulk material, spray powders and as-sprayed coatings as reported in Table 4.1. According to this review, the hardness of copper coatings can be increased by a factor of about 3 as compared to the annealed coarse-grain bulk. A hardness increase by a factor of 2 and 3 was observed for Ni coating compared with initial powder in micrometric grains and annealed Ni bulk, respectively (Ajdelsztajn et al. 2006). Moreover, different materials exhibit different degrees of in situ hardening in comparison to their corresponding starting powders. For pure Ti coatings, a relative reduced hardness increase of ~ 13 % is reported for irregular-shaped powders and 39 % for spherical powders (Goldbaum et al. 2011), while a remarkable hardness increase of around 140 % for Ta coatings was reported (Koivuluoto and Vuoristo 2010a; Koivuluoto et al. 2010b).
Vickers microhardness of commercially pure titanium coatings deposited by using different spray conditions and equipment have been recently reviewed by Hussain (2013). Typical microhardness of a commercially pure grade 1 bulk titanium is about 145 kgf/mm2; that of a gas atomized spherical titanium powder is about 141 kgf/mm2 (Wong et al. 2010), while cold-sprayed coating hardness has been reported ranging between 150 and 320 kgf/mm2 emphasizing how feedstock powders, cold working, coating microstructure and porosity can influence significantly the coating microhardness.
The effect of gas pressure on microhardness of cold-sprayed CP–Al coatings is reported in Lee et al. (2008) who sprayed pure Al with nitrogen as carrier gas and reported coating microhardness ranging from 42 to 55 Vickers for coatings deposited, respectively, at 0.7 and 2.5 MPa carrier gas pressure. Similarly, to other ductile pure metal coatings, the hardness is more than triple of the corresponding annealed bulk material (15 Vickers) confirming the important contribution of particle plastic deformation upon impact. The mechanical characteristics and microhardness of different aluminum alloys coatings such as, for example, A2024, A7075, A6082, A6061, A5083 deposited with both high- and low-pressure CS are extensively investigated and reported by many authors (Stoltenhoff and Zimmermann (2009); Ghelichi et al. 2012; Rech et al. 2011; Ziemann et al. 2014). The behaviour of hardness in alloys and especially precipitation hardened alloys strongly depend on the thermal history of the coating: Generally, gas-atomized powders are employed in CS, thanks to their spherical shape and size homogeneity; gas atomization involves a fast cooling process of the processed material leading to a not-controlled precipitate distribution. For this reason, typical hardness of gas-atomized powders of precipitation hardened alloys are lower than the corresponding thermally treated materials (Ashgriz et al. 2011). During deposition, the cold work hardening due to the high-velocity impact is opposed to the hardness reduction due to a not-optimized coating microstructure. This is true in the case of A2024 as-deposited coatings with respect to A2024-T4 bulk material or A7075 as-deposited coatings with respect to A7075-T6 bulk material (Stoltenhoff and Zimmermann (2009)) just to have two representative examples. It must be highlighted that the mechanical behaviour of CS coatings and heat-treated bulk materials is very different; even if the average hardness can be similar, its origin is completely diverse, while in thermal-treated materials the hardness is due to a precipitation hardening process, and in as-deposited CS coatings the hardness is only the effect of cold working and strain hardening. In this sense, pointing the attention on microhardness, the CS deposition is able to induce a significant increase in microhardness with respect to the initial powder value even if this enhancement is often not enough to balance the values achieved in thermally treated alloys.
The effect of using pure helium or helium/nitrogen mixtures, rather than nitrogen as a gas carrier, on coating microhardness has been studied in Balani et al. (2005b) on as-deposited A1100 alloy coatings revealing, as expected, the beneficial effect of helium on obtaining more compact and hard coatings, thanks to its higher sonic velocity with respect to nitrogen (or air), leading to a better performing CS process as a whole, increasing process efficiency, general coating quality, microstructure and mechanical properties. However, the extreme cost/benefit balance has led to a continuous replacement of helium with nitrogen as discussed in this book.
Hardness has been reported to increase with the particle velocity or rather with carrier gas temperature and pressure also in the case of AISI304 stainless steel coatings in Meng et al. (2011a) the coatings have been sprayed with Kinetik-3000 deposition using nitrogen at 3.0 MPa in the temperature range 450–550 °C. Starting from gas-atomized powders with hardness of 171 Vickers (50-g indentation load), a coating microhardness (200-g indentation load) up to 267 Vickers is obtained. Villa et al. (2013) deeply investigate the microhardness of AISI316 stainless steel as a function of spray parameters confirming that the optimized coating hardness, up to 358 Vickers, is roughly the double of the initial particle hardness. This study further emphasizes the effect of local coating microstructure on hardness by performing several hardness maps by using nanoindentation and confirming the significant detrimental influence of porosity, defects and particle borders on local hardness. The Vickers microhardness (300-g indentation load) of Cu, Ni and Zn coatings deposited by low-pressure CS on both Cu and steel substrates is reported in Koivuluoto et al. (2008a, b) resulting, respectively, 105 (Cu), 120 (Ni) and 57 (Zn) Vickers. The microhardness of CS coatings of Ni and Co superalloys is also reported by many authors, for example, in the case of Waspaloy (Vezzu et al. 2014), Stellite (Cinca and Guilemany 2013), Inconel625 (Poza et al. 2014) and Inconel718 (Levasseur et al. 2012).
The effect of standoff distance on coating microhardness is studied in Li et al. (2006) in the case of pure metals, Cu, Al and Ti, resulting that despite the decrease of the deposition efficiency (DE), the coating microhardness is essentially not influenced by the standoff distance in the range of 10–110 mm.
Post-deposition thermal treatments are often performed on CS coatings in order to compact the microstructure, promote the metallurgical bonding at the particle–particle interface hence increasing tensile properties. The annealing is always reported to induce a reduction in coating microhardness due to the relaxation of peening stress and cold working (Meng et al. 2011b; Levasseur et al. 2012; Coddet et al. 2014; Bu et al. 2012a).
Despite the large amount of CS parameters and other process conditions, such as, for example, feedstock characteristics, realization of pre- and/or post-deposition treatments on both powders and coatings; some trends can be pointed out to fix some useful even if approximate rule of thumbs. For example, generally the coating microhardness increases with the extent of particle plastic deformation upon impact. For this reason higher is the particle velocity higher is the resulting coating microhardness. In this sense, particle morphology can play a significant role in determining coating microhardness; indeed, irregular particles can reach higher in-flight velocity, thanks to the more effective drag coefficient with respect to spherical particles. At the same time, the use of low hardness powder feedstock, for example, obtained by realizing a thermal annealing on feedstock powders (Li et al. 2013; Ko et al. 2014) or by using dendritic feedstock produced by electrochemical processes can generally enhance the plastic deformation capability of particles upon impact leading to higher strain rate during the coating growth and as a consequence higher enhancement of microhardness in respect to particle hardness. Wong et al. (2013) investigated these effects in the case of titanium CS coatings by using different powders feedstock and spray parameters and summarize their results in the behaviour of coating microhardness as a function of the particle velocity/critical velocity ratio as shown in Fig. 4.34. A slight progressive increase of coating microhardness is reported, increasing the ratio between particle velocity and critical velocity. Moreover, higher coating microhardness can be obtained starting from softer and irregular feedstock as in the case of sponge or irregular titanium with respect to spherical gas atomized.

Behaviour of coating microhardness and coating microhardness/powder microhardness ratio for cold spray Ti coatings deposited by using different feedstock and process parameters according to Wong et al. (2013)
The low temperature and solid-state coating growth mechanism allows to take advantage of using temperature-sensitive feedstock. For example, fine composite or agglomerated powders or even nanostructured powders are able to exhibit superior hardness with respect to traditional powder feedstock; however, this hardness is strongly affected by a temperature rise leading to the impossibility to profit of this property when processed by traditional thermal spray techniques. In this field, CS is reported to be really effective (Kim et al. 2005; Jodoin et al. 2006). For example, ball milling of alloys A5083 powder under liquid nitrogen is reported to achieve a nanocrystalline grain size in the range of 20–30 nm and the nanocrystalline grain structure of the cryomilled feedstock powder was proved to be retained after the CS process (Ajdelsztajn et al. 2005). The resulting microhardness enhancement is significant, from 104–261 HV(300 g), comparing the nanocrystalline coating with cast, cold worked, A5083. Generally, the superior hardness and stiffness of nanostructured powders lead to a lower particle plastic deformation upon impact, and for these reasons, the as-sprayed CS coatings have more porosity in comparison to the ones obtained with traditional gas-atomized powder. In this sense, the presence of porosity and microstructural defects is detrimental for both structural properties and microhardness so that the final coating behaviour is the result of a beneficial effect of superior properties of initial powder and a negative effect of reduced compactness of the microstructure and the effectiveness of using nanostructured powders need to be evaluated case by case.
4.3.1.1.1 Depth-Sensing Indentation
Depth-sensing indentation or instrumented indentation consists of a traditional indentation test in which the applied normal load and the displacement are continuously detected and collected during the test, resulting in a loading and unloading indentation curves. For both curves, the instrumented indentation can produce an accurate and complete sampling of the load (L) versus penetration depth (h; Fischer-Cripps 2005, 2011). The current main application of depth-sensing indentation is upon low load condition when the size of the indent is too small to be observed and detected by optical microscopy as in microindentation and when the mechanical behaviour of the indented material cannot be considered fully plastic due to the significant contribution of the elastic recovery. This is the case of nanoindentation where the indentation load typically ranges between 0.1 mN up to 0.5 N and the penetration depth ranges between a few tens of nanometers up to some microns. Nanoindentation is widely used in coating technology and surface engineering, and up to now, it is increasingly being considered due to the powerful new instrumentations and its wide diffusion. The measured indentation curve is a function of the mechanical properties of the tested specimen; therefore, if an inverse analysis method can be found, the mechanical properties of the tested specimen can be predicted from the measured indentation curve. Today, this is generally performed by using the Oliver and Pharr theoretical model and method that has been developed in 1994 (Oliver and Pharr); a schematic load-displacement indentation curve is shown in Fig. 4.35 for an elastic–plastic specimen. Upon loading, there is an initial elastic response followed by elastic–plastic deformation. Load is increased up to his maximum value, P max, with the correspondent depth, h max. The test can be either a load-controlled or depth-controlled setting, respectively, a maximum indentation load (depth will be determined as a consequence) or maximum penetration depth (load will be determined as a consequence). Once the maximum load (or depth) has been reached, the load is optionally kept constant for a dwell time, and after that removed progressively leading to the unloading curve. Upon unloading, there is first the elastic recovery wherein the dP/dh behaviour, S, is rather constant, followed by elastic–plastic deformation as schematically shown in Fig. 4.31. Finally, upon complete unload, there is a residual impression of depth h r employed to estimate the material’s hardness. An estimation of reduced elastic modulus, E r, defined as E r = E/1−ν where E is the elastic modulus of the indented material and ν its Poisson coefficient, is obtained from the slope S (approximation of linear behaviour) or fitting with a quadratic function the first part of the unloading curve.

Schematic illustration of indentation load-displacement curve showing important measured paramters. (Oliver and Pharr 2004)
In the practice, some types of discontinuities can be encountered in load-displacement curves, and the more observed are pop-in and pop-out events which are sudden displacement excursions into the target materials during load-controlled experiments. Pop in is observed in the loading curve while pop out in the unloading as shown schematically in Fig. (4.36a, b). Both pop-in and pop-out events are generally associated with dislocation nucleation and movement, phase transformations and crack nucleation and propagation (pop in especially) in bulk defect-free materials (Fischer-Cripps 2011). However, talking about materials coming from P/M and thermal spray coatings pop-in events can be considered a qualitative index of coating cohesion and particle–particle bond strength; indeed, in presence of porosity or no compact microstructure, the indentation can often induce a collapse of the material highlighted as a sudden displacement excursion in the loading curve; as these events are more frequently observed and appears more pronounced, they reveal a lack in microstructure compactness and particle–particle cohesion.

Most encountered discontinuities in load-displacement curves a pop-in event and b pop-out event
The possibility to vary the loading rate during the indentation can be used experimentally to induce different amounts of work hardening upon indentation. Generally, this phenomenon can be avoided or eventually must be considered to properly fit the curve and produce indentation results and for this reason is normal procedure to set the loading rate as high as necessary to avoid the development of work hardening; however, on the other hand, this can be also used to deeply investigate the work-hardening effect as reported, for example, in Kim et al. (2010) where a prediction of the work-hardening exponents of metallic materials has been performed. This has been obtained by means of atomic force microscopy observations of residual indentation impressions in sharp indentation (Kim et al. 2010). These methods are not yet exported and applied in the characterization of thermal spray coatings, even if the amount of work hardening plays a crucial role, especially in CS deposition both by giving information about the particle deformation upon impact and by having important correlation with coating properties, so that a progressive development of these procedures in the near future can be expected.
4.3.1.1.2 Depth-Sensing Indentation on CS Coatings
Instrumented indentation and nanoindentation is also useful and fruitful in mechanical characterization of local features in thermal spray and CS coatings. The low size of the indents enhances the spatial resolution of this mechanical investigation opening the opportunity to emphasize local differences, highlight nanostructuring effect or look for correlation between coating microstructure and mechanical properties, especially hardness. Furthermore, the method can be useful for the investigation of composite and multimaterial coatings. For example in Yan et al. (2012), the conditions of applying the Olver–Pharr method to the nanoindentation of particles in composites is investigated, and the limits in which the accuracy of the measure is acceptable in the case of both soft particles in stiff matrix and stiff particles in soft matrix are defined. Berkovich nanoindentation test have been performed in Bae et al. (2012) and Zou et al. (2010) on nickel cold-sprayed coatings, and both highlighted inhomogeneity of the nanohardness values within the particles. The hardness in the vicinity of Ni particle interfaces is higher than that in the particle interior, and this difference is attributed to the CS-induced grain boundaries and dislocation densities. Wang et al. (2013) carried out nanoindentation in order to investigate the effect of localized deformation on mechanical properties of aluminum particles in composite Al–Al2O3 CS coatings. The effect of the indentation load on the hardness measurements on CS Ti coatings, referring to the Nix–Gao model is reported in Goldbaum et al. (2011) and Ajaja et al. (2011). This model accounted the effect of the penetration depth on the hardness measurement, and it is based on a consideration of strain-gradient plasticity. The true hardness, H 0, or rather the hardness at infinite depth, is related to the measured hardness H and the penetration depth, h, and a characteristic length scale, h*, following H = H 0(1 + h*/h)1/2. The true hardness can be obtained by fitting a set of indentation data obtained at different depths as reported in the case of CS Ti coatings in Ajaja et al. (2011). True hardness is reported to be higher with respect to bulk hardness and strictly related to the porosity and presence of defects in the coating. Tantalum cold-sprayed coatings were studied by depth-sensing Berkovich indentation testing in Bolelli et al. (2010). The mechanical properties of the coatings were found to be free of any scale dependence, insensitive to the presence of a lamellar structure, indicating strong, tight bonding between cold-sprayed Ta particles. Again, due to the low size of the indent, depth-sensing indentation represents a useful tool for the realization of high-resolution depth profiles. For example, Poza et al. (2014) reported the evolution of hardness and elastic modulus across a laser remelted track of an Inconel625 coating deposited by high-pressure CS, while in Liang et al. (2011) nanoindentation investigation is performed to distinguish hardness of different areas of Co-based cold-sprayed coatings.
4.3.1.1.3 Depth-Sensing Indentation on Feedstock Powders
Due to the reduced size of the indent, nanoindentation can also be performed on feedstock powders. Different techniques of sample preparation for magnetic and nonmagnetic abrasive particles, taking into account the deformation of the embedding medium, are reported in Shorey et al. (2001). It is important in the presence of an embedding matrix to consider that a particle could be pushed into the embedding medium under the influence of the indenting load rather than plastically deform itself. In that case, there is an overestimation of the penetration and residual depth and as a consequence an underestimation of the hardness. Hryha et al. (2009) also discussed the influence of the stiffness of the embedding resin on the indentation hardness and modulus with a special focus on metal powders.
4.3.1.1.4 Depth-Sensing Indentation with Spherical Indenter
Depth-sensing indentation performed with spherical indenter can also be employed to have an estimation of the strength of materials. Assuming plastic hardening of metals as described by the Hollomon stress–strain curve in the form:
where σ 0, k and m are the material parameters and can be identified from spherical indentation tests by measuring compliance moduli in loading and unloading of the load–penetration curve. Several empirical relationships have been proposed for directly correlating hardness with yield and tensile strengths as reported, for example, in Tabor (1951), Shabel et al. (1987), and Fischer-Cripps (2000) and in this sense, the introduction of the instrumented indentation testing machines made many details of the indentation process to be available and stimulated a great effort to develop more refined procedures (Au et al. 1980; Nayebi et al. 2001; Taljat et al. 1998) for getting more accurate estimates of the elastic–plastic properties. The load-displacement curve depends on several physical properties of the tests, but it is mainly affected by the uniaxial stress–strain (σ–ε) curve of the sample material. Some authors as reported, for example, in Fischer-Cripps (1997) used the slope of the load-displacement curve produced during loading to estimate plastic flow properties and deduced the Young modulus by the slope during unloading (Huber et al. 1997; Nayebi et al. 2002). Beghini et al. (2002, 2006), performed an extensive parametrical finite element analysis of the spherical indentation in order to study the dependence of the crater shape to the yield stress and strain hardening and proposed a direct method for deducing the σ–ε curve of a material from load-displacement curves. An approach based on the direct correlation between the load-displacement curve and σ–ε curve was also applied in Nayebi et al. (2001) for characterizing surface structurally graded materials.
Concerning the application of these concepts and models on coatings and CS coatings in particular, it must be stated preliminarily that all estimations are accurate as much as the coating properties and mechanical behaviour approach the properties of the correspondent bulk annealed material. This is generally false due to the presence of porosity and defects, splats, interparticle debonding and other specific microstructural features of CS coatings; however, in the case of pure metal coatings with ductile behaviour, these differences are almost levelled leading to the opportunity to obtain quite accurate results. For example, in Bolelli et al. (2010), the spherical indentation tests are applied according to the multiple partial unloading method by Field and Swain ((1995) on a cold-sprayed tantalum coating behaving as a bulk material, in order to obtain stress–strain curve and elastic modulus with very promising results. One limitation of the analysis is its inability to provide a direct quantification of the yield strength (YS) of the material, because the experimental data points obtained by spherical indentation depart significantly from the elastic regime. So that, these models and procedures can be very useful to predict tensile properties with a direct, quick and nondestructive technique; however, the necessary assumptions of ideal bulk material behaviour is mainly too radical in the case of thermal spray and CS coatings hiding that it is risky to obtain poor accuracy results.
4.4 Strength and Elastic Properties
The assessment of strength and elastic properties represent a fundamental issue to describe the mechanical behaviour of a coating material. Generally, tensile tests are used to obtain a stress–strain curve from which these properties can be deduced. A schematic stress–strain curve is shown in Fig. 4.37 in the case of ductile and brittle material; some critical parameters are defined to describe quantitatively the mechanical behaviour of the material: The critical stress to produce appreciable (0.2 % in most case is considered) plastic deformation (YSσy); the fracture stress (σf) or the maximum stress beard by the material until breaking (ultimate tensile strength, UTS), respectively, for brittle and ductile materials. Further, information concerns the elastic behaviour (Young or Elastic Modulus, E) according to Hooke’s law as well as plastic behaviour in terms of ductility (how a material can deform before fracture), resilience (the capacity of a material to absorb energy when it is deformed elastically) and toughness (the energy required to cause fracture) (Rösler 2007).

Typical stress–strain curve in the case of a ductile material and b brittle material
Tensile tests are widely used to select material for structural and engineering applications, also the test may be used to compare different materials under loads characterizing the main mechanical properties and the quality (Davis 2004). Typical tensile specimen (Fig. 4.38) has enlarged extremity for the locking to the tensile machine grips and a gage region with more restricted section where the deformation and break can take place. The two regions are properly connected and dimensioned to avoid any loads effects outside the gage length. Several standard tests, ASTM and DIN EN, describing specimen type and procedures are available with specimen shape ranging from cylindrical to flat and size from few millimetres up to many centimetres (Fig. 4.34).

Tensile test specimens specification according to ASTM E8-04. a Flat and b cylindrical specimens
4.4.1 Tensile Testing on Thick Coatings
Among the procedures defined across the centuries to mechanically characterize materials and metallic materials in particular, there are a few that are extended and customized for coating and coated specimens as well. First, it must be distinguished if the objective of the investigation is (1) the mechanical behaviour of the coating material itself or (2) the mechanical behaviour of the coated system. (1) The more employed and accurate way to assess tensile test and obtain stress–strain curve is by the micro-flat tensile (MFT) test. (2) Some specific procedures have been developed to investigate the mechanical behaviour of the whole-coated system by either obtaining a full stress–strain curve or only have ultimate strength such as 3- and 4-point bending test, tubular coating tensile (TCT) or the use of notched dog-bone specimens.
4.4.1.1 MFT Test
MFT test performed following the guideline of ASTM E8-04 is commonly used in powder metallurgy products to obtain an estimation of the intrinsic properties of deposited (compacted) material. The preparation of the specimen can be a problematic issue requiring the production of a several millimetre thick coating, removal of the coating from the original substrate and properly machining to obtain a freestanding specimen totally composed of the deposited material with shape and size according to the ASTM procedure. A CS-deposited coating can behave like a brittle material in particular when depositing high-strength and low-ductility materials such as hard steel, Ni and Co superalloys. In that case, diffused porosity is located at the particle–particle boundaries leading to weak cohesive strength and plastic deformation capabilities promoting crack propagation and brittle fracture (Vezzu et al. 2014; Levasseur et al. 2012). For these reasons, the MFT test is generally limited to investigate the behaviour of as-deposited coating of ductile materials, or on the other hand, it is devoted to investigate the evolution of cohesive strength when post-deposition annealing treatments are performed on as-deposited coatings as reported, for example, in Yu et al. (2011). This is of particular interest when CS has the ambition to be employed in structural application (Jones et al. 2014) or as a rapid manufacturing technique (Ajdelsztajn et al. 2005; Sova et al. 2013b).
4.4.1.2 TCT Test
Schmidt et al. developed a customized tensile test specifically designed for thermal spray and CS coatings: the TCT (Schmidt et al 2006a, b). The TCT test can be used to determine cohesive strength and have an estimation on UTS of the coating material. The test is not yet classified with an official norm even if its use is rather diffused and consolidated in thermal spray and CS community. The specimen preparation and testing procedure is schematically shown in Fig. 4.39: A pair of cylinders is coupled and joined by an inner screw; the coating is deposited along the external surface of the specimen so that once the inner screw is removed, the coating is the only support of the two-parts specimen. The cylinders are then gripped by screws to the universal test machine and subjected to tensile load until the coating failure occurs. The main advantage of using TCT test is certainly the quickness with respect to MFT; however, it has to be mentioned that the geometrical design of the two-coated substrates leads to a stress concentration in the pulled coating. This stress concentration increases the Mises stress at the gap between the substrates to a factor of 1.5–1.7 of the average Mises stress in the pulled coating. As a consequence, the measured coating strength has to be multiplied with this factor to get a tensile strength value, which is comparable to conventional tensile tests (MFT test). This was also proved experimentally by correlating strength values determined by the MFT and the TCT tests. Moreover, thanks to the current wide diffusion of the test, raw data are also used with the label TCT strength enabling a faster process control and optimization. Coating roughness and waviness can complicate the determination of the coating cross-sectional area and can influence the obtained coating strength value. If coating roughness or coating waviness is more than one fifth of the coating thickness, it is recommended that the coating surface be machined.

Sample preparation and testing procedure for the TCT test according to Schmidt (2006a)
4.4.1.3 Bending
Measurements of bending strength and modulus of elasticity in bending should be made in principle for materials whose principal stressing mode is bending. According to ASTM E855-08, three procedures are considered: (1) cantilever beam, (2) 3-point bending and (3) 4-point bending, where only (2) and (3) are employed in coated systems. The beam is positioned on a two-roller support and is subject to a normal load focussed in the central position (3-point test, procedure A—Fig. 4.40a or focussed in two positions at a fixed position close to the centre (4-point test, procedure B—Fig. 4.40a. The beam can be a freestanding coating or more generally a substrate coated on one side; in the last case, the position of the coated face will determine the sense of the load as represented in Fig. 4.40b: Towards the roller support, the coating is subject to tensile load, while its opposite face is under compression.

Schematic representation of bending or flexural test a 3- and 4-point-bending configuration and b tension and compression stress state on bending a beam
The preparation of coated specimens to perform a bending test is quick as well as the testing procedure by using a universal tensile equipment. A stress–strain curve of the whole specimen (coated specimen) can be obtained and an estimation of flexural strength and flexural strain according to the formula reported, for example, in Davis (2004).
4.4.1.4 Other Procedures
Shear strength is used sometimes to investigate the adhesion and cohesion of thick coatings by following commonly the guidelines of DIN EN 15340, and a specific application in the case of CS coating is reported, for example, in Binder (2011). The use of ring test is also reported in Coddet et al. (2014) even if high coating thickness must be produced.
4.5 Influence of CS Parameters on Coating Strength
The influence of CS deposition parameters on the strength of the deposited coatings have been extensively studied by Schmidt et al. (2006a) for pure copper coatings. A significant relation between the DE and coating strength has been first emphasized by mapping the variation of these properties as a function of process gas temperature as shown in Fig. 4.41. A − 38 + 11-μm Cu powder feedstock was sprayed using nitrogen at 3.0 MPa as process gas. The DE is reported to grow linearly up to achieve a saturation limit, then the slope of the curve is strongly reduced, and only a slight increase is observed for further enhancement of the process gas temperature. On the contrary, the TCT strength trend is reported to grow slowly up to the DE saturation limit and then to increase suddenly its slope as the process gas temperature is further increased. This behaviour is essentially motivated by considering the particle–particle bonding mechanisms: While in the region of low process gas temperature the total impact energy (and momentum) of the incoming particles is mainly devoted to increase the amount of successfully stuck particles when the efficiency is saturated, further providing impact energy and momentum enable us to improve the quality of the bonding, enhancing the particle plastic deformation and promoting the well-known interfacial shear mechanisms responsible of coating adhesion and particle–particle bonding (Assadi et al. 2003).

a Coating strength, determined by tubular coating tensile (TCT) tests. b DE as a function of the process gas temperature. (Schmidt et al. 2006a)
The statements regarding the mechanical strength behaviour are further confirmed by comparing the stress–strain curves of copper coatings obtained with standard and optimized conditions (optimized conditions mean higher process gas temperature and powder injection in elongated preheated chambers as in currently manufactured stationary deposition equipment) or rather with spraying conditions before and after the critical point highlighted in Fig. 4.41. Stress–strain curves are obtained by performing MFT test and are shown in Fig. 4.42. The specimen prepared with standard spraying conditions results an UTS of 57 MPa after reaching an elongation of only 0.08 %. The Young’s modulus was determined to be 71 GPa, being much smaller than the reference data for copper from the literature (125 GPa). On the other hand, the specimen prepared with optimized conditions results an UTS of 391 MPa at corresponding elongation of 0.63 %, demonstrating properties close to highly deformed bulk material. In agreement, the measured Young’s modulus of 117 GPa is similar to the literature value for copper. Again, the fractographic investigation revealed that optimized coatings show dimples and strong particle–particle bond strength, while standard coatings are essentially cleaved along the particle–particle boundaries as reported in Schmidt et al. (2006a).

Stress–strain curves of MFT tests for a coating sprayed using standard or optimized conditions. (Schmidt et al. 2006a)
It is then possible to summarize that cohesive strength progressively increases as the particle impact conditions exceed the critical conditions (i.e. critical velocity) to enable particle sticking and efficient coating growth. This is true as long as the conditions are within the deposition window as defined in (Schmidt et al. 2006b; Assadi 2011). On the contrary, if the particle velocity goes beyond the limit of the deposition window, then the mechanical properties fall down mainly due to the strong coating erosion and the development of noticeable residual stress combined with a loss of bond strength.
4.6 Influence of Powder Characteristics
CS is extremely sensitive to the quality and characteristics of powder feedstock deriving from the key role of particle impact temperature and velocity on the coating growth mechanism. As discussed above, the coating quality and the strength and mechanical properties in particular are also strongly related to particle impact parameters and plastic deformation phenomena. So that, as the powder feedstock characteristics influence the particle impact velocity and temperature, they also play a role on the cohesive strength of the deposited coating.
First of all, particle size and density are effective in changing the drag efficiency, the in-flight particle velocity and the interaction with the bow shock, hence the deceleration and deflection of the impacting particle close to the substrate zone. The effectiveness of coarser particle in the enhancement of the TCT strength is reported in Assadi et al. (2011) in the case of pure copper and pure titanium coatings. The strength is plotted against the particle velocity and the v p /v cr parameter, or rather the ratio between particle impact velocity and critical velocity, meaning the amount of particle velocity exceeding the critical velocity for the specific deposited material. Indeed, while the average particle size, studied in four different size distributions in the case of copper from − 5 + 25 µm to − 105 + 45 µm, and two different size distributions in the case of titanium 33 and 45 µm, seems to be not influent in changing the DE; it has a not-negligible effect in the coating strength behaviour (Figs. 4.43 and 4.44) or rather, a lower particle velocity is required to ensure the growth of high-strength coatings. However, this effect is still included in the function of the particle velocity when plotted against the v p /v cr resulting in a linear trend as detailed in Assadi et al. (2011).

Measured values of the cohesive strength of cold-sprayed copper coatings, as plotted against a particle impact velocity and b the ratio of particle impact velocity to critical velocity. (Assadi et al. 2011)

Measured values of the cohesive strength of cold-sprayed titanium coatings, as plotted against a particle impact velocity and b the ratio of particle impact velocity to critical velocity. (Assadi et al. 2011)
The beneficial effect of using coarse particles is also reported in the case of pure Al coatings deposited with a size distribution of the powder feedstock as − 105 + 63 µm (Van Steenkiste et al. 2002). Stress–strain curve is reported in Fig. 4.45 resulting in a mechanical behaviour similar to the corresponding bulk material and, in particular, 56 and 90 MPa, respectively, YS and UTS. YS ranges between the values reported in the case of both bulk aluminium, 35 MPa, and cold-worked aluminium, 106 MPa, certainly more close and representative of the CS deposition process and coating microstructure.

Tensile testing of a kinetically (low-pressure cold spray) sprayed Al coating produced at a temperature of 288 °C. (Van Steenkiste et al. 2002)
The particle shape as well can influence in particular the drag mechanism of the particle into the nozzle and as a consequence their exit velocity. This effect is put into evidence in Wong et al. (2013) comparing the performances of spraying commercially pure titanium (CP-Ti) powders with spherical, irregular and sponge feedstock. There are no results in terms of coating strength in this study; however, DE trends as well flattening ratio and microhardness are reported, considering that the previous discussion can represent a plausible basis to predict also the evolution of cohesive strength.
Particle surface oxidation must also be considered when talking about coating and the influence on cohesive strength (Jeandin et al. 2014). It is reported that the oxide layer that naturally covers the particle can be broken upon high-velocity impact (Li et al. 2010; Yin et al. 2012); however, part of the cracked oxide is entrapped in the coating microstructure mainly in the central zone of the plastically deformed particle because the outward metal jet only forms at the peripheral region of the interface (Yin et al. 2012). This hard oxide creates a barrier to the particle–particle bonding leading to a detrimental effect on coating strength and ductility. So that a careful selection of the initial feedstock, manufacturing and storage conditions as well as spraying parameters are fundamental to preserve as much as possible a low oxygen content that is mandatory to avoid the growth of surface oxide layers, in order to obtain high-strength coatings and ensure a good reliability on the obtained results.
4.7 Influence of Deposition Strategy
The influence of deposition strategy in terms of spray angle, gun transverse velocity and standoff distance on CS coating microstructural and mechanical properties have been extensively reported in the literature even if it is not yet completely clarified. There are several studies focused, for example, on standoff distance (Li et al. 2006), spray angle (Li et al. 2007a, b) or coating build-up (Rech et al. 2014); however, there are many parameters to take into account such as powder and substrate material and characteristics, spray parameters, nozzle type and shape, powder injection geometry, substrate size and thermal properties, etc. So, it is very hard to identify some generalized guidelines, and in the practice, each CS performer develops his own technical know-how based on specific deposition process and final application.
Within this scenario, some examples can be reported to introduce the discussion about the influence of the deposition strategy; for example, the effect of spray angle on the coating strength of titanium coatings is reported in Binder et al. (2011), where a reduction of TCT strength is observed as a function of the particle incidence angle. TCT strength is reported to be reduced from about 290 MPa (perpendicular incidence) down to about 90 MPa (45° incidence), and this detrimental effect is explained by the reduction of perpendicular component of impact velocity. Indeed, several coating characteristics, such as porosity, shear strength and TCT strength, plotted against the ratio v p90/v cr, where v p90 represents the perpendicular component of the particle velocity showing the expected linear trend. It is interesting to emphasize the behaviour of TCT strength as a function of porosity (Fig. 4.46), where the increasing porosity combined with a larger average size of the pores account for the decrease of the coating strength due to the promotion of particle–particle debonding and crack nucleation.

Correlation between tubular coating tensile (TCT) strength of Ti coatings and porosity. The coatings were cold sprayed with nitrogen using a gas temperature of 1000 °C and a gas pressure of 4 MPa. (Binder et al. 2011)
Coating thickness (0.5–2.0 mm) and gun transverse velocity (the 2.0-mm thick coatings were deposited with a slow single pass to four faster pass) effect on tensile properties of cold-sprayed A6061 coatings have been recently reported in Rech et al. (2014). Four-point bending test by following E855/90 guidelines have been used to obtain stress–strain curves. Despite the cohesive strength reported to be essentially unaffected by the coating thickness and the deposition strategy (i.e. number of pass to deposit the coating), a difference is emphasized in coating microstructure and fracture analysis. Once the applied load is sufficient to promote crack nucleation and first stage of propagation, the thick coating deposited with a single pass exhibits no opposition to the crack propagation until the interface with the substrate is reached and sudden fracture of the coating is observed. On the other hand, the coatings deposited by a multi-pass strategy exhibit barrier properties to the crack propagation, thanks to the presence of more interfaces between subsequent passes as observed in multilayer coatings deposited with other techniques (Tjong and Chen 2004).
4.8 Effect of Post-annealing on Strength
A tailored process optimization and an appropriate selection of feedstock material and deposition strategy generally represent a valid solution to achieve a coating cohesive strength sufficient for several industrial applications in particular regarding the deposition of ductile metals such as pure copper or aluminum. On the contrary this is certainly necessary but not sufficient when approaching high-strength coating materials as Ni or Ti alloys. In this case, the particle plastic deformation upon impact is lower due to the higher YS, in particular in the range of impact temperature, leading to the development of more porosity and lower bonding at the particle–particle interface. These concepts are essentially represented in the simulated coating cross section obtained by a multi-impact calculation for different material combination under identical impact condition as shown in Fig. 4.47 (Schmidt et al. 2009).

2D simulation of a multi-impact scenario calculated for different material combinations under identical impact conditions. The initial impact temperature was set to 20 °C and particle impact velocities ranged between 400 and 650 m/s depending on particle diameters. Particle sizes were varied in range between 8 and 50 lm. a Cu on steel 316L. b Steel 316L on steel 316L. c Ti–6Al–4V on steel 316L. (Schmidt et al. 2009)
While copper on steel is characterized by significant plastic deformation and compactness of the microstructure, this is not the case with AISI316L and especially Ti–6Al–4V coatings where significant porosity is observed and the negligible particle–particle deformation will be responsible for a low cohesive strength of the coating.
This preamble gives the basis to a twofold development in order to enable CS for the deposition of high-strength materials: on the one hand, the run to enhance the performance of the deposition equipment (i.e increase of particle velocity by allowing higher process gas pressure and temperature), on the other hand, the investigation about the opportunity to perform post-deposition annealing to consolidate the microstructure and promoting a sintering process. Regarding the second topic, several attempts are reported in the literature confirming the beneficial effect of post-deposition annealing on both cohesive strength and elongation properties of deposited coatings.
As for any powder metallurgy product, the sintering process of a CS coating can be performed but it must be done carefully: Vacuum or at least oxygen-free atmosphere (i.e. argon, nitrogen) heat treatment is generally operated in order to prevent the formation of an oxide layer outward the particle surface avoiding the formation of sintering necks. Annealing temperature as low as possible is advisable in order to avoid distortion and residual stress development and, last but not least, to preserve part of the beneficial effects of using a low-temperature deposition technique such as, for example, an average compressive residual stress, a very fine microstructure and superior coating hardness. Moreover, even if beneficial, the realization of a post-deposition thermal annealing can be difficult or often unaccepted by the industrial point of view due to the component size or base material or even specific production process.
Bearing this in mind, the beneficial effect of thermal annealing on strength and elongation properties is reported by many authors: Meng et al. (2011a) reported the enhancement of UTS and elongation after fracture of AISI304 CS coatings evaluated by MFT after 1 h annealing performed in vacuum at 10−3 Pa. Annealing treatment is reported to induce the atom diffusion through the interface between the particles so changing the particle–particle interface from pure mechanical interlocking bonding to metallurgically bonding through the progressive achievement of a sintering process as confirmed by a fractographic study. Moreover, the diffusion also reduced the potential crack nucleation sites which were present in the as-sprayed coatings enhancing the ultimate strength of the as-sprayed coating up to five times in the case of 900 °C annealing as shown in Fig. 4.48. However, the annealed coatings always contained some defects such as medium-size pores coming from the coalescence of coating microporosity and the agglomerated oxide particles, and these defects would induce the fracture taking place in advance. Therefore, the ultimate strength and the elongation of the annealed coating were lower than that of the bulk 304 stainless steel (SS). This behaviour is more or less observed also in the case of other coating materials such as Cu–0.5Cr–0.05Zr (Coddet et al. 2014) and Cu–4Cr–2Nb (Yu et al. 2011).

The stress–strain curves of pure copper coatings deposited before and after 1 h thermal annealing in vacuum are shown in Fig. 4.49 (Gärtner et al. 2006). In addition to the previous considerations, the initial coating microstructure is reported to be fundamental to lead the annealing treatment more effective in increasing cohesive strength. In this sense, cold-sprayed coatings processed with helium show a similar performance as highly deformed bulk material and also after subsequent annealing, strength and elongation to develop failure in a similar manner as for cold-rolled sheets leading to elongation up to 35 %. Nevertheless, cold-sprayed coatings processed with nitrogen show brittle failure under relatively low tensile stress and also after thermal annealing; only the closure of particle–particle interfaces which are just under compressive contact is observed and therefore the higher elongation to failure in particular is (only) around 8 %.

Stress–strain curves of cold-sprayed coatings produced with before and after 1-h annealing in vacuum at different temperature. Coatings have been deposited using process gas a nitrogen and b helium. (Gartner et al. 2006)
Moving to higher-strength materials the pressureless sintering of Inconel718 CS coatings is discussed in Levasseur et al. (2012) and Wong et al. (2012). Again, the influence of initial coating microstructure is reported to be essential in order to promote metallurgical bonding at the particle–particle interface and the coatings deposited with higher impact velocity can benefit more effectively of the annealing treatment reaching ultimate tensile stress and elongation up to 763.6 MPa (62 % of the corresponding bulk material) and 24.7 %, respectively (Wong et al. 2012), as shown in the stress–strain curve in Fig. 4.50.

Stress–strain curves of In718 cold spray coatings after different thermal annealing. (Wong et al. 2012)
The influence of heat treatment on CP-Al coatings deposited by low-pressure CS as a function of the mechanical loading under 4-point bending test is reported in Ogawa et al. (2008). It is interesting to notice (Fig. 4.51) that under compressive loading, the effect of thermal annealing on stress–strain curve is negligible, while under tensile loading the effectiveness is evident. The explanation of this behaviour is based on the mechanism of cohesive failure that is due to the formation and propagation of vertical cracks starting from porosity or microstructural defects and propagating through the coating thickness; in this sense, under compressive load, this specific mechanism is not involved leading to a good mechanical behaviour also for as-sprayed materials.

Results of 4-point bending tests of heat-treated specimens. a Compressive loaded. b Tensile loaded. (Ogawa et al. 2008)
Summarizing, a tailored annealing treatment is beneficial for the cohesive strength of a CS coating, thanks to the promotion of atomic diffusion at the particle–particle interface and consequent activation of a sintering process. The initial coating quality, in terms of microstructure compactness, low porosity and initial strength, is fundamental to enable the diffusion and preventing the oxidation at the particle–particle interface. So, all efforts to obtain a full-density as-deposited coating are twofold essentially to provide high-strength-coated materials both before and after thermal annealing. Finally, the coating performances in terms of strength are generally lower or much lower than the corresponding bulk materials due to the embedding of oxide and residual porosity that play an active role in the formation and propagation of cracks.
4.9 Residual Stresses
This section deals with a general description of residual stress phenomena during cold spraying. More specific information on residual stresses is also found in Chap. 5. Residual stress can be found in the surface of practically every material. Stress is the result of surface and bulk treatments by mechanical, thermal or chemical means, either alone or in combination. Residual stresses develop during most manufacturing processes involving material deformation, heat treatment, machining or processing operations that transform the shape or change the properties of a material. They arise from a number of sources and can be present in the unprocessed raw material, introduced during manufacturing or can arise from in-service loading. The residual stresses may be sufficiently large to cause local yielding and plastic deformation, cracking and local delamination in surface coatings, on a both microscopic and macroscopic level, and can severely affect component performance. For this reason, it is vital that some knowledge of the internal stress state can be deduced from either measurements or modelling predictions. Tensile residual stresses in the surface of a component or in a coating are generally undesirable since they can contribute to, and are often the major cause of, fatigue failure, quench cracking and stress-corrosion cracking. Compressive residual stresses in the surface layers are usually beneficial since they increase both fatigue strength and resistance to stress-corrosion cracking, and increase the bending strength of brittle ceramics and glass. However, excessive compressive stress can cause cohesive failure (spallation) in the case of a bulk material, and adhesive or cohesive failure in the case of a coating. In general, residual stresses are beneficial when they operate in the opposite direction of the applied load (e.g. a compressive residual stress in a component subjected to an applied tensile load).
According to Rickerby (1986), Rickerby and Burnett (1988) and Withers and Bhadeshia (2001), there are three types of residual stress: the macrostress (type I stress), which is distributed homogeneously over macroscopic areas that are higher than grain size in the case of polycrystalline coatings materials; microstress (type II stress), which is homogenous over microscopic areas such as one grain or sub-grain; inhomogeneous microstress (type III stress), which is inhomogeneous even on a microscopic level. The dimensional scales characteristic of the three different type of stress are schematically shown in Fig. 4.52.

Classification of stress according to length scales
In general, the type I stress is the most prevailing contribution and is of particular interest from an engineering point of view, especially in material science and tribology. However, when comparing results from different techniques, some information must be given to the sampling volume and resolution of each measurement method in relation to the type of residual stress being measured, particularly when the type II and III micro-residual stresses are of interest. For example, it is important to consider the concept of the characteristic volume, which can be used to describe the volume over which a given type of residual stress averages to zero, and in this sense it is important to consider the relevance of the local (type II and III micro-residual stresses) variations arising from the presence of a composite material, or either a multiphase material, a specific texturing or a locally strained microstructure, etc. Most “material removal techniques” (e.g. hole drilling, layer removal) chip off large volumes of material over which type II and III stresses average to zero. Besides the formulas, relating the relaxed (due to material removal) and measured strains are based on the elastic theory that considers materials as a continuum medium, so that only the macro-residual stresses can be measured. On the other hand, diffraction methods, like X-ray diffraction, give a qualitative measurement of the micro strain by the broadening of the diffraction peak.
Among the origin of residual stresses, and especially moving into the field of surface coating, it is possible to focus the attention on two main contributions (Luzin et al. 2011):
-
3.
The deposition stresses, σd, characteristics of the deposition process considered and related to the growth mechanism. For example, in thermal spray, this contribution is typically a tensile “quench” stress originating from shrinkage of a solidifying splat on the surface. For CS coatings, this stress is rather compressive, characteristic of a peening process.
-
4.
The thermal stresses, σth, developed during cooling down of a composite substrate coating system from an elevated temperature of deposition. It may be qualitatively explained as follows: Upon imposition of a change in temperature, a difference in the expansion or contraction of the dissimilar layered materials results in a variation of the residual stress along the thickness direction of each layer. The stress between the coating and the substrate translates by shear at the interface, causing the coated systems to contract, elongate or bend. Practically, a biaxial thermal strain, \({\varepsilon_{{\text{th}}}}\), appears in films bonded to substrates having different thermal expansion coefficients, at a temperature higher or lower than the substrate or deposition temperature. Without plastic deformation in composite structure during temperature change, thermal stress is directly related to the elastic strain through Hooke’s law:
where \({E_{\text{c}}}\) and \({\upsilon_{\text{c}}}\) are Young’s modulus and Poisson’s ratio of the coating, respectively; \({\alpha_{\text{c}}}\) and \({\alpha_{\text{s}}}\) are the film and the substrate thermal expansion coefficient, respectively; T 0 is the temperature of the free stress state, and T is the actual temperature.
Typically, high temperature deposition techniques such as thermal spray lead to a coating residual stress state dominated by the thermal stress contribution, while on the other hand, low temperature, plastic deformation techniques lead to negligible thermal stress contribution and the coating residual stress state is thus dominated by the deposition stress contribution which can be either tensile or compressive depending on the specific technique. In the case of CS, the high-speed impact and related peening effect represented the key factor influencing residual stress state resulting typically in compressive residual stress state.
4.9.1 Determination of Residual Stress
The determination of residual stresses on surfaces and coatings can be carried out by several approaches and techniques (Schajer 2013) as schematically summarized in Table 4.2, also discussed in Chap. 5. Each technique provides some advantages and disadvantages, and the selection must be performed taking into account the material and coating/specimen characteristics as well the target properties of interest.
The mechanical methods such as hole drilling and layer removal are essentially based on extensimetric determination; hole drilling consists of essentially two stages: (1) removal of the investigated material by drilling a hole (typically 2 mm diameter) and (2) measurement of the relaxation strains occurring around the hole by means of an extensimetric rosette. The theory is well known and the execution relatively easy to implement (ASTM E837-08) as recently summarized in Huang et al. (2013). However, both these tests are destructive, the spatial and depth resolution are relatively low and the methods are not sensitive to phase or structure of the material. They can be suitable to determine macrostress in quite homogeneous materials and coatings in order to have an average and quite accurate residual stress estimation. Both layer removal and hole drilling can be performed in incremental procedures in order to perform depth profiles as reported in the case of thermal spray coatings in Valente et al. (2005) and cold-sprayed A6061 coatings in Rech et al. (2011).
Bending method is based on the fact that the deposition of a layer leads to the development of residual stress which induces the substrate to curve. Then, from the variations of curvature, it is possible to calculate the related variations in stress as a function of film thickness and elastic properties. Curvature can be measured using contact methods (profilometry, strain gauges) or without direct contact (video, laser scanning) allowing curvatures down to about 10 mm−1 to be routinely detected. The Stoney (1909) equation is often used to relate the curvature radius to the biaxial stress in the plane of coating:
where σ c is the residual stress of the coating, E sʹ is \({E_{\text{s}}}' = {{}^{{{E_{\text{s}}}}}\!/\!{}_{{1-{\upsilon_{\text{s}}}}}}\) and E s and ν s are the elastic modulus and Poisson ratio of the substrate, t s and t c are the thickness of the substrate and of the coating, respectively, and K is the curvature. Bending method, similarly to other mechanical methods cited above, provides an estimation of the type (I) overall residual stress and may be used for many coating materials including multilayered and multi-structured materials. At present, many theoretical models have been developed in order to predict the curvature of composite beam caused by residual stress (Brenner and Senderoff 1949; Masters and Salamon 1993). The applicability of Stoney equation is an important subject, and some checks are necessary to validate the use of this approach for the calculation of residual stress in thin and thick films. There are four major requirements in order to allow the use of Stoney equation:
-
5.
Biaxial stress approximation
-
6.
Small deflection (low K)
-
7.
Narrow strip sample
-
8.
\({t_{\text{c}}}\ll{}{t_{\text{s}}}\)
The condition of biaxial stress approximation is not valid for monocrystals and materials characterized by strong texturing, while planar isotropic materials characterized by no preferential orientation are ideal for the application of the Stoney formula; however, there is no specification on the range of applicability of the equation for samples presenting texture. Small deflections (low curvatures, K) and narrow strip samples recommend a proper selection of specimen geometry and the condition that \({t_{\text{f}}}\ll{}{t_{\text{s}}}\) has been introduced in order to neglect the bending contribution and consider the planar strain mismatch as the only contribution which causes residual stress. This condition can be easily satisfied in thin-film technology (Vijigen and Dautzenberg 1995), but represented the main restriction to employ the bending method to determine stress with good accuracy in thermal spray coating. Approximately, to have an accuracy better than 5 % requires a t c/t s ratio lower than 0.02, meaning that with an Almen’s plate 4–5 mm thick, the coating thickness must be lower than 0.08–0.10 mm. More recently, new models to enhance the method accuracy in the case of thicker coatings have been developed, further extending the opportunity to use bending method in thermal and CS coatings (Kõo and Valgur 2010; Wang et al. 2010a, b; Benabdi and Roche 1997).
In this field, the progressive growth methods must be mentioned: While Stoney equation considers the curvature of a static bilayer system after deposition and can be considered an ex-situ technique, these methods predict the residual stresses in progressively deposited coatings as in in situ technique; the deposition stress is introduced as the coating is formed layer by layer with a specified layer thickness, such as the misfit strain, coming from either the deposition stress or the different thermal contraction, is accommodated after each layer addition. Among these models, one of the more used is the Tsui and Clyne (1997) that is especially designed for layer by layer coating deposition techniques as in particular thermal spray and CS process. One of the major advantages of using this model is the capability to split the residual stress term and have a prediction of both the thermal stress contribution and the deposition stress contribution.
On the contrary, diffraction techniques can ensure high spatial resolution and specific sensitivity to the phase and structure of the material investigated. They are suitable for composite or finely structured materials and coatings and especially when the role of microstress/microstrain needs to be emphasized. The diffraction methods are described by Bragg’s law:
where d hkl is the distance between the selected lattice planes hkl, λ is the wavelength and the angle θ hkl is the scattering angle. When a material is under a compressive or tensile stress state, there is a lattice distortion or rather a variation in the d-spacing of its lattice associated with a shift in the position of the diffraction peak in the diffractogram. To find a connection between mechanical methods and diffraction methods, it is possible to consider that the crystal lattice is adopted as a natural and ever-present atomic plane strain gauge embedded in each crystallite or grain (Hutchings et al. 2005; Schajer 2013). In truth, the experimental techniques are not able to determine d-spacing variations (i.e. residual stresses) with atomic spatial resolution; however, the spatial resolution is typically some order of magnitude lower with respect to mechanical methods. By the experimental point of view, X-ray diffraction and neutron diffraction are the two techniques employed to determine residual stresses. Among these, X-ray is certainly the more diffused and employed due to the relatively simpler and cheaper equipment. The main difference between X-ray and neutron is related to the penetration depth of the incident beam and the corresponding investigated volume; X-ray is very surface sensitive with a few microns of penetration depth, while neutron can penetrate deep into the matter up to some millimetres enabling a better average measurement and for these reasons is preferentially employed to characterize thick coatings or directly part of components. In this sense, XRD is generally employed in combination with a layer-removal method to have a better average or also to perform residual stress profiles, while with neutron diffraction the condition of the incident beam can be properly tuned in order to define in a wide range the volume of investigation. The analytical model generally adopted to determine the values of the stresses is the sin2 ψ method that considers linear relation between stress and strain and a plane stress condition. The model assumes a linear relation between the lattice distance d and sin2 ψ, where ψ is the angle subtended by the bisector of the incident and diffracted X-ray beam, according to the relation:
where σ is the stress component in an assigned direction, E is the elastic modulus of the material, hkl are the lattice planes, d 0 is the lattice spacing of the planes hkl in the undeformed material, ψ is the angle subtended by the bisector of the incident and diffracted XR beam, and the \(\left({\frac{{\partial {d_{\varphi \psi ({\text{hkl}})}}}}{{\partial {{\sin }^2}\psi }}}\right)\) is the slope of the line d-sin2 ψ
4.9.2 Residual Stresses in CS Coatings
The understanding of residual stress generation and evolution in CS deposits can be a useful tool to explain the coating growth mechanism. Deposition stress are typically compressive in CS and are originated by the peening effect and plastic deformation upon continuous high-velocity impact performed by the incoming particles flow. Matejicek and Sampath (2001) studied the impact of a single particle (single splat) and reported the residual stresses in cold-sprayed copper particles as a function of particle velocity and the resulting values are few tens of MPa in the case of particle velocity ranging from 500 to 700 m/s. Moving from single impact to a multiple particle deposition scenario, the final stress state is a very fine balance between the kinetic impact/shot peening effect upon particle impact and the thermal effect leading to annealing and stress relieving performed by the hot gas jet. In this context, Luzin et al. (2011) stated that the residual stress on CS coatings is almost entirely a deposition stress determined by the plastic deformation process of the spray material due to the high-velocity impact of the particles, while thermal effects do not play a notable role in changing the distribution of the induced stresses. They studied the systems copper/aluminium depositing copper and aluminium coatings on copper and aluminium substrates, and the residual stress profiles obtained by neutron diffraction are shown in Fig. 4.53. They also treat empirically the experimental results with Tsui and Clyne’s progressive model and verify quantitatively the negligible contribution of thermal stress in the total residual stress.

Measurement (symbols) and model fit (solid lines) of the through-thickness in-plane stress distributions for a Cu/Cu sample, b Cu/Al sample, c Al/Cu sample and d Al/Al sample. (Luzin et al. 2011)
They further estimate the impact parameters with the theoretical approach of linear momentum transfer on impact and defined the following relationship to predict the maximum residual stresses at the surface of a CS coating:
where p max is the maximum pressure calculated in the assumption of Hertzian contact, σ s is the yield stress of the material, ρ its density, V is the impact velocity, E* is the equivalent modulus defined as \({E_*} = {E/{({1-{\upsilon^2}})}}\) with v Poisson coefficient and k is a constant close to 1. The two parameters α and β are coupled into a product that describe in simple terms the elastoplastic state of the deformed material: α is the ratio of the strain-hardening rate (tangent modulus) to the Young’s modulus, and β is the ratio of the true plastic strain to the true elastic strain. The accuracy of residual stress prediction according to Eqs. (4.7) and (4.8) are verified in the case of Al/Cu system, Al/Mg.
Looking at Eqs. (4.7) and (4.8), one of the most important prediction is that plastic material properties, and in particular the YS at impact temperature (effective YS), are strongly related to residual stress development and in particular in the case of αβ small Eq. (4.7) reduces to σ max = 0.33* YS, meaning that residual stress is 1/3 of YS (at impact temperature; Spencer et al. 2012a, b). Indeed, Eqs. (4.7) and (4.8) reintroduce the important role of impact temperature through the effective YS term and linking the effective YS and the residual stress development with the flattening ratio and the critical velocity. In this sense, the flattening ratio can be assumed as an index of particle deformation upon impact and a way to evaluate the impact strain according to Luzin et al. (2011); this estimation of impact strain combined with the impact velocity value can be used to calculate the impact duration by assuming the impacting particle decelerates linearly according to Taylor impact test (Meyers 1994) and giving also an estimation of average strain rate. Finally, the average impact pressure can be calculated based on the momentum transfer over the calculated impact time (Van Steenkiste et al. 2002), and this is in direct relation with residual stress according to Eqs. (4.7) and (4.8). On the other hand, as shown in Fig. 4.54a, the flattening ratio always increases with increasing particle impact velocity, though the rate of this increase depends strongly on material properties, as well as on particle temperature. Interestingly, the flattening ratio exhibits little dependence on material properties or temperature, when it is plotted against the ratio of the particle impact velocity (v pi) to the critical particle impact velocity (v cr; Fig. 4.54b) whose formula according to Schmidt et al. (2006a, b) also includes the dependency on effective yield stress. Consequently, all variations are embedded in the v pi/v cr function, and as a consequence the flattening ratio appears to be a unique function of v pi/v cr, regardless of the values of materials and process parameters (Assadi et al. 2011), confirming once more the strategic significance of the critical velocity parameter in the description of CS deposition.

Calculated flattening ratios of copper and aluminum as a function of a particle impact velocity and b the ratio of particle impact velocity to critical velocity. The dashed line in b shows the relation: y = 0.46x. (Assadi et al. 2011)
The crucial role of the effective yield stress has a major influence in the case of material exhibiting yield stress versus temperature behaviour with large variation in the low-temperature zone as in the case of ductile and low-melting temperature metals such as in particular Al and Al alloys. Figure 4.55 reports the trends of YS of some common Al alloys, compared with Ni cold drawn and a Ni superalloy as a function of temperature. It is evident that impact temperature of few hundreds of degrees that are typically achievable and used with CS deposition, can reduce the YS to a value even lower than 100 MPa, while they are substantially ineffective in the case of HP Ni cold drawn and totally ineffective for high-strength superalloys.

Yield strength as a function of temperature of several Al alloys, Ni and waspaloy. (Data from Journal of NBS; Jenkins)
Again, Eqs. (4.7) and (4.8) in combination with an experimental determination of residual stress can also be used as a tool to back calculate the effective YS as reported in Spencer et al. (2012a, b) in the case of pure Al and A6061, A7075 Al alloys coatings deposited by CS with different conditions and equipment. As would be expected, the effective yield stress decreases by a factor ~ 2 for the sample sprayed at lower temperature (Al, 100–400 °C), but it can be as high as ~ 7 for samples sprayed at high temperature (550 °C).
If the enhancement of particle impact temperature has a beneficial effect in increasing the projected material ductility at the impact and hence its sprayability, it must be taken into account that it is also responsible of quenching stresses that can promote coating delamination. In particular, it is related to the discontinuity of residual stress profile at the interface between substrate and coating: This can depend also on substrate material and temperature (material size, deposition strategy, etc.) and can affect noticeably the coating adhesion leading to crack formation. Regarding the particle impact temperature and effective YS of the sprayed material, it must be taken into account that there is not a homogeneous temperature distribution in the metal particle during the impact, and these variations can produce different plastic behaviour of the material as a function of their position and local differences in residual stress distribution. Formation of shear instabilities is historically reported in CS deposition, and temperature rises high enough to induce local melting at the edge of the splat are also reported by many authors (Assadi et al. 2003). Recently Saleh et al. (2014) developed a smooth particle hydrodynamic(SPH) model to describe the particle–particle impact interaction during CS deposition of A6061 aluminium alloy and the nature of inter- and intra-layer adhesion. An interesting result is related to the significant variation in the extent of plastic deformation between the core of an impacted particle and its periphery with the core exhibiting a lower degree of plastic deformation, while at the periphery plastic deformation as severe to induce local microwelding events is observed. Accordingly, the behaviour of the residual stress profiles has been studied confirming the fine balance between thermal and kinetic effect on the final stress state and including the relevance of local variations within the coating microstructure due to the nonhomogeneous plastic deformation. A further proof of the agreement between experimental results and simulated profiles analysed with Tsui and Clyne method is reported confirming once more the dominance of kinetic over thermal effects of the CS deposition process. The evolution of residual stress trends for Ti, Cu and Al CS coatings deposited on carbon steel (S355), SS (AISI316) and aluminium alloy (A6061) is studied in Suhonen et al. (2013) further evaluating the effect of various pretreatments such as grit blasting and CS blasting. The crucial role of the first layer deposition on coating adhesion has been emphasized, while by the point of view of residual stress mainly compressive stresses are reported due to the nature of CS. However, the possibility to generate either tensile or compressive test depending on the combination of coating and substrate material is reported, or rather depending on the variation of the thermal stresses contribution, directly proportional to the difference of thermal expansion coefficient between the substrate and the coating.
A further parameter influencing the residual stress is the coating thickness, and in particular, the deposited coating showed a lower stress value at the interface with the substrate to grow up along the depth from the interface to the surface. In this sense, the peening effect of bombarding particles “accumulates” with repeated impacts as confirmed also by the difference on residual stress observed on single splat with respect to multiple impact (Matejicek and Sampath 2001). The pure peening effect on residual stress profile on Al-based coatings have been empirically studied by comparing the residual stress profiles of pure Al coating with Al/Al2O3 coatings obtained by spraying different Al and Al2O3 powder mixtures confirming that the additional peening performed by the impinging ceramic particles induce an increase in the whole amount of (compressive) stress (Rech et al. 2009).
The effect of thermal input on residual stress evolution on A6061 alloy coatings has been experimentally assessed in Rech et al. (2011), where the use of substrate preheating in the range 24–375 °C as well a different deposition strategy (single pass and multi pass) have been considered. The residual stresses, measured by using XRD, bending method and modified layer removal methods, are reported to be compressive in all cases with a slight trend to reduce the amount of compressive stress with the increase of preheating temperature.
The similarities of CS process with shot peening regarding the kinetic aspects and the influence on residual stress generation have been studied considering both the shot peening of impacting particle during the coating growth (Ghelichi et al. 2014a, b) and the effect of impacting particles on the residual stress profile induced on the substrate (Shayegan et al. 2014).
Considering the effect on coating growth, the main statement is that kinetic impact plays the more significant role in the determination of residual stresses in CS coatings; however, a new model has been developed to further include a term to describe the thermal annealing effect on residual stresses. Summarizing, this model involved a two-step approach in which the first step accounted for the peening effect of the impinging particle, while the second step accounted for the annealing effect responsible of stress relaxation mechanism. This second step is the novelty of this model and the Zenner–Wer–Avrami function is employed by the authors to calculate the stress relaxation contribution as a function of annealing time at a fixed temperature. The model accuracy has been assessed by comparing simulated results with experimental determination of residual stress by means of XRD in the case of A5053 aluminum alloy coatings.
The effect of impacting particle on substrate residual stress profile is reported in Shayegan et al. (2014) in the case of deposition of Al1100 alloy on extruded AZ31B magnesium alloy. A new model is developed which used Cowper–Symonds model to describe the higher strain rate of CS coating and Johnson–Cook material model to describe the particle impact. A parametric study performed on the single particle model has been developed to evaluate the effect of velocity, particle shape and diameter, impact angle and friction between the particle and the substrate, on the residual stress induced on the substrate. The main results are shown in Fig. 4.56. The typical shape of the profiles are in agreement with residual stress profiles exhibited by shot-peened surfaces or rather a slight compressive state in the surface layer (substrate/coating interface in the case of CS deposition) followed by an increasing residual stress up to a maximum compressive stress observed at a critical depth inside the substrate. This critical depth resulted in a function of spray conditions and particle characteristics as shown by the calculated profiles shown in Fig. 4.56. Residual stress progressively reduces into the substrate up to zero and to a further tensile peak, balancing the total stress into the material and whose intensity is related to the intensity of compressive peak.

Residual stress profiles generated in an AZ31B substrate when impacted by an Al1100 particle as a function of a particle speed, b particle diameter, c impact angle and d particle aspect ratio. (Shayegan et al. 2014)
4.10 Fatigue
A specific discussion on the effect of residual stresses on fatigue is found in Chap. 5 and Sect. 4.10.2. Since fatigue accounts for about 90 % of all mechanical failures, fatigue behaviour of materials and structural components has been of great importance to be fully understood for a reliable mechanical design. Fatigue failure occurs because generally the ongoing repetition of identical or similar loads strongly reduces the loads the material can bear. Furthermore, the failure is not preceded by large plastic deformation even in ductile materials (that is to say in the elastic-linear field) rendering it more difficult to detect component damage than under static loads—the danger of catastrophic failure is thus rather large (Rösler 2007).
The introduction of some basic concepts to the description of fatigue strength is necessary to understand the potential effect of a specific surface coating. Fatigue is encountered under a time-dependent cyclic loading as schematically represented in Fig. 4.57; the time dependence is described by the period T defined as the time for a cycle or alternation of the load. Sinusoidal or triangular cycling are the most frequently considered and replicated in laboratory testing. The load is described by the stress amplitude, and the mean stress, defined as:

Time-dependent cyclic loading. a Sinusoidal. b Triangular
Another quantity commonly used to define the fatigue cycle is the so-called fatigue stress ratio (or simply stress ratio), defined as:
where σ max and σ min are, respectively, the maximum stress and minimum stress in the cycle. The stress ratio, R defined in Eq. (4.10) is a second parameter commonly used to further describe the load. Finally, alternating or reversed stress is considered when a change of sign during the cycle is observed, while when the load is completely tensile (positive) or compressive (negative) through the cycle we talk of fluctuating or pulsating stress (Fig. 4.58).

Typical load curves and R ratios
By the experimental point of view, the fatigue strength of a material is typically described first by a stress-cycle diagram (also stress–life or S–N or Wohler diagram) as schematically shown in Fig. 4.59. The number of cycles, N, are plotted in the x-axis always in logarithmic scale, while the stress, σ, can be plotted in the y-axis in linear or logarithmic scale. Two separated regimes can be considered or rather the high cycle fatigue (HCF) and the low cycle fatigue (LCF) depending on the total number of cycles completed to have the final fracture. There is no well-defined number of cycles to distinguish the two regimes even if generally 104 (sometimes 5E4) is used. A stress amplitude that causes failure in the LCF regime or HCF regime is called the LCF strength and HCF strength, respectively. The damage mechanisms leading to fatigue failure are different in the LCF with respect to HCF, since in the first case plastic strain are involved in the fatigue cycles, while the HCF failure happens below the yield stress. It must be noticed that the slope of the S–N curve is usually much smaller in the LCF regime than in the HCF so that a small change in the stress amplitude has a large effect on the number of cycles; for this reason, in the LCF regime (where elasto-plastic deformation take place), the strain ε is the parameter used to relate the number of cycle to failure to the severity of the fatigue cycle. These ε N curves are called Coffin–Manson curves and are the basic tools for LCF design. Generally, the scatter of the cycles at the same stress/strain to failure is rather large, meaning that fatigue strength is very sensitive to possible defects of the material. In particular, fatigue damage initiation involves a small volume of material and usually starts from the free surface of the material; that is to say that the surface state is critical and that fatigue strength is strongly influenced by the surface roughness, the residual stresses and possible surface work hardening. All these factors justify the large scatter of the fatigue test results making necessary the use of statistical methods to describe fatigue strength and draw limiting curves that represents a certain probability of failure. Some materials exhibit a true fatigue limit (sometimes also called the endurance limit). In this case, there exist a limiting number of cycles NE, with the S–N curve being almost horizontal at a larger number of cycles. In this case, the S–N diagram is of type I (Fig. 4.59a). A specimen that has survived NE cycles is never supposed to fail, and the stress level that corresponds to NE in the S–N curve is called the fatigue strength, endurance limit or fatigue limit σ E. In many materials, there is no horizontal part of the S–N curve (type II, Fig. 4.59b). Although the slope of the S–N curve becomes smaller beyond a certain number of cycles, failure can still occur even with smaller fatigue amplitudes. These materials thus have no true fatigue limit. To ensure safety of the component, a limiting number of cycles of 108 is often used, ten times larger than the usual value for materials with a true fatigue limit. To state explicitly that a fatigue strength corresponds only to a certain number of cycles, not to a true fatigue limit, the number of cycles can be added to the subscript, as in σ E(10E8) (Rösler 2007).

The characteristics type of type-I and type-II S–N curves. (Rösler 2007)
Looking at the S–N curve plotted in double-logarithmic scale, it can be noticed that a straight line can fit the trend in a wide range of number of cycles and this linear trend is described by the Basquin equation:
where the fatigue strength coefficient \({\sigma _{\rm{f}}}^{\prime}\) is related to the tensile strength. Some typical approximate values for \({\sigma _{\rm{f}}}^{\prime}\) are 1.5 UTS for steels and 1.67 UTS for aluminum and titanium alloys. The fatigue strength exponent depends on the material and the specimen geometry; on smooth specimens, it ranges typically between 0.05 and 0.12 (Rösler 2007).
4.10.1 Fatigue Damage Mechanisms
The mechanisms of fatigue development and failure can be different, depending on material type, surface state, cycling conditions, environment, etc., and can be complex to analyse. However, in the case of metals, the fatigue failure is generally originated by initiation and growth of surface cracks. Only if the material has been previously hardened by means of some thermo or thermo-chemical treatment (carburizing, nitriding, induction hardening, etc.), the fatigue crack starts from an internal defect, generally a nonmetallic inclusion.
Apart from these cases, the failure mechanism is a three-step process: The first step is the crack initiation, the second step the crack growth and propagation under cyclic loads and the last step the final catastrophic failure. The understanding of these steps is fundamental to understand how a surface treatment and, in particular, in this case a CS coating can influence the fatigue life of a component. The crack initiation stage is very sensitive to the mechanical properties of the base material and its surface state. Surface defects, notches, cracks and microcracks are generally present on the surface of a metal; they came from production processes, machining or manufacturing steps or also by simple handling of the materials and components. Indeed, even if any micro defect is appreciable, the continuous sliding of adjacent grains subjected to the maximum shear stress originates the so-called persisting slip bands, a series of surface peaks and valleys that increase their dimension with the number of cycle till they form a crack that will grow and propagate upon continuous cyclic loading, with a crack path that is a function of the applied loads, finally leading to the final catastrophic failure. This damage mechanism is very sensitive to the surface state, in terms of both roughness and surface residual stresses, not significant under static loads but crucial in fatigue strength. The mechanical properties and the physical state of the surface are hence the key factors to control the crack initiation stage and enhance the fatigue life of the component.
This very schematic picture can highlight the potentiality of a surface treatment on determining the fatigue strength. The first target is the reduction of the surface defects and roughness; this can be traditionally achieved by metal working and further machining of the surface, for example, rolling and forging are well-known post-processing procedures to close micro-cavities and pores on the surface of the metal hence increasing the fatigue strength. On the other hand, the second target to enhance the fatigue strength is the surface hardening responsible to reduce the plastic deformation at low-yield stress, in this field surface treatment as shoot peening or nitriding in steels are generally considered for the scope. Finally, compressive residual stress on the surface is also known from the literature to be beneficial on fatigue strength providing a mechanical opposition to both crack initiation and propagation.
4.10.2 Fatigue Strength on CS Coatings
Despite the importance of fatigue strength on the real performances of a mechanic component in industrial application and the relevance of surface engineering treatments on influencing fatigue strength, the literature about the influence of CS coating on fatigue strength is far from being abundant. Furthermore, the testing procedures and conditions are numerous and the interpretation of results generally complex; so that, today the available experimental results are mainly diverse and sometimes also contradictory.
The encountered procedures to evaluate fatigue strength on CS coated metal parts are mainly the ASTM B593 “Standard Test Method for Bending Fatigue Testing for Copper–Alloy Spring Materials” and the ISO 1143 “metallic materials—rotating bar bending fatigue test” involving, respectively, pure bending and rotating bending stresses. The studied materials as both substrates and coatings are light alloys, mainly Al and Ti alloys according to the increasingly consolidating applications of CS in aeronautics and defence where these materials are strongly employed (Jones et al. 2011).
The main factors influencing the fatigue strength of a metallic material coated by CS can be summarized in:
-
Bond strength—substrate/coating interface
-
Coating material and quality (microstructure, porosity, mechanical properties)
-
Residual stress state
-
Surface roughness
While the position and experimental results from the different studies are unanimous (i.e. concerning bond strength), there are often some contradictions (i.e. residual stress state, coating material) due to the relatively new technological issue for CS coatings and the continuous rise of new experimental results as well to the complexity of the problem itself; the scope of this section is to report the main results available in the literature, also trying to identify some common and summarizing trends.
4.10.2.1 Effect of Bond Strength on Fatigue Properties
The whole literature available is unanimous in confirming the strong influence of bond strength on fatigue performances of a cold-sprayed specimen (Ghelichi et al. 2012; Sansoucy et al. 2007; Price et al. 2006) The crucial role of bond strength is necessary to avoid crack initiation directly at the substrate surface totally excluding the influence of the coating; or worse, preserving only the detrimental effect of the increase of substrate roughness and notch effect achieved by the peening of the first layer deposited. This phenomenon is shown, for example, in Ghelichi et al. (2012) in the case of CP-Al and A7075 coatings on A5052 substrates: the poor adhesion of CP-Al (Fig. 4.60a) is the first reason of the negligible influence of the coating presence on fatigue strength, while on the other hand, the noticeable bond strength of A7075 coating (Fig. 4.60b) is one of the main reasons of the significant enhancement of fatigue limit with respect to the bare substrate. Furthermore, the lack of adhesion at the substrate/coating interface seems to have a dominant role, having the capability to mask or nullify the other effects either beneficial or detrimental. For example, in Ghelichi (2014a, b), the effect of A7075 coating obtained by using a spherical gas-atomized microstructured powder as feedstock is compared with a A7075 coating obtained by using a nanostructured cryomilled powder with the following result: While the mechanical characteristics of nanostructured feedstock can lead to superior coating properties, the lack of bond strength as shown in cross-sectional fractographies (Fig. 4.61) is the main factor, combined with the porous microstructure, responsible for the essentially negligible influence of the coating presence on final fatigue strength. So, “traditional” A7075 coatings resulted in an increase of fatigue limit up to 30 %, while harder nanostructured coatings have no influence on fatigue.

Cross-sectional fractography of a CP-Al and b A7075 cold spray coating on A5052 substrate. (Ghelichi et al. 2012)

Excellent bond strengths (adhesion strength of 61 ± 4 MPa) are reported to be fundamental in determining one order of magnitude rise in number of cycles to failure of A2024 specimens coated with Al–Co–Ce with respect to bare substrate (Sansoucy et al. 2007).
Increasing bond strength by surface pretreatment can have a significant role on final fatigue performances. For example, combining grit-blasting pretreatment with subsequent CS coating is reported to have multiple beneficial effects on fatigue life enhancement (Ziemann et al. 2014). First, grit blasting is itself beneficial on fatigue life inducing a compressive residual stress on the surface; then the increased surface roughness is able to improve coating adhesion by making more effective the mechanical anchorage at the substrate/coating interface. On the other hand, combining shot peening with CS leads to a completely different final result. While the effect of shot peening as in the case of grit blasting is beneficial to fatigue strength, it has a detrimental effect on subsequent coating adhesion. So, the majority of shot-peened/coated specimens as obtained in Ziemann et al. (2014) show a failure initiation at the substrate/coating interface (Fig. 4.62a, b); on the other hand, the excellent adhesion of grit-blasted/coated specimens seems to be the reason for the increased performance, and in that case the failure occurred within the substrate (Fig. 4.62c, d) and is reported to be due only to the excessive number of cycles experienced.

Fractographies of representative cracks of a, b shot-peened/coated specimen and c, d grit-blasted/coated specimens. (Ziemann et al. 2014)
Bond strength can also play a negative role on fatigue strength as in the case of CP-Ti coatings on Ti6Al4V substrates as reported in Clzek et al. (2013); here, the high adhesion is combined with a low average quality of the coating surface in particular regarding high surface roughness and significant porosity; this situation in the first step promoted the crack initiation phenomena by notch effect and in the second step, thanks to the good adhesion of the coating to the substrate, it allowed the transfer of the formed vertical cracks from the coating to the substrate leading to a fast deterioration of the specimen (Clzek et al. 2013).
Summarizing, ensuring a sufficient bond strength at the substrate/coating interface is a mandatory requirement to allow the deposited coating to play a role on fatigue strength. The influence of all other characteristics, such as stress state or surface roughness, are secondary with respect to bond strength because not coating adhesion means that the crack initiation can start directly at the substrate surface excluding any (beneficial or detrimental) influence of the coating.
4.10.2.2 Effect of Coating Quality on Fatigue Strength
Regarding the role of coating material and quality, it is certainly proved that a good coating quality in terms of compact microstructure and high cohesive strength increase the average mechanical behaviour of the deposited material (Schmidt et al. 2006a, b; Assadi et al. 2011). In particular, in the case of fatigue resistance, the presence of surface roughness, porosity in the microstructure or lack of cohesive strength at the particle–particle boundaries is extremely critical improving the crack initiation by notch effect (Wong et al. 2012). Furthermore, the importance of deposition process optimization and the role of impact parameters on determining the coating quality is also well described in the literature and the better CS coating qualities are obtained with the more ductile materials such as pure metals (i.e. Cu, Al, Ni) exhibiting lower critical velocity and higher plastic deformation capability (Schmidt et al. 2006a, b; Assadi et al. 2011). However, these materials have also poor or almost low intrinsic mechanical properties so that it is not expected to obtain a significant increase in fatigue strength of the coated part. Therefore, is it better to have a high-strength coating material deposited with poor quality or a low-strength coating material with excellent quality? Unfortunately, there is neither a univocal answer nor a clear correlation between fatigue strength and coating properties (i.e. residual stress, surface roughness, porosity, YS, bond strength) to be able to trace some basic guidelines. In this sense, three examples of CS-coated Al alloys can help to depict how they spread the current scenario: the significant influence of coating material and its intrinsic mechanical properties in determining the fatigue behaviour of CS-coated A5052 substrates is reported in Ghelichi et al. (2012); a noticeable increase of fatigue life by using a good quality but humble CP-Al coating is reported in Ziemann et al. (2014) and finally the influence of performing CS with the same material as the substrate, A6082, has been studied in Moridi et al. (2014a, b). Figure 4.63 showed the results reported in Ghelichi et al. (2012) supporting the primary effect of coating material on increasing both fatigue limit and the slope in the low-cycle regime.

S–N curves of A5052 as-received and grit-blasted substrates coated with CP-Al and A7075 alloy by low-pressure cold spray. (Ghelichi et al. 2012)
Fatigue behaviour is reported to follow the fatigue strength of the stronger material (if a certain bond strength and coating quality can be ensured) among coating and substrate, strongly recommending the use of high-performance coating material. In this sense, up to 30 % improvement in fatigue limit is reported, for example, with A7075 coating on A5052 (Ghelichi et al. 2012) as shown in Fig. 4.63. Similar considerations are attributed to be the basis of the improvement of the HCF limit of AZ91D magnesium alloy by the deposition of a composite Al/Al2O3 coating (Xiong and Zhang 2014).
Moridi et al. (2014a, b) discuss the influence of a A6082 CS coating on fatigue strength of A6082 material; this study aims to exclude the influence of the coating material on fatigue behaviour focussing the attention on the characteristics induced by a CS-deposited layer. The coating exhibits good bond strength and compact microstructure so that its anchorage with base material is ensured. An ~ 15 % increase of the fatigue limit is reported supporting the thesis that CS technology can play a role on fatigue strength enhancement. On the other hand, the number of cycles to failure are almost unchanged with respect to uncoated specimens as well the slope of the curve in the low-cycle regime as emphasized in the S–N diagram in Fig. 4.64. In this sense, the observed propagation mechanism of macrocracks is quite the same in as-received and coated specimen. So, the coating is able to increase the threshold for crack propagation to be started, but once the crack starts to propagate, it results in the final fracture in more or less the same number of cycles of as-received specimens (Moridi et al. 2014a, b).

Finally, a noticeable increase of the number of cycles to failure is reported in Ziemann et al. (2014) by combining grit-blasting and shot-peening pretreatment with CP-Al CS coating. While the coating material (CP-Al) exhibit lower performances with respect to the base material (A2024), a significant enhancement on fatigue life is reported.
Arouse one’s interest in Ti alloy base material, the poor intersplat bonding and low modulus of a CP-Ti coating deposited by CS have been reported to be detrimental on fatigue strength of Ti–6Al–4V coatings (Price et al. 2006) Indeed, upon cycling, the intersplat decohesion leads to the formation of vertical cracks in which propagation and subsequent transfer to the substrate is the main cause responsible for premature failure (Clzek et al. 2013)
A first investigation on the fatigue life of stand-alone CS deposit is reported in AL-Mangour et al. (2013) in the case of AISI316L in comparison with bulk AISI316L. The CS coating has been post-annealed to promote diffusion and close particle–particle interfaces. The results, in agreement with the evolution of YS and ultimate strength, show that the cold-sprayed material exhibits a lower fatigue strength even after post-deposition annealing mainly due to the stiffness and the residual presence of pores, defects and morphological crack initiation sites at the particle–particle boundaries with respect to the bulk material.
Summarizing, both coating material and average coating quality play an active role in determining fatigue strength and fatigue life even if the numerous number of parameters involved and the wide field of investigation give back, at present, a scenario not yet clarified; hopefully, the support of more experimental results that are progressively enriching the literature will bring in clarity to this topic.
4.10.2.3 Effect of Residual Stresses on Fatigue Strength
The assignment of a compressive residual stress on the surface of a metal component is traditionally considered responsible for a beneficial effect on fatigue strength and life of the component (Schijve 2001). This represented the basis to develop shot-peening and grit-blasting surface treatments as currently already employed in several industrial procedures. By now, it is well known that CS deposition is able to ensure a compressive residual stress, thanks to the peening effect performed by the impacting particles as also reported in the previous section of this chapter. Therefore, the logical consequence is that residual stresses induced by CS are beneficial on fatigue strength; this is in general the truth, however, some factors must be considered: First of all, the compressive stress in the coating is generally balanced by an induction of tensile stresses on the substrate surface as reported, for example, in Rech et al. (2011). Such induced tensile stresses could lead to an earlier crack initiation and reduce the whole fatigue life as reported in the case of coated Ti–6Al–4V (Cizek et al. 2013; Price et al. 2004). Second, excessive compressive residual stress can affect bond strength leading to premature interfacial debonding and spallation. Then, the compressive residual stress state of a CS coating is mainly beneficial on fatigue strength of the metal component according to the results reported in the case of Al–Co–Ce on A2024 (Sansoucy et al. 2007) and A6082 (Moridi et al. 2014a, b) or CP-Al on A2024 (Ziemann et al. 2014). However, in order to have the capability to benefitfrom this effect, some requirements in terms of coating quality must be ensured. It is not coincidence that bond strength is reported to be excellent in all the cases previously mentioned (i.e. adhesion strength of 61 ± 4 MPa is reported in Sansoucy et al. (2007)) as well coating compactness and morphology (i.e. coating porosity in the range of 0.2–0.5 % (Ziemann et al. 2014)).
4.10.2.4 Effect of Surface Roughness on Fatigue Strength
The surface topography and roughness influences the fatigue behaviour in its first step, by providing a superior density of sites for crack initiation. The presence of corner, sharp edges, cavities or other topographic features induce an intensification of the local stress that promote crack nucleation and propagation, hence representing a drawback for the fatigue strength of a metal component. In this field, as-deposited thermal spray and CS coating exhibit a typically rough surface (average surface roughness, R a, higher than 0.01 mm are reported) depending on employed feedstock powders and material characteristics (Papyrin et al. 2007). Indeed, surface roughness represented the other side of the coin when considering the effects on fatigue strength and must be minimized as much as possible to reduce its negative influence. CS of ductile materials can lead to greater particle deformation upon impact, hence promoting a low surface roughness and presence of defects; according to this trend, CP-Al coating is reported to improve the surface quality of grit-blasted A2024, improving its fatigue strength (Ziemann et al. 2014). At the same time, high surface roughness combined with relatively high porosity and surface/coating quality is reported to nullify the potential beneficial effects of A7075 nanostructured coatings (Ghelichi et al. 2014a, b). Post-deposition polishing or machining on as-deposited CS coatings can be useful to reduce the surface roughness and the surface defects as well as a post-deposition treatment such as shot peening as reported in Bageri et al. (2010); however, no literature up to now reports a deep investigation on this subject.
A summarizing table is reported collecting the main experimental procedures and results related to fatigue strength investigation on CS coatings (Table 4.3).
4.10.3 Adhesive/Cohesive Strength
Adhesion is a fundamental property in any type of coating/substrate system because it is closely related to the durability and longevity of the whole system. The performance and reliability of a coating depend on the mechanical integrity of coating/substrate systems, that is, the adhesion of coatings to their substrates. Therefore, there is a need to achieve and, at the same time, to evaluate the coating adhesion with simple and reliable methods (Chen et al. 2014). The experimental measurement of adhesion can be achieved by defining the force of adhesion (often defined as the maximum force per unit area) exerted when two materials are separated; or the work of adhesion, namely the work in detaching two materials from one another (Rickerby and Stern 1996). Many theories and mechanisms for thermally sprayed coatings have been proposed; none, however, covers all situations, and no adhesion test satisfies all requirements. Therefore, the best test method is often the one that simulates practical stress conditions (Lin and Berndt 1994; Mittal 1978). The main methods used to test thermally sprayed coatings are as follows (Pawloski 2008):
-
A family of tests, based on the force of adhesion, including tensile adhesion test (TAT), also known as the “pull-off” method, pin test, shear test
-
A family of tests based on fracture mechanics, including bending tests, the double cantilever beam (DCB) method and indentation test
-
Other methods, such as scratch test and “laser-shock” test
4.10.3.1 TAT or “Pull-off” Method
The TAT has been used widely as a routine quality control tool for thermal spray and CS coatings. The TAT arrangement is illustrated in Fig. 4.65; at the center, a coated specimen is attached to a support fixture by epoxy so that a tensile force can be applied. Tensile strength results from division of the maximum load applied at rupture by the cross-sectional area. The adhesion strength of the coating is given if the failure occurs only at the coating–substrate interface. The cohesive strength of the coating is given if the rupture is entirely within the coating. Mixed-mode failure may also occur, making the interpretation of results difficult. Users generally apply the ASTM C633 Standard, but there are also other procedures and other national standards (for example EN 582 and JIS H8664). However, the TAT procedure has several shortcomings, including the penetration of epoxy and alignment of test fixtures. Another limitation of the ASTM test results from its limited strength, which does not exceed p = 80–100 MPa, which makes it impossible to test well-adhering coatings (Lin and Berndt 1994; Mittal 1978; Pawloski 2008).

Schematic representation of TAT arrangement
Unlike other thermal spray techniques, quite thick coatings can be obtained by the process of CS. The adhesive strength of thick coatings can be measured using a novel testing method described in Huang and Fukanuma (2012) and shown in Fig. 4.66. First, thick coatings of more than 5 mm are deposited on a conventional tensile specimen with a diameter of 25 mm, as shown in Fig. 4.66a. Then, the test piece is machined to obtain a specimen as shown in Fig. 4.66b and mounted as represented in Fig. 4.66c. The part near the coating/substrate interface is cut thin to ensure that the rupture happens in that area during the tensile test. In spite of the arc transition used at the inner corner near the interface of coating/substrate, the stress concentration may cause the failure of some specimens near the inner corner; even though the geometry of a specimen has not been optimized, the lower limit of adhesive strength can be obtained.

The novel method to test the adhesive strength of coatings according to Huang and Fukanuma (2012)
Other pull-off tests that allow the measurement of coating adhesion on flat-plate specimens are currently employed for CS coatings (Marrocco et al. 2006; Price et al. 2006; Van Steenkiste et al. 2002; Tao et al. 2009). The general pull-off test (described, e.g. in ASTM Standard D4541, Standard Test Method for Pull-Off Strength of Coatings Using Portable Adhesion Testers) is performed by securing a loading fixture (dolly, stud) normal (perpendicular) to the surface of the coating with an adhesive. After the adhesive is cured, a testing apparatus is attached to the loading fixture and aligned to apply tension normal to the test surface. The force applied to the loading fixture is then gradually increased and monitored until either a plug of material is detached or a specified value is reached.
Coating adhesion can also be measured using pin method as described, for example, in Smurov et al. (2010) and Sova et al. (2013b). Schematically, the method is illustrated in Fig. 4.67. A coating is deposited on the pin flush-mounted to the substrate. The pin has a shape of truncated cone with the diameter of the top base equal to 2 mm. Coating is deposited on the top base of the pin as well as on the substrate surface. After spraying, the substrate is fixed and the mechanical force is applied axially to the pin. The value of force necessary to detach the pin from the coating is suggested as adhesive or cohesive strength depending on the zone where the rupture takes place.

Pin adhesion test method. 1 deposition of coating on substrate with flush-mounted pin, 2 strong fixation of substrate and application of force to a bottom end of the pin, 3 increase of the force until the coating ruptures. (Sova et al. 2013b)
Shear test methods were developed for rapid evaluation of the adhesion/cohesion strength of a coating on its substrate without the need of gluing and curing, and better describes the behaviour of the coating when subjected to shearing loads (Spencer et al. 2012a, b; Wang et al. 2010a, b; Yandouzi et al. 2009). In this technique, a coating sample is submitted to shear loading in a direction parallel to the substrate/coating interface using a commercial hard metal plate as a punch, thus pressing against the coating while a sample holder maintains the substrate fixed during testing. The most common shear test standards are EN 15340 and ASTM F1044. The fracture mechanics approach to the evaluation of crack propagation is based on defining adhesion in terms of a stress intensity factor, K, or strain energy release rate, G. Methods of measurement include the DCB test, double torsion test, bending test (3- or 4-point), single-edge notched test, and compact tension test, but there are little experimental data on CS coatings in the literature (Ziemann et al. 2014).
Finally, an indentation test, shown schematically in Fig. 4.68, enables the determination of apparent interfacial toughness (Demarecaux et al. 1996; Marot et al. 2006; Chicot et al. 1996). The indentation test is realized on a polished cross section of a sprayed coating. A Vickers indentation is made at the interface of the coating with the substrate, using an appropriate alignment of the indenter. The crack generated by the penetration is localized along the interface and has a semicircular shape (Fig. 4.68). An appropriate mathematical treatment enables determination of the apparent interfacial toughness, K c. Knowledge of the Young’s moduli and hardness of the coating and substrate is necessary in the calculations.

Schema of the interfacial indention test. (Chicot et al. 1996)
The scratch test, originally studied by Benjamin and Weaver (1960), is often used to characterize thin, hard coatings. The scratch test consists of using an indenter which is moved linearly on the film surface under an increasing load. The load which corresponds to the detachment of the coatings is defined as a critical one. An example of using scratch test on cold-sprayed coating is reported in Seo et al. (2012a, b).
4.10.3.2 Adhesion of CS Coatings
Adhesion of CS coatings primarily depends on the bonding of the particles to the substrate surface. The bonding of particles in cold gas spraying is presumed to be the result of extensive plastic deformation and related phenomena at the interface (Assadi et al. 2003). Thus, most of the factors influencing the adhesion strength are the same influencing the cohesive strength of the coatings, already described in the previous sections. Higher bond strength and particle adhesion are obtained enhancing the particle deformation upon impact, for example, by increasing the particle impact velocity as reported in Fukanuma and Ohno (2004) and Huang and Fukanuma (2012), and, in this sense, the use of helium is more effective to obtain higher adhesion as reported in Vezzu et al. (2014 in the case of Waspaloy coatings. For the same reasons, thanks to the more significant plastic deformation, coatings of ductile metals with lower melting points typically exhibit higher bond strength than coatings of high-strength alloys once the spraying parameters are defined as reported in Li et al. (2007a, b) and Koivuluoto et al. (2008a, b).
Second, bond strength certainly depends on substrate characteristics in terms of both mechanical properties and surface characteristics (roughness, chemical). As for coating material, ductile substrates able to provide significant plastic deformation upon impact often result in higher adhesion values (Fukanuma and Ohno 2004; Gärtner et al. 2006, Stoltenhoff et al. 2006, Fukanuma and Huang 2009); for the same reasons, a partial preheating of the substrate can be employed as a useful procedure to lower the YS of the material enhancing its plastic deformation and, as a consequence, the adhesion of the coating (Suo et al. 2012; Rech et al. 2012) even if excessive preheating can develop detrimental quenching stress in particular when substrate and coating materials have different thermal expansion properties. Looking at the surface state, the effect of the substrate preparation on the adhesion strength is a complex issue, and in this field different results are obtained depending on the combination of considered materials and spray parameters. For example, grit blasting often improves coating adhesion (Irissou et al. 2007; Danlos et al. 2010; Vezzu et al. 2014), thanks to the cleaning effect and crack of the surface oxide layer and also to the enhanced mechanical interlock provided by the surface roughening. Nevertheless, surface roughness is also reported to have no significant effect on the bond strength (Wu et al. 2006), or even to induce a slight decrease of the bond strength, for example, for a Ti6Al4V substrate coated with pure titanium (Price et al. 2006). This negative effect is due to the work hardening associated to the grit-blasting treatment of the substrate surface responsible for the reduced plastic deformation capability of the sprayed coating to bond to the substrate. Other preparation methods can be employed, and their effect has been reported such as polishing, shoot peening, chemical etching (Irissou et al. 2007) or laser ablation and heating (Danlos et al. 2010). Laser ablation in particular is reported to be effective on surface cleaning as well as on promoting intimate bonding between coating and substrate even if the local thermal input can lead to the development of thermally affected zones as well as of significant quenching stress also in case of temperature-sensitive materials as aluminum alloys, as reported in Danlos et al. (2010). However, it must be taken into account that this process modifies also the surface structure and morphology leading to the loss of one essential characteristic of CS deposition.
A further way to influence and improve the bond strength is the possibility to blend the initial powder feedstock with some weight percent of hard, often ceramic, filler such as aluminum oxide or silicon carbide. Indeed, the presence of hard particles in the powder feedstock typically has a beneficial effect on coating adhesion, as reported by many authors (Lee et al. 2005; Irissou et al. 2007; Tao et al. 2009; Wang et al. 2010a, b; Spencer et al. 2012a, b) mainly because of the increased plastic deformation of the ductile particles due to the additional peening effect performed by the hard and essentially un-deformable impinging particles. However, by further increasing the volume fractions of hard particles in the powder feedstock, and as a consequence in the coating microstructure, this gain in bond strength must be balanced with an increased ratio of weak hard–hard and hard–ductile interfaces in respect to strong ductile–ductile interfaces resulting in a progressively reduced coating cohesion and adhesion (Wang et al. 2010a, b; Sevillano et al. 2013). The impinging of the substrate surface with hard particles during the coating growth is reported to be effective to clean the surface removing low adhered stick particles, native oxide and surface defects hence promoting adhesion (Tao et al. 2009). Finally, the thermal evolution of the substrate/coating interface and the local substrate temperature during the deposition of the first layer is fundamental to determine interface reactivity with (eventual) oxide formation, residual stress state and the particle plastic deformation so that some further parameters such as substrate shape and clamping as well as gun velocity and standoff distance can influence the thermal input on the growing coating having a role in the determination of final bond strength.
A review of the bond strength reported in the literature for a wide range of coating and substrate materials is reported in Tables 4.4 and 4.5 concerning coatings obtained using nitrogen or helium as process gas, respectively.
4.10.3.3 Laser Shock Adhesion Test: LASAT®
The LAser Shock Adhesion Test, namely LASAT®, has been especially developed in France to thermally sprayed coatings for the past two decades (Berthe et al. 2011). This development followed a former US work by Gupta (1995) for planar interfaces and thin coatings only. The best stimulus for LASAT® was to accommodate for weaknesses of conventional adhesion tests, primarily “pull-off” testing (Sect. 4.3.5.1). Well-known limitations of the latter relate to the application to high bond strength or porous coatings due to the use of glue. In addition, pull-off testing is rather tedious, time consuming and discrepant, in a limited range of experimental conditions.
-
The Coating substrate bond strength can be determined through the exploitation of laser shock effects in LASAT® (Arrigoni et al. 2012; Fig. 4.69). First, a (primary) compression wave due to a laser pulse of a few GW.cm−2 for a few ns typically. This wave is followed by a release wave. Both waves propagate through the materials system till the primary wave reflects from the free surface of the coating surface in another rarefaction wave. When the two rarefaction waves intersect, a tensile stress forms, to which the coating–substrate interface is submitted. The stress level from which the interface fails corresponds to the bond strength. Stresses can be calculated through the simulation of shock wave propagation using numerical codes such as SHYLAC or RADIOSS. Debonding can be detected from real-time monitoring by interferometry or post-mostem observation of the materials. Two laser shock loading regimes are conventionally used, that is, direct irradiation (Fig. 4.69a) when irradiating the bare material, and the so-called confined regime (Fig. 4.69b) in which the plasma due to laser beam–surface interaction is confined by a transparent medium such as water or glass. Confining the plasma increases laser shock pressure therefore stress loading.
Fig. 4.69 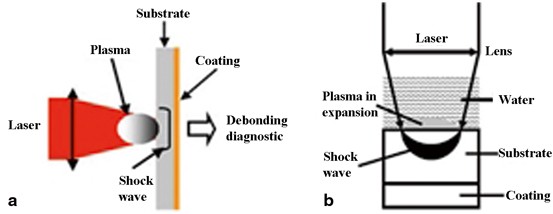
Schematic illustrations of LASAT a in the direct irradiation regime and b in the confined regime. (After Berthe et al. 2011)

-
In addition to the determination of the coating–substrate bond strength in conventional conditions, LASAT® can be performed at a temperature different from room temperature, in a specific atmosphere and/or in a liquid (Guipont et al. 2010). Multilayered materials can also be characterized. LASAT® is very suitable for CS coatings (Blochet et al. 2014; Koivuluoto et al. 2013; Giraud et al. 2012, for the most recent publications), which could highlight the role of oxidation on bond strength in particular (Christoulis et al. 2010; Barradas et al. 2005). Relevant successful advances relate to the feasibility of applying LASAT® to the surface of the coating rather than to the back of the substrate (Begue et al. 2013) and to small-sized materials systems such as splats (Jeandin 2011; Fig. 4.70). The latter was very attractive for investigation into CS in so far as a local approach to phenomena and properties is powerful (see Sects. 4.1 and 4.2). The role of particle oxidation state on adhesion could be exhibited. The bond strength of a splat (for given spraying conditions and material) can decrease dramatically with oxide layer thickness, for example, from 415 to 280 MPa typically for CS Cu onto Al (Fig. 4.70).
Fig. 4.70 
SEM images of the Cu splat—Al substrate system, (top) before and (bottom) after LASAT® for two-particle oxidation levels (after Jeandin 2011). The upper pictures show embedded splats, the lower pictures show the corresponding craters after splat removal due to LASAT®. EPMA electron probe microanalysis

-
Coating cohesion, that is, splat–splat adhesion strength can also be determined using LASAT® using a similar testing process (Barradas et al. 2005).
Two LASAT® variants, still based on laser shock testing, were also developed to go into phenomena which can be considered as very relevant to CS and related understanding of the process.
-
LASERFLEX consists of light amplification by stimulated emission of radiation (LASER) flier experiments in which the flier can be a particle or a foil. Since in-flight conditions can be similar to those encountered in CS, LASERFLEX is claimed to be a tool for experimental simulation of CS (Barradas et al. 2007; Jeandin 2011). Advantages are that this simulation is easier to be controlled and implemented compared to CS.
-
CLASS, that is, Cold LAser Shock Spray, is based on the use of a laser shock to spall off a coating to respray a coating, which could have been obtained by CS (Fig. 4.71; Jeandin et al. 2014). CLASS could be developed. First, this can be expected to be an advanced test to characterize the property gradient within a cold-sprayed coating, though the CLASS process efficiency parameter, for example. Second, CLASS could be a new spraying process using particulate material which would exhibit unique starting properties since made of already-sprayed powder.
Fig. 4.71 
Shadowgraph image of CLASS’ed Ta cold-sprayed coating. The laser pictogram schematizes the laser shock irradiation. (After Jeandin et al. 2014)

From the development of LASAT® and its variants, one may expect that of a novel integrated laser-shock control chain to test powders, for example, for cost-effective, rapid and powerful control at reception of batches. This would consist in LASATesting of splats obtained from LASERFLEX’ed particles onto substrate samples.
4.10.3.4 Microtensile Test
Microtensile testing was recently developed using focussed ion beam (FIB) facilities and successfully applied to cold-sprayed coatings for characterization of interface strength (Ichikawa et al. 2014). FIB is used for various operations, that is, in situ micromachining of a microtensile specimen and a (Si single crystal) microcantilever beam, microsample picking up, tungsten deposition to fix the specimen to the cantilever and to the microprobe, and scanning ion microscopy (SIM) for real-time monitoring of the test in the chamber (Fig. 4.72).

SIM images of the microtensile test set-up (from left to right), before testing, during testing and just before the rupture of the specimen. (After Ichikawa et al. 2014)
The applied load, F, is calculated from the displacement, d, of the cantilever beam, that is,
where E is the elastic modulus, l thelength, w the width and t the thickness of the cantilever.
The rupture stress is equal to the load divided by the fracture area. This area is determined through SEM observation of the fracture surface of the specimen after testing.
Microtensile testing is quite suitable for comparing the strength of the core of splats to that of splat–splat interfaces within the coating and to that of the coating itself, the latter being determined using conventional pull-off testing. Great differences could be shown for cold-sprayed Cu, for example. These were about 670, 180 and 350 MPa when considering interfaces which exhibited microvoids (Ichikawa et al. 2014). The latter were therefore acertained to be major influencing factors on the macroscopic strength of the coating. Micotensile testing shows a high potential to correlate smal-sized microstructure features (Sect. 4.1.) to mechanical properties.
4.10.3.5 Modified Ball-bond Shear Test
Ball-bond shear testing can be modified to be a splat adhesion technique using micro-scratch tester. As described by Goldbaum et al. (2012), the technique consists in applying a normal force, F N, onto a stylus that is placed on the substrate at a certain distance of the splat, the adhesion of which has to be measured. The substrate is then moved horizontally below the stylus (Fig. 4.73). The splat–substrate bond strength is calculated as a function of the tangential force, F T, exerted on the stylus, the baseline force, F B, and the splat area, A, according to the following equation:

Schematic illustration of splat adhesion test including cross-sectional and top views of the splat in the tested area plus a corresponding force–displacement diagram when shearing the splat. (After Goldbaum et al. 2011)
The splat area is determined using optical observation prior to splat shearing. This test can be employed for rather rapid characterization of the influence of various spray processing parameters including the particle diameter. This can complement LASAT® (Sect. 4.3.6.3) due to a different loading mode. Both tests are required as an approach to splat adhesion since assessing the splat-flattening ratio is not enough actually.
4.11 Wear Resistance
Wear properties of the cold-sprayed coatings are reported rather briefly in the literature. These studies are mostly concentrated on friction of coefficient and sliding wear studies. Some examples of the wear properties of cold-sprayed coatings are shown in Table 4.6.
In one research, cold-sprayed nanocrystalline Cu coatings were successfully sprayed, and they showed lower wear rate compared to conventional cold-sprayed coatings (Fig. 4.74). Nanocrystalline Cu has the potential to be used as a coating material in the bearing parts (Liua et al. 2012).

Wear volume versus the applied load for the cold-sprayed nanocrystalline Cu and the cold-sprayed conventional Cu coatings. (Liua et al. 2012)
In the other study, Li et al. (2011) have shown lower abrasive wear rate of heat-treated cold-sprayed FeAl coating compared with 2520 heat-resistant SS at room temperature and at high temperature (800 °C). In this case, dominant abrasive wear mechanism was suggested for microcutting (Li et al. 2011). On the other hand, dry sliding wear behaviour of as-sprayed and heat-treated cold-sprayed Al amorphous/nanocrystalline alloy coatings was studied. Heat-treated coatings exhibited higher wear resistance and lower coefficient of friction (CoF) than as-sprayed coatings (Pitchuka et al. 2014), whereas cold-sprayed Al-based coatings showed better dynamic friction properties than Al bulk material (Attia et al. 2011). Furthermore, improved wear properties of cold-sprayed Al–Al2O3 composite coatings have been reported by Shockley et al. (2013). CoF were found to be lower with increased amount of Al2O3 in the coating. In addition, wear rates were decreased with increased Al2O3 content as presented in Fig. 4.75 (Shockley et al. 2013).

Results of cold-sprayed Al, Al–10.2 wt% Al2O3 and Al–22.6 wt% Al2O3 coatings in in situ tribometry tests. a Average friction of coefficient versus cycles. b Dry sliding wear rate versus cycles. (Shockley et al. 2013)
Spencer et al. (2009) have studied wear properties of cold-sprayed (kinetic metallization) Al and Al + Al2O3 coatings. Sliding wear rate was significantly decreased with increasing amount of Al2O3 particles of as-sprayed and heat-treated Al and 6061 Al alloy coatings, Fig. 4.76. Wear type was changed from adhesive to abrasive while using Al + 75 Al2O3 instead of Al coatings. Figure 4.77 presents SEM images of worn surfaces of cold-sprayed Al and Al + 75 % Al2O3 coating surfaces after sliding wear test (Spencer et al. 2009).

Wear rate of cold-sprayed Al and Al + Al2O3 coatings after ball-on-disk wear studies compared to bulk alloys. (Spencer et al. 2009)

Wear tracks after ball-on-disk wear tests of a cold-sprayed Al and b cold-sprayed Al + 75 % Al2O3 coatings. SEM images. (Spencer et al. 2009)
Wear properties of cold-sprayed WC-based metal matrix composite (MMC) coatings were reported in Melendez et al. (2013). LPCS WC–12 wt% Co blended with Ni on low carbon steel showed decreasing abrasive wear resistance with increasing amount of WC particles in the powder mixture (Melendez et al. 2013). On the contrary, Luo et al. (2014a, b) have found that cold-sprayed 20 vol.% cBN–NiCrAl nanocomposite coating had comparable two-body abrasion wear rate with HVOF-sprayed WC–12Co coating. Furthermore, heat-treated (750 °C, 5 h) cBN–NiCrAl nanocomposite coatings increased wear resistance by 33 % compared with as-sprayed coating.
Some researchers have been focused on self-lubricating cold-sprayed coatings. For example, Stark et al. (2012) have found that embedded hBN particles in Ni and Ni–phosphorous coating reduced 40 % of CoF and the wear volume of 25 % during a reciprocating wear test compared with pure Ni cold-sprayed coatings. In addition, Guo et al. (2014) have studied mechanically blended mixtures of AlCuFeB quasicrystal and bronze powders sprayed by CS process in order to tailor quasicrystal-reinforced MMC coatings. It is stated that, quasicrystal materials have unique properties, such as low surface energy, high hardness, low CoF and good wear and corrosion resistance and thus interesting materials sprayed with CS processes. Porosity level has been decreased with increasing amount of quasicrystal particles in the MMC coating. In addition, CoF decreased slightly with increasing amount of quasicrystal particles in the CuSn powder, whereas wear resistance improved only with low amount of quasicrystal particles due to their reinforcing effect (Guo et al. 2014).
4.12 Corrosion Resistance
During the past years, corrosion studies and research of cold-sprayed coatings and the publications have been rapidly increased. In this part, corrosion is shortly described as phenomena. Cold-sprayed coatings have shown their potential to be used as corrosion barrier coatings due to their dense and impermeable coating structures. Therefore, selection of corrosion properties of cold-sprayed coatings is presented.
4.12.1 Corrosion
Corrosion is related to the chemical or electrochemical reaction between material (e.g. metal, coating) and its environment (Jones 1996). Corrosion resistance is necessary in several industries, in, for example, chemical and process equipment, and energy production systems. Generally, corrosion protection of metals is based on anodic protection by passivity or cathodic protection by sacrificial anode behaviour. Basically, corrosion starts if protection fails or breaks down, making a metal vulnerable to attacks of corrosion (Talbot and Talbot 1998).
Corrosion can occur in different forms, for example, uniform, pitting, crevice and galvanic corrosion are typical forms of corrosion for coatings. The most common forms of localized corrosion are pitting and crevice corrosion in which corrosive conditions could penetrate relatively rapidly (Jones 1996). Pitting corrosion occurs if the passive layer of protecting material is locally damaged, pits form on the surface and underlying metal is open for the attack (Frankel 2003). Therefore, pitting corrosion causes highly localized damages (Schweitzer 1996). For coatings, where structures are not totally adhering and uniform, pitting corrosion takes place quite easily. Porosity in the anodically protective coatings accelerates pitting type corrosion by opening the way for aqueous solution to penetrate inside the coating structure (Chatterjee et al. 2001). Crevice corrosion is said to be one of the most damaging forms of corrosion, and it causes localized corrosion (Kelly 2003). Galvanic corrosion occurs when two dissimilar metals form an electrical couple in the same electrolyte. In the electrical couple, corrosion starts in the less corrosion-resistant material (more active) which becomes the anode, whereas the more resistant material (nobler) will be cathode (Baboian 2003). Metallographic structure and microstructural properties affect corrosion behaviour (Jones 1996). Cathodic materials protect less noble materials anodically, whereas anodic materials give cathodic protection to the nobler material. The cathodic protection is based on sacrificial behaviour of anodic material, for example, Zn-based coating on steel substrate. In that case, porosity is not critical, whereas in the anodically protective coatings, impermeability of the coating and passive layer on its surface is critical for corrosion resistance.
4.12.1.1 Corrosion Tests
Open-cell potential measurements and salt spray (ASTM B117 standard) tests as wet corrosion tests are relevant methods to evaluate the denseness (density, impermeability) of coatings on corrodible substrate (e.g. carbon steel in saltwater conditions). Additionally, salt spray (fog) testing is a commonly used test method to evaluate the quality of various coatings. This particular test enables the use of different corrosive solutions and different test temperatures in a controlled test condition (B117-90 1992). Corrosion protectiveness and corrosion rates can be estimated with polarization behaviour of the coatings (Schweitzer 1996). Polarization measurements are widely used in the corrosion studies of cold-sprayed coatings. Furthermore, corrosion properties can be studied with more application-related tests, for example, hot corrosion tests and electrochemical corrosion tests in certain specific exposure conditions.
4.12.1.1.1 Open-Cell Potential Behaviour
Existing interconnected porosity (through porosity or open porosity) can be evaluated by using open-cell potential measurements. While microscopic characterization reveals structural details of the coatings, denseness can be analysed by corrosion studies. Figure 4.78 illustrates the potential behaviour of coating, substrate and porous coating. If the coating contains interconnected porosity, potential behaviour is composed of potentials of both coating and substrate which is seen as mixed potential.

Potential behaviour of the coating as a function of porosity. (Vreijling 1998)
If the open-cell potential value of the coating approaches the value of the corresponding bulk material, it indicates impermeable and dense coating structure. However, if the value of the coating approaches the value of the substrate material, it reflects the through porosity in the coating structure. In such situations, testing liquid has an open access to penetrate from the surface of the coating to the interface between coating and substrate, it will corrode the substrate, and corrosion products will come up to the surface. Figure 4.79 presents the open-cell potential behaviour of dense cold-sprayed coatings (Ta, Cu, Ni) and cold-sprayed coating with open porosity (NiCr).

Open-cell potential behaviour of Ta and Cu bulk materials, electrolytically prepared Ni (Ni(E)), cold-sprayed Ta, Cu, Ni and NiCr coatings and Fe52 substrate material in 3.5 % NaCl solution (Ag/AgCl reference electrode). HPCS high-pressure cold spray. (Modified after Koivuluoto et al. 2008b)
4.12.2 Corrosion Properties of Cold-Sprayed Coatings
Corrosion properties and behaviour of the cold-sprayed coatings are increasingly reported in the literature during the past years. Recently, review papers concerning corrosion properties of cold-sprayed coatings have been published by Bala et al. (2014) and Koivuluoto and Vuoristo (2014). Most of the corrosion studies of cold-sprayed coatings are concentrated on the corrosion protection of materials which give cathodic protection based on sacrificial behaviour, for example, Zn, Al and Al-based composites (Maev and Leshchynsky 2006; Champagne 2007; Djordjevic and Maev 2006; Karthikeyan et al. 2004; Blose et al. 2005; Xiong et al. 2009; Villafuerte et al. 2009; Kroemmer and Heinrich 2006; Chavan et al. 2013; Bu et al. 2012b; DeForce et al. 2012; Spencer et al. 2009; Dzhurinskiy et al. 2012). For instance, Blose et al. (2005) have reported the successful corrosion protection of steel substrates with cold-sprayed Zn, Al, and Zn–Al coatings against wet corrosion. Karthikeyan et al. (2004) have shown that corrosion resistance of the cold-sprayed Al coatings was higher than that of Al bulk material analysed using polarization measurements. Figure 4.80 shows polarization behaviour of cold-sprayed Al coatings and Al bulk material. Passivation of the coatings is first linear and then curving slightly followed by linear behaviour again. This indicates repassivation of the coatings (Karthikeyan et al. 2004).

Polarization behaviour of cold-sprayed 1100 Al coatings and 1100 Al bulk material in 0.5 M H2SO4. (Balani et al. 2005a)
In the other study, cold-sprayed Al coating on Mg–alloy substrate had dense structure and due to that, sufficient corrosion protection in NaCl solution (Tao et al. 2010). In addition, the cold-sprayed Al + Al2O3 coatings performed improved anti-corrosion ability compared with Al bulk material in the polarization measurements (Xiong et al. 2009). LPCS Al coatings act as sacrificial anode and protect the AA2024 substrate, reflecting possibilities for corrosion protection in atmospheric and seawater conditions (Villafuerte et al. 2009). In addition, dense cold-sprayed Al coating has shown to protect sintered NdFeB magnets for the corrosion (Ma et al. 2014). Dense structures and good corrosion resistances of low-pressure cold-sprayed Al, Al + Al2O3, Al + Zn + Al2O3 coatings have been also achieved by Dzhurinskiy et al. (2012). Figure 4.81 shows corrosion potential behaviour of these coatings. Cold-sprayed Al coating (CP1) had similar corrosion potential behaviour than Al bulk material. Additionally, corrosion potential moves noble with increasing exposure time in the case of Al coatings with Al2O3 (CP2 and CP3). This can be caused by the growth of protective oxide layer. On the other hand, corrosion potential decreases Al + Al2O3 + Zn coatings with increasing exposure time which can be explained by sacrificial behaviour of Zn and dissolution of the coating layer (Dzhurinskiy et al. 2012).

Corrosion potential (Ecorr) as a function of salt fog corrosion test. Sample codes are presented in the table. ASTM American Society for Testing and Materials. (Dzhurinskiy et al. 2012)
There is high potential to use CS processes in the production of corrosion barrier coatings (low porosity; Papyrin et al. 2007). The cold-sprayed Al and Zn coatings (Kroemmer and Heinrich 2006; Bu et al. 2012b) and LPCS Zn/Al/ Al2O3 coatings (Djordjevic and Maev 2006) are able to be used for corrosion protection. Zinc coatings are widely used as corrosion protection of steel components in aqueous and marine environments. Zinc gives sacrificial protection over steel due to its more negative corrosion potential. Chavan et al. (2013) have studied polarization behaviour of as-sprayed and heat-treated cold-sprayed Zn coatings in 3.5 %NaCl solution. Coatings’ lifetime was increased as sacrificial coating due to the as-sprayed and heat-treated cold-sprayed Zn coatings formed protective passive layer which improved corrosion resistance of Zn coatings. Furthermore, heat-treated Zn coating had reduced corrosion current density, indicating its longer corrosion protection (Chavan et al. 2013).
One potential for corrosion protection by cold-sprayed coatings is Al-based coatings on Mg-based substrate material. Mg-based alloys are widely used in structural components due to their low weight and high strength. However, corrosion and wear properties are not very good. In order to improve the corrosion resistance, Mg–alloy components are coated with corrosion resistance materials, for example, Al and Al-based composite coatings. Improvement of the corrosion properties of Al coatings on Mg substrate was achieved by adding ceramic particles to the metallic powder. Cold-sprayed Al + Al2O3 coatings had similar corrosion resistance than bulk Al alloys (Spencer et al. 2009). Addition of hard particles to the powder mixture has three main functions: (i) to keep the nozzle clean (eliminate nozzle clogging), (ii) to activate the sprayed surface and (iii) to hammer the coating structure (densification; Koivuluoto et al. 2008a). In the other study, denseness of cold-sprayed Al coatings was improved by using Al + Mg17Al12 blended powders. Addition of hard intermetallic particles decreased porosity and improved corrosion resistance. Behaviour of the coatings is closer to the Al bulk, reflecting corrosion protection behaviour over substrate material (Bu et al. 2012b).
Also, corrosion properties of cold-sprayed Al–5Mg coatings have been studied (DeForce et al. 2012). Coatings have shown their potential for corrosion protection due to the fact that they behave very well in corrosion study, and after 1000 h exposure in salt spray test, there was not any sign of Mg corrosion observed on the coating surfaces. In addition, coating had minimal galvanic reaction coupled with Mg, indicating galvanic compatibility (DeForce et al. 2012).
Denseness, density and impermeable structures are the first criterion for the corrosion resistance of coatings which are nobler than substrate material. For example, Cu, Ta, Ni and Ni-based alloys are nobler than steel substrate. Denseness means impermeability of the coatings, indicating coating structures without existing through porosity. Denseness or, on the other hand, existing through porosity is identified by using corrosion tests. Cold-sprayed Ni, Ta, Ti, SS, and brass coatings with low porosity in their structures are reported to have potential for corrosion resistance applications (Koivuluoto et al. 2010b; Koivuluoto and Vuoristo 2010a; Marx et al. 2005; Hoell and Richter 2008; Bala et al. 2010b; Wang et al. 2006; Wang et al. 2008; AL-Mangour et al. 2013).
The open-cell potential measurements and salt spray tests showed that the LPCS Cu and Cu + Al2O3 coatings contained through porosity in their structures. Open-cell potentials of the coatings were close to the values of Fe52 substrate material (Koivuluoto et al. 2008a; Koivuluoto and Vuoristo 2010b). Regardless, in the CS process, powder type and composition had strong influence on the denseness of the coatings. Denseness of the coatings was improved with Al2O3 particle addition. Optimal composition of metallic and ceramic particles in the powder mixture depends on sprayed material combination and powder type of metallic particles (Koivuluoto and Vuoristo 2010b). Figure 4.82 shows overall dense coating structures of the HPCS Cu and Ta coatings, having a similar open-cell potential behaviour with corresponding bulk materials. The coatings remained stable in the long-time exposure, indicating their structural durability (Koivuluoto et al. 2010b). These materials are under the high-interest category due to the fact that tantalum has extraordinary corrosion resistance (ASM Handbook 13B, ASM Metals Handbook 2005) due to the formation of a highly stable passivating layer (Schweitzer 1996). Tantalum resists corrosion effectively in acids (not HF), salts and organic chemicals even at elevated temperatures (ASM Handbook 13B, ASM Metals Handbook 2005). Furthermore, tantalum as a dense coating acts like corrosion barrier coating on a steel substrate, providing high corrosion resistance in many environments (Jones 1996).

Open-cell potentials of high-pressure cold spray (HPCS) Ta and Cu coatings, Ta and Cu bulk materials and Fe52 substrate material as a function of exposure time in 3.5 %NaCl solution. Ag/AgCl, reference electrode. (Koivuluoto et al. 2010b)
Ta bulk material and dense HPCS Ta coating get passivated rapidly, and, above their passivation potential, corrosion rate falls to a very low value in the passive area due to the stable passive layer (Jones 1996). Table 4.7 shows the corrosion characteristics of the tantalum bulk material and the HPCS Ta coating in NaCl and H2SO4 solutions at 22 and 80 °C. Coatings and bulk material had similar corrosion characteristics (Koivuluoto et al. 2009). Dense HPCS Ta coating behaved like the bulk material, indicating real corrosion resistance of the coating.
In addition, the electrochemical tests in 1 M KOH solution revealed stable passive behaviour of the HPCS Ta coatings due to the fully dense coating structures. Figure 4.83 shows similar anodic corrosion behaviour of Ta bulk and cold-sprayed Ta coatings on different substrates (CSTa1 on Al, CSTa2 on Cu and CSTa3 on steel; Koivuluoto et al. 2010a).

Polarization behaviour of cold-sprayed Ta coatings (CSTa1 on Al, CSTa2 on Cu and CSTa3 on steel), Ta bulk material and inert plasma-sprayed (IPS) Ta coating in 1 M KOH. (Koivuluoto et al. 2010a)
Open-cell potentials of as-sprayed and heat-treated HPCS Ni and Ni–20Cu coatings have been reported to be closer to the bulk materials (Ni and Ni-30Cu) than to the substrate material (Fe52), indicating high coating quality (Koivuluoto and Vuoristo 2010a). The denseness of Ni and Ni–Cu coatings was improved with heat treatments. Heat treatment densified the coating structures due to the recovery, recrystallization and void reduction by the softening and rearrangement of grains (Koivuluoto et al. 2007, 2014; Koivuluoto and Vuoristo 2010a). The denseness of HPCS Ni coatings was also improved by using optimized spraying parameters (Koivuluoto and Vuoristo 2010a). On the other hand, one way to improve the denseness of the coatings was to add hard particles into the metallic powder (Koivuluoto and Vuoristo 2009, 2010a; Koivuluoto et al. 2014). For example, denseness of cold-sprayed NiCu was improved with the addition of Al2O3 particles. Figure 4.84 presents coating surfaces after an 80-h exposure in Corrodkote test. Denser structures were achieved with heat treatment and Al2O3 addition. Corrodkote test is 100 times more aggressive than salt spray fog test (Koivuluoto et al. 2014).

As-sprayed and heat-treated HPCS NiCu and NiCu + Al2O3 coating surfaces after an 80-h exposure in Corrodkote test. (After Koivuluoto et al. 2014)
Generally speaking, Ni–Cr alloys have high oxidation and corrosion resistance in high temperatures, and, therefore, they are used in boilers and electrical furnaces. The suitability of cold-sprayed Ni–50Cr coatings for these conditions has been studied with accelerated hot corrosion tests in molten salt Na2SO4–60 %V2O5 paste (900 °C, 1 h) (Bala et al. 2010b). These coatings had dense and oxygen-free structures, and they showed better corrosion resistance than uncoated boiler steels (Fig. 4.85; Bala et al. 2010b). Furthermore, cold-sprayed Ni–20Cr coating had better corrosion-erosion resistance than uncoated T22 boiler steel substrate (Bala et al. 2012). However, in the comparison between cold-sprayed and HVOF-sprayed Ni–20Cr coatings, HVOF coatings behave better due to the Cr2O3 layer formed on the surface (Bala et al. 2012). Hot corrosion resistance of cold-sprayed Ni–20Cr coating was better than uncoated steel substrate which is explained by the formation of protective oxides (Bala et al. 2010a). In the other study, Ni-based amorphous coatings with high corrosion resistance were prepared by using kinetic metallization (cold spraying). For example, cold-sprayed NiNbTiZrCoCu coating had an extremely low passive current density and wide passive region, indicating extreme corrosion resistance (Wang et al. 2006).

Hot corrosion studies of cold-sprayed Ni–50Cr coatings and uncoated substrates. a Weight change/area versus time. b Weight change/area versus number of cycles in Na2SO4–60 % V2O5 environment at 900 °C. (Bala et al. 2010b)
Ti and Ti alloys have good corrosion properties, and they are widely used in marine environments (Wang et al. 2008). Corrosion properties of cold-sprayed Ti coatings and denseness improvements have been reported (Wang et al. 2008). Cold-sprayed Ti coating sprayed with high pressure and high temperature had the lowest porosity and thus better corrosion properties. As-polished Ti coating sprayed with optimized spray parameters showed similar behaviour than Ti bulk material. Only, polarization current density was higher, caused by differences between densities of coating (Wang et al. 2008).
Titanium is also used in biomedical applications due to its good corrosion resistance and biocompatibility. Corrosion protection is based on the formation of passive titanium dioxide layer. Furthermore, addition of hydroxyapatite (HAP) improves bioactivity. Reportedly, corrosion resistance of cold-sprayed Ti + 50HAP was better than cold-sprayed Ti + 20HAP (Zhou and Mohanty 2012). In addition, heat treatment improved corrosion behaviour of the Ti + 20HAP coating. All coatings had passivation range; Ti + 50HAP was the most stable (Zhou and Mohanty 2012). Additionally, cold-sprayed Ti coatings were densified by vacuum heat treatment as posttreatment (Hussain et al. 2011). On the other hand, Marrocco et al. (2011) have improved corrosion resistance of cold-sprayed Ti coatings by post-treating the coatings with laser. They densified the top of the coatings and that way eliminated interconnected porosity. As the results show, posttreated cold-sprayed Ti coatings had a similar corrosion resistance that corresponding bulk Ti had, which is shown in the polarization tests (Fig. 4.86; Marrocco et al. 2011).

Potentiodynamic polarization scans in 3.5 % NaCl of bulk Ti, carbon steel and as-sprayed Ti coating (on carbon steel and laser-treated Ti coating). (Marrocco et al. 2011)
Additionally, Dosta et al. (2013) have studied corrosion properties of cold-sprayed WC–25Co coatings. Dense coatings were produced, and any sign of corrosion was not detected in the coatings after electrochemical studies in NaCl solutions (Dosta et al. 2013). In the other study, corrosion properties of cold-sprayed SS coatings were studied (AL-Mangour et al. 2013). SSs and Co–Cr alloys have been used in medical applications due to their high corrosion resistance. AL-Mangour et al. (2013) have cold-sprayed SS mixed with Co–Cr particles. They reduced porosity by optimizing composition of the composite (33 %Co–Cr) and heat treating the coatings. Improvement of the corrosion resistance was detected with the polarization behaviour. Composite coatings had lower corrosion rate compared with pure SS (Fig. 4.87; AL-Mangour et al. 2013).

Polarization behaviour of cold-sprayed stainless steel (SS) + CoCr coatings a as-sprayed coatings and b annealed (1100 °C) coatings. (AL-Mangour et al. 2013)
Cold-sprayed SS coatings had similar polarization behaviour with corresponding bulk material with optimized powder properties. Spencer and Zhang (2011) have found the highest corrosion resistance of cold-sprayed SS coating with mixed powders (− 10 and − 22 µm). Two 316L powders with different particle size distributions were mixed, and this way improved the corrosion resistance of coating close to that of bulk material (Spencer et al. 2011). Corrosion properties were also detected to coating thickness; coating with higher thickness had higher corrosion resistance analysed by polarization behaviour (Spencer et al. 2011) and surface finishing (polished surfaces had higher corrosion resistance than as-sprayed coatings with certain roughness (Wang et al. 2008)).
References
Ajaja, J., D. Goldbaum, and R. R. Chromik. 2011. Characterization of Ti cold spray coatings by indentation methods. Acta Astronautica 69 (11–12): 923–928.
Ajdelsztajn, L., J. M. Schoenung, B. Jodoin, et al. 2005. Cold spray deposition of nanocrystalline aluminum alloys. Metallurgical and Materials Transactions A 36:657–666.
Ajdelsztajn, L., B. Jodoin, and J. M. Schoenung. 2006. Synthesis and mechanical properties of nanocrystalline Ni coatings produced by cold gas dynamic spraying. Surface & Coatings Technology 201:1166–1172.
AL-Mangour, B., Mongrain, R., Irissou E., and S. Yue. 2013. Improving the strength and corrosion resistance of 316 L stainless steel for biomedical applications using cold spray. Surface and Coatings Technology 216:297–307.
Amsellem, O., F. Borit, D. Jeulin, et al. 2012. Three-dimensional simulation of porosity in plasma sprayed alumina using microtomography and electrochemical impedance spectrometry for finite element modeling of properties. Journal of Thermal Spray Technology 21:193–201.
Andreola, F., C. Leonelli, M. Romagnoli, et al. 2000. Techniques used to determine porosity. American Ceramic Society Bulletin 79:49–52.
Arrigoni, M., M. Boustie, C. Bolis, et al. 2012. Shock mechanics and interfaces. In Mechanics of solid interfaces, eds. M. Braccini and M. Dupeux, 211–248. London: Wiley.
Ashgriz, N. 2011. Handbook of atomization and sprays: Theory and applications. New York: Springer.
ASM Handbooks Online. 2003. Corrosion: Fundamentals, testing, and protection, passivity, general aspects, vol. 13A. Materials Park: ASM International.
ASM Metals Handbook. 2005. Corrosion: Materials, corrosion of nonferrous alloys and speciality products, corrosion of tantalum and tantalum alloys, vol. 13B. Materials Park: ASM International.
Assadi, H., F. Gartner, T. Stoltenhoff, et al. 2003. Bonding mechanism in cold gas spraying. Acta Materialia 51:4379–4394.
Assadi, H., T. Schmidt, H. Richter, J. O. Kliemann, K. Binder, F. Gaertner, T. Klassen, and H. Kreye. 2011. On parameter selection in cold spraying. Journal of Thermal Spray Technology 20 (6): 1161–1176.
Assadi, H., T. Klassen, F. Gartner, et al. 2014. Modelling of impact and bonding of inhomogeneous particles in cold spraying. In International thermal spray conference, Barcelona, 21–23 May 2014, 203–207.
Attia, H., M. Meshreki, A. Korashy, V. Thomson, and V. Chung. 2011. Fretting wear characteristics of cold gas-dynamic sprayed aluminum alloys. Tribology International 44:1407–1416.
Au, P., et al. 1980. Flow property measurements from instrumented hardness Tests. Non-destructive evaluation in the nuclear industry, vol. 10, 597–610. New York: ASM.
B117-90. 1992. Standard test method of salt spray (Fog) testing. Annual book of ASTM standards, 19–25. Philadelpia: ASTM.
Baboian, R. 2003. Galvanic corrosion, corrosion fundamentals, testing, and protection, ASM handbook, vol. 13A, 210–213. Materials Park: ASM International.
Bae, G., K. Kanga, H. Naa, J. J. Kimb, and C. Lee. 2010. Effect of particle size on the microstructure and properties of kinetic sprayed nickel coatings. Surface and Coatings Technology 204 (20): 3326–3335.
Bae, G., J. I. Jang, and C. Lee. 2012. Correlation of particle impact conditions with bonding, nanocrystal formation and mechanical properties in kinetic sprayed nickel. Acta Materialia 60 (8): 3524–3535.
Bageri, S., P. I. Fernàndez, R. Ghelichi, M. Guagliano, and S. Vezzù. 2010. Effect of shot peening on residual stresses and surface work-hardening in cold sprayed coatings. Key Engineering Materials 417–418:397–400.
Bala, N., H. Singh, and S. Prakash. 2010a. High temperature corrosion behavior of cold spray Ni-20Cr coating on boiler steel in molten salt environment at 900 °C. Journal of Thermal Spray Technology 19 (1–2): 110–118.
Bala, N., H. Singh, and S. Prakash. 2010b. Accelerated hot corrosion studies of cold spray Ni–50Cr coating on boiler steels. Materials & Design 31:244–253.
Bala, N., H. Singh, S. Prakash, and J. Karthikeyan. 2012. Investigations on the behavior of HVOF and cold sprayed Ni–20Cr coating on T22 boiler steel in actual boiler environment. Journal of Thermal Spray Technology 21 (1): 144–158.
Bala, N., H. Singh, J. Karthikeyan, and S. Prakash. 2014. Cold spray coating process for corrosion protection: A review. Surface Engineering 30 (6): 414–421.
Balani, K., A. Agarwal, S. Seal, and J. Karthikeyan. 2005a. Transmission electron microscopy of cold sprayed 1100 aluminum coating. Scripta Materialia 53:845–850.
Balani, K., T. Laha, A. Agarwal, J. Karthikeyan, and N. Munroe. 2005b. Effect of carrier gases on microstructural and electrochemical behavior of cold-sprayed 1100 aluminum coating. Surface and Coatings Technology 195:272–279.
Barradas, S., R. Molins, M. Jeandin, et al. 2005. Application of laser shock adhesion testing to the study of the interlamellar strength and coating substrate adhesion in cold sprayed. Surface and Coatings Technology 197:18–27.
Barradas, S., V. Guipont, R. Molins, et al. 2007. Laser shock flier impact simulation of particle substrate interactions in cold spray. Journal of Thermal Spray Technology 16:548–556.
Beghini, M., L. Bertini, and V. Fontanari. 2002. On the possibility to obtain the stress-strain curve for a strain-hardening material by spherical indentation. International Journal of Computer Applications in Technology 15 (4): 168–175.
Beghini, M., L. Bertini, and V. Fontanari. 2006. Evaluation of the stress–strain curve of metallic materials by spherical indentation. International Journal of Solids and Structures 43 (7–8): 2441–2459.
Begue, G., G. Fabre, V. Guipont, et al. 2013. Laser shock adhesion test (LASAT) of EB-PVD TBCs: towards an industrial application. Surface and Coatings Technology 237:305–132.
Benabdi, M., and A. Roche. 1997. Mechanical properties of thin and thick coatings applied to various substrates, Part I, an elastic analysis of residual stresses within coating materials. Journal of Adhesion Science and Technology 11 (2): 281–299.
Benjamin, P., and C. Weaver. 1960. Measurement of adhesion of thin films. Proceedings of the Royal Society of London. Series A. Mathematical and Physical Sciences 254 (1277): 163–176.
Berthe, L., M. Arrigoni, J. P. Boustie, et al. 2011. State of the art laser adhesion test (LASAT). Nondestructive Testing and Evaluation 26:303–317.
Binder, K., J. Gottschalk, M. Kollenda, F. Gartner, and T. Klassen. 2011. Influence of impact angle and gas temperature on mechanical properties of titanium cold spray deposits. Journal of Thermal Spray Technology 20 (1–2): 234–240.
Blochet, Q., F. Delloro, F. Borit, et al. 2014. Influence of spray angle on the cold spray of Al for the repair of aircraft components. In International thermal spray conference, Barcelona, 21–23 May 2014, 69–74.
Blose, R., D. Vasquez, and W. Kratochvil. 2005. Metal passivation to resist corrosion using the cold spray process. Thermal Spray 2005: Explore its surfacing potential!. Basel: ASM International.
Bolelli, G., et al. 2010. Depth-sensing indentation for assessing the mechanical properties of cold-sprayed Ta. Surface and Coatings Technology 205 (7): 2209–2217.
Borchers, C., F. Gartner, T. Stoltenhoff, and H. Kreye. 2005. Formation of persistent dislocation loops by ultra-high strain rate deformation during cold spraying. Acta Materialia 53:2991–3000.
Brenner, A., and S. Senderoff. 1949. National Bureau of Standards. Research Paper RP1954, vol. 42, 105–123.
Bu, H., M. Yanodouzi, C. Lu, and B. Jodoin. 2012a. Post-heat treatment effects on cold sprayed aluminium coatings on AZ91D magnesium substrates. Journal of Thermal Spray Technology 21 (3–4): 731–739.
Bu, H., M. Yandouzi, C. Lu, D. MacDonald, and B. Jodoin. 2012b. Cold spray blended Al + Mg17Al12 coating for corrosion protection of AZ91D magnesium alloy. Surface and Coatings Technology 207:155–162.
Champagne, V., ed. 2007. The cold spray materials deposition process: fundamentals and applications, 362 Cambridge: Woodhead Publishing Ltd.
Champagne, V. K., and D. J. Helfritch. 2014. Mainstreaming cold spray—Push for applications. Surface Engineering 30 (6): 396–403.
Champagne, V. K., D. Helfritch, P. Leyman, et al. 2005. Interface material mixing formed by the deposition of copper on aluminum. Journal of Thermal Spray Technology 14:330–334.
Chatterjee, U., S. Bose, and S. Roy. 2001. Environmental degradation of metals. New York: Marcel Dekker Inc.
Chavan, N. M., B. Kiran, A. Jyothirmayi, P. P. Sudharshan, and G. Sundararajan. 2013. The corrosion behavior of cold sprayed zinc coatings on mild steel substrate. Journal Thermal Spray Technology 22 (4): 463–470.
Chen, Z., et al. 2014. A review on the mechanical methods for evaluating coating adhesion. Acta Mechanica 225 (2): 431–452.
Chicot, D., P. Démarécaux, and J. Lesage. 1996. Interfacial indentation test for the determination of adhesive properties of thermal sprayed coatings. Thin Solid Films 283:151–157.
Choi, W. B., L. Li, V. Luzin, R. Neiser, T. Gnäupel-Herold, H. J. Prask, S. Sampath, and A. Gouldstone. 2007. Integrated characterization of cold sprayed aluminum coatings. Acta Materialia 55:857–866.
Christoulis, D. K., S. Guetta, E. Irissou, et al. 2010. Cold spraying coupled to nano-pulsed Nd-YAG laser surface pre-treatment. Journal of Thermal Spray Technology 19:1062–1073.
Christoulis, D. K., S. Guetta, V. Guipont, et al. 2011. The influence of the substrate on the deposition of cold sprayed titanium: an experimental and numerical study. Journal of Thermal Spray Technology 20:523–533.
Cinca, N., and J. M. Guilemany. 2013. Structural and properties characterization of stellite coatings obtained by cold gas spraying. Surface and Coatings Technology 220:90–97.
Cinca, N., M. Barbosa, S. Dosta, et al. 2010. Study of Ti deposition onto Al alloy by cold gas spraying. Surface and Coatings Technology 205:1096–1102.
Cinca, N., E. López, S. Dosta, and J. M. Guilemany. 2013a. Study of stellite-6 deposition by cold gas spraying. Surface and Coatings Technology 232:891–898.
Cinca, N., J. M. Rebled, S. Estradé, et al. 2013b. Influence of the particle morphology on the cold gas spray deposition behavior of titanium on aluminum light alloys. Journal of Alloys and Compounds 554:89–96.
Cizek, J., O. Kovarik, J. Siegl, K. A. Khor, and I. Dlouhy. 2013. Influence of plasma and cold spray deposited Ti layers on high-cycle fatigue properties of Ti6Al4V substrates. Surface and Coatings Technology 217:23–33.
Cochelin, E., F. Borit, G. Frot, et al. 1999. Oxidation and particle deposition modeling in plasma spraying of Ti–6Al–4V/SiC fiber composites. Journal of Thermal Spray Technology 8:117–124.
Coddet, P., C. Verdy, C. Coddet, F. Lecoutrier, and F. Debray. 2014. Comparison of cold sprayed Cu–0.5Cr–0.05Zr alloys after various heat treatments versus forged and vacuum plasma sprayed alloys. Journal of Thermal Spray Technology 23 (3): 486–491.
Couto, M., S. Dosta, M. Torrell, J. Fernández, and J. M. Guilemany. 2013. Cold spray deposition of WC-17 and 12Co cermets onto aluminum. Surface and Coatings Technology 235:54–61.
Ctibor, P., R. Lechnerova, and V. Benes. 2006. Quantitative analysis of pores of two types in a plasma sprayed coating. Materials Characterization 56:297–304.
Danlos, Y., S. Costil, X. Guo, H. Liao, and C. Coddet. 2010. Ablation laser and heating laser combined to cold spraying. Surface and Coatings Technology 205 (4): 1055–1059.
Davis, J. R. 2004. Tensile testing. Materials Park: ASM International.
DeForce, B. S., T. J. Eden, and J. K. Potter. 2011. Cold spray Al–5 % Mg coatings for the corrosion protection of magnesium alloys. Journal of Thermal Spray Technology 20 (6): 1352–1358.
Delloro, F., M. Faessel, H. Proudhon, et al. 2014a. A morphological approach to the modeling of the cold spray process. In International thermal spray conference, Barcelona, 21–23 May 2014, 221–226.
Delloro, F., M. Faessel, D. Jeulin, et al. 2014b. X ray micro-tomography and modeling of cold sprayed coated powders. In International thermal spray conference, Barcelona, 21–23 May 2014, 886–891.
Demarecaux, P., D. Chicot, and J. Lesage. 1996. Interface indentation test for the determination of adhesive properties of thermal sprayed coatings. Journal of Materials Science Letters 15 (16): 1377–1380.
Descurninges, L. L., L. T. Mingault, V. Guipont, et al. 2011. Influence of powder particles oxidation on properties of cold sprayed tantalum. In Thermal spray 2011: Proceedings of the international thermal spray conference, ed. J. Jerzembeck, 60–65. Düsseldorf: DVS.
DIN 50359-1. 1997. Universal hardness testing of metallic materials, test method.
Djordjevic, B., and R. Maev. 2006. SIMATTM application for aerospace corrosion protection and structural repair. In Thermal spray 2006: building on 100 years of success, eds. B. Marple, M. Hyland, Y.-C. Lau, R. Lima, and J. Voyer. Seattle: ASM International.
Dosta, S., M. Couto, and J. M. Guilemany. 2013. Cold spray deposition of a WC-25Co cermet onto Al7075-T6 and carbon steel substrates. Acta Materialia 61:643–652.
Dupuis, P., Y. Cormier, A. Farjam, B. Jodoin, and A. Corbeil. 2014. Performance evaluation of near-net pyramidal shaped fin arrays. International Journal of Heat and Mass Transfer 69:34–43.
Dykhuizen, R. C., M. F. Smith, D. L. Gilmore, et al. 1999. Impact of high velocity cold spray particles. Journal of Thermal Spray Technology 8:559–564.
Dzhurinskiy, D., E. Maeva, E. Leshchinsky, and R. Maev. 2012. Corrosion protection of light alloys using low pressure cold spray. Journal of Thermal Spray Technology 21 (2):304–313.
Field, J. S., and M. V. Swain. 1995. Determining the mechanical properties of small volumes of material from submicrometer spherical indentations. Journal of Materials Research 10 (1):101–112.
Fischer-Cripps, C. A. 1997. Elastic–plastic behaviour in materials loaded with a spherical indenter. Journal of Materials Science 32 (3): 727–736.
Fischer-Cripps, A. C. 2000. Introduction to contact mechanics. New York: Springer.
Fischer-Cripps, A. C. 2005. The IBIS handbook of nanoindentation. Forestville: Fischer-Cripps Laboratories Pty Ltd.
Fischer-Cripps, A. C. 2011. Nanoindentation, 3rd ed. New York: Springer.
Frankel, G. 2003. Pitting corrosion, corrosion fundamentals, testing, and protection, ASM Handbook, vol. 13A, 236–241. Materials Park: ASM International.
Fukanuma, H., and R. Huang. 2009. Development of high temperature gas heater in the cold spray coating system. In Thermal spray 2009: Proceedings of the international thermal spray conference, 267–272.
Fukanuma, H., and N. Ohno. 2004. A study of adhesive strength of cold spray coatings. In Proceedings of the international thermal spray conference. ASM International.
Gan, J. A., and C. C. Berndt. 2014. Surface roughness of plasma sprayed coatings: a statistical approach. In International thermal spray conference, Barcelona, 21–23 May 2014, 599–604.
Ganesan, A., J. Affi, M. Yamada, et al. 2012. Bonding behavior studies of cold sprayed copper coating on the PVC polymer substrate. Surface and Coatings Technology 207:262–269.
Gärtner, F., T. Stoltenhoff, T. Schmidt, and H. Kreye. 2006. The cold spray process and its potential for industrial applications. Journal of Thermal Spray Technology 15 (2): 223–232.
Ghelichi, R., D. MacDonald, S. Bagherifard, H. Jahed, M. Guagliano, and B. Jodoin. 2012. Microstructure and mechanical behavior of cold spray coated Al5052. Acta Materialia 60:6555–6561.
Ghelichi, R., S. Bagherifard, D. Mac Donald, M. Brochu, H. Jahed, B. Jodoin, and M. Guagliano. 2014a. Fatigue strength of Al alloy cold sprayed with nanocrystalline powders. International Journal of Fatigue 65:51–57.
Ghelichi, R., S. Bagherifard, D. Mac Donald, M. Brochu, I. Fernandez-Pariented, B. Jodoin, and M. Guagliano. 2014b. Experimental and numerical study of residual stress evolutionin cold spray coating. Applied Surface Science 288:26–33.
Giraud D., F. Borit, V. Guipont, et al. 2012. Polymer metallization using cold spray: Application to aluminum coating of polyamide 66. In International thermal spray conference ITSC 2012, ed. R. S. Lima, 265–270. Houston: ASM.
Giraud, D., M. H. Berger, M. Jeandin, et al. 2014. TEM study of cold sprayed titanium particle bonding onto Ti–6Al–4V. Surface and Coatings Technology submitted for publication.
Goldbaum, D., J. Ajajaa, R. R. Chromik, W. Wonga, S. Yue, E. Irissou, and J. G. Legoux. 2011. Mechanical behavior of Ti cold spray coatings determined by a multi-scale indentation method. Materials Science and Engineering A 530:253–265.
Goldbaum, D., J. M. Shockley, R. R. Chromik, et al. 2012. The effect of deposition conditions on adhesion strength of Ti and Ti6Al4V cold spray splats. Journal of Thermal Spray Technology 21:288–303.
Grujicic, M., C. L. Zhao, W. S. DeRosset, et al. 2004. Adiabatic shear instability based mechanism for particles/substrate bonding in the cold gas dynamic spray process. Materials and Design 25:681–688.
Gu, S. 2013. Computational modelling to assist the development of advanced thermal spray technologies. Cold Spray Club meeting, Paris, 11 Oct 2013. http://www.mat.ensmp.fr/clubcoldspray. Accessed 4 Sept 2014.
Guetta, S., M. H. Berger, F. Borit, et al. 2009. Influence of particle velocity on adhesion of cold sprayed splats. Journal of Thermal Spray Technology 18:331–342.
Guipont, V., M. Jeandin, S. Bansard, et al. 2010. Bond strength determination of hydroxyapatite coatings on Ti–6Al–4V substrates using the laser shock adhesion test (LASAT). Journal of Biomedical Materials Research Part A 95:1096–1104.
Guo, X., G. Zhang, W. Li, Y. Gao, H. Liao, and C. Coddet. 2009. Investigation of the microstructure and tribological behavior of cold-sprayed tin-bronze-based composite coatings. Applied Surface Science 255:3822–3828.
Guo, X., J. Chen, H. Yu, H. Liao, and C. Coddet. 2014. A study on the microstructure and tribological behavior of cold-sprayed metal matrix composites reinforced by particulate quasicrystal. Surface and Coatings Technology in press.
Gupta, V. 1995. System and method for measuring the interface tensile strength of planar interfaces, US Patent 5,438, 402, 1 Aug.
Halterman, T. 2013. General electric developing cold spray 3D painting technology. http://www.3dprinterworld.com/article/general-electric-developing-cold-spray-3d-painting-technology. Accessed 4 Sept 2014.
Heimann, R. B., J. I. Kleiman, E. Litovski, S. Marx, R. Ng, S. Petrov, M. Shagalov, R. N. S. Sodhi, and A. Tang. 2014. High-pressure cold gas dynamic (CGD)-sprayed alumina-reinforced aluminum coatings for potential application as space construction material. Surface and Coatings Technology 252:113–119.
Hoell, H., and P. Richter. 2008. KINETIKS® 4000—New perspective with cold spraying. In Thermal spray 2008: thermal spray crossing borders, ed. E. Lugscheider, 479–480. Maastricht: DVS.
Hryha, E., et al. 2009. An application of universal hardness test to metal powder particles. Journal of Materials Processing Technology 209 (5): 2377–2385.
Huang, R., and H. Fukanuma. 2012. Study of the influence of particle velocity on adhesive strength of cold spray deposits. Journal of Thermal Spray Technology 21 (3–4): 541–549.
Huang, X., Z. Liu, and H. Xie. 2013. Recent progress in residual stress measurement techniques. Acta Mechanica Solida Sinica 26 (6): 570–583.
Huber, N., D. Munz, and C. Tsakmakis. 1997. Determination of Young’s modulus by spherical indentation. Journal of Materials Research 12 (9): 2459–2469.
Hussain, T. 2013. Cold spraying of titanium: A review of bonding mechanisms, microstructure and properties. Key Engineering Materials 533:53–90.
Hussain, T., D. G. McCartney, P. H. Shipway, and T. Marrocco. 2011. Corrosion behavior of cold sprayed titanium coatings and free standing deposits. Journal of Thermal Spray Technology 20 (1–2): 260–274.
Hutchings, M. T., P. J. Withers, T. M. Holden, and T. Lorentzen. 2005. Introduction to the characterization of residual stress by neutron diffraction. New York: CRC Press.
Ichikawa, Y., Y. Watanabe, I. Nonaka, et al. 2014. Micro-scale interface strength evaluation of cold sprayed deposit. In International thermal spray conference, Barcelona, 21–23 May 2014, 707–710.
Irissou, E., and B. Arsenault. 2007. Corrosion study of cold sprayed aluminum coatings onto Al 7075 alloy. In Thermal Spray 2007: Global coating solutions, eds. Basil R. Marple, Margaret M. Hyland, Yuk-Chiu Lau, Chang-Jiu Li, Rogerio S. Lima, and Ghislain Montavon, vol. 6, 549–554. Materials Park: ASM International.
Irissou, E., J. G. Legoux, B. Arsenault, and C. Moreau. 2007. Investigation of Al–Al2O3 cold spray coating formation and properties. Journal of Thermal Spray Technology 16 (5–6): 661–668.
Itoh, Y., and S. Suyama. 2007. Microstructure, thermal and electrical properties of aluminium coatings produced by cold spray. Journal of the Society of Materials Science 56 (11): 1022–1027 (in Japanese).
Jeandin, M. 2011. A Socratic approach to surface modification: the example of thermal spray. In SMT 24, 24th international conference on surface modification technologies, ed. E. Beyer, 3–20. Dresden: Valardocs.
Jeandin, M., G. Rolland, L. L. Descurninges, et al. 2014. Which powders for cold spray? Surface Engineering 30:291–298.
Jenkins, W. D., T. G. Digges, C. R. Johnson. 1957. Tensile properties of copper, nickel, and 70-percent-copper-30-percent-nickel and 30-percent-copper-70-percent-nickel alloys at high temperatures. Journal of Research of the National Bureau of Standards 58 (4). Research Paper 2753.
Jodoin, B., L. Ajdelsztajn, E. Sansoucy, A. Zúñiga, P. Richer, and E. J. Lavernia. 2006. Effect of particle size, morphology, and hardness on cold gas dynamic sprayed aluminum alloy coatings. Surface and Coatings Technology 201:3422–3429.
Jones, D. 1996. Principles and prevention of corrosion. Upper Saddle River: Prentice-Hall.
Jones, R., N. Matthews, C. A. Rodopoulos, et al. 2011. On the use of supersonic particle deposition to restore the structural integrity of damaged aircraft strcutures. International Journal of Fatigue 33:1257–1267.
Karthikeyan, J., T. Laha, A. Agarwal, and N. Munroe. 2004. Microstructural and electrochemical characterization of cold-sprayed 1100 aluminum coating. In Thermal spray 2004: Advances in technology and application. Osaka: ASM International.
Kelly, R. 2003. Crevice corrosion, corrosion fundamentals, testing, and protection, ASM handbook, vol. 13A, 242–247. Materials Park: ASM International.
Kikuchi, S., S. Yoshino, M. Yamada, M. Fukumoto, and K. Okamoto. 2013. Microstructure and thermal properties of cold sprayed Cu–Cr composite coatings. Journal of Thermal Spray Technology 22 (6): 926–931.
Kim, H. J., C. H. Lee, and S. Y. Hwang. 2005. Fabrication of WC–Co coatings by cold spray deposition. Surface and Coatings Technology 191:335–340.
Kim, B. M., C. J. Lee, and J. M. Lee. 2010. Estimation of work hardening exponents of engineered metals using residual indentation profiles of nano-indentation. Journal of Mechanical Science and Technology 24:73–76.
Kim, D. Y., J. J. Park, J. G. Lee, et al. 2013. Cold spray deposition of copper electrodes on silicon and glass substrates. Journal of Thermal Spray Technology 22:1092–1102.
Ko, K. H., J. O. Choi, and H. Lee. 2014. Pretreatment effect of Cu feedstock on cold-sprayed coatings. Journal of Materials Processing Technology 214:1530–1535.
Koivuluoto, H., and P. Vuoristo. 2009. Effect of ceramic particles on properties of cold-sprayed Ni–20Cr + Al2O3 coatings. Journal of Thermal Spray Technology 18 (4):555–562.
Koivuluoto, H., and P. Vuoristo. 2010a. Structural analysis of cold-sprayed nickel-based metallic and metallic-ceramic coatings. Journal of Thermal Spray Technology 19 (5): 975–989.
Koivuluoto, H., and P. Vuoristo. 2010b. Effect of powder type and composition on structure and mechanical properties of Cu + Al2O3 coatings prepared by using low-pressure cold spray process. Journal of Thermal Spray Technology 19 (5): 1081–1092.
Koivuluoto, H., and P. Vuoristo. 2014. Structure and corrosion properties of cold sprayed coatings: a review. Surface Engineering 30:404–414.
Koivuluoto, H., J. Lagerbom, and P. Vuoristo. 2007. Microstructural studies of cold sprayed copper, nickel, and nickel–30 % copper coatings. Journal of Thermal Spray Technology 16 (4): 488–497.
Koivuluoto, H., J. Lagerbom, M. Kylmälahti, and P. Vuoristo. 2008a. Microstructure and mechanical properties of low-pressure cold-sprayed coatings. Journal of Thermal Spray Technology 17 (5–6): 721–727.
Koivuluoto, H., M. Kulmala, and P. Vuoristo. 2008b. Structural properties of high-pressure cold-sprayed and low-pressure cold-sprayed coatings. In Surface modification technologies 22, eds. T. Sudarshan and P. Nylen, 65–72. Sweden: Trollhättan.
Koivuluoto, H., J. Näkki, and P. Vuoristo. 2009. Corrosion properties of cold-sprayed tantalum coatings. Journal of Thermal Spray Technology 18 (1): 75–82.
Koivuluoto, H., G. Bolelli, L. Lusvarghi, F. Casadei, and P. Vuoristo. 2010a. Corrosion resistance of cold-sprayed Ta coatings in very aggressive conditions. Surface Coatings and Technology 205 (4): 1103–1107.
Koivuluoto, H., M. Honkanen, and P. Vuoristo. 2010b. Cold-sprayed copper and tantalum coatings—Detailed FESEM and TEM analysis. Surface and Coatings Technology 204 (15): 2353–2361.
Koivuluoto, H., A. Coleman, K. Murray, M. Kearns, and P. Vuoristo. 2012. High pressure cold sprayed (HPCS) coatings prepared from OFHC Cu feedstock: overview from powder characteristics to coating properties. Journal of Thermal Spray Technology 21 (5): 1065–1075.
Koivuluoto, H., et al. 2013. Coating performance and durability of Zn-based composite materials prepared by using low pressure cold spraying. In Thermal Spray 2013: Proceedings of the international thermal spray conference, May 2013, 252–257. ASM International.
Koivuluoto, H., G. Bolelli, A. Milanti, L. Lusvarghi, and P. Vuoristo. 2014. Microstructural analysis of high-pressure cold-sprayed Ni, NiCu and NiCu + Al2O3 coatings. Surface and Coatings Technology, published online.
Kõo, J., and J. Valgur. 2010. Seventh International DAAAM Baltic conference “INDUSTRIAL ENGINEERING” 22–24 April 2010, Tallinn, Estonia.
Kroemmer, W., and P. Heinrich. 2006. Cold spraying—Potential and new application ideas. In Thermal spray 2006: building on 100 years of success, eds. B. Marple, M. Hyland, Y.-C. Lau, R. Lima, and J. Voyer. Seattle: ASM International.
Kuhn, H., and D. Medlin. 2004. ASM Metals handbook, mechanical testing and evaluation, vol. 8. Materials Park: ASM International.
Lee, H. Y., S. H. Jung, S. Y. Lee, Y. H. You, and K. H. Ko. 2005. Correlation between Al2O3 particles and interface of Al–Al2O3 coatings by cold spray. Applied Surface Science 252 (5): 1891–1898.
Lee, H. Y., H. Shin, S. Y. Lee, and K. H. Ko. 2008. Effect of gas pressure on Al coatings by cold gas dynamic spray. Materials Letters 62:1579.
Levasseur, D., S. Yue, and M. Brochu. 2012. Pressureless sintering of coldsprayed Inconel718 deposit. Materials Science and Engineering A 556:343–350.
Li, C. J., and G. J. Yang. 2013. Relationships between feedstock structure, particle parameter, coating deposition, microstructure and properties for thermally sprayed conventional and nanostructured WC-Co. International Journal of Refractory Metals and Hard Materials 39:2–17.
Li, W. Y., C. Zhang, X. P. Guo, G. Zhang, H. L. Liao, C. J. Li, and C. Coddet. 2007a. Deposition characteristics of Al–12Si alloy coating fabricated by cold spraying with relatively large powder particles. Applied Surface Science 253 (17): 7124–7130.
Li, W. Y., C. Zhang, X. P. Guo, G. Zhang, H. L. Liao, C. J. Li, and C. Coddet. 2007b. Study on impact fusion at particle interfaces and its effect on coating microstructure in cold spraying. Applied Surface Science 254 (2): 517–526.
Li, W. Y., C. J. Li, and G. J. Yang. 2010. Effect of impact induced melting on interface microstructure and bonding of cold sprayed zinc coating. Applied Surface Science 257:1516–1523.
Li, C.-J., H.-T. Wang, G.-J. Yang, and C.-G. Bao. 2011. Characterization of high-temperature abrasive wear of cold-sprayed FeAl intermetallic compound coating. Journal of Thermal Spray Technology 20 (1–2): 227–233.
Li, W., C. Huang, M. Yu, and H. Liao. 2013. Investigation on mechanical property of annealed copper particles and cold sprayed copper coating by a micro-indentation testing. Materials and Design 46:219–226.
Liang, Y., et al. 2011. Microstructure and nano-mechanical property of cold spray Co-base refractory alloy coating. Acta Metallurgica Sinica (English Letters) 24 (3): 190–194.
Lin, C. K., and C. C. Berndt. 1994. Measurement and analysis of adhesion strength for thermally sprayed coatings. Journal of Thermal Spray Technology 3 (1): 75–104.
Litovski, E., J. I. Kleiman, M. Shagalov, and R. B. Heimann. 2014. Measurement of the thermal conductivity of cold gas dynamically sprayed alumina-reinforced aluminium coatings between – 150 °C and + 200 °C. New test method and experimental results. Surface and Coatings Technology 242:141–145.
Liu, J., Zhou, X., Zheng, X., Cui, H., and J. Zhang. 2012. Tribological behavior of cold-sprayed nanocrystalline and conventional copper coatings. Applied Surface Science 258:7490–7496.
Luo, X.-T., C.-X. Lia, F.-L. Shangb, G.-J. Yanga, Y.-Y. Wanga, and C.-J. Lia. 2014a. High velocity impact induced microstructure evolution during deposition of cold spray coatings: A review. Surface and Coatings Technology 254:11–20.
Luo, X.-T., E.-J. Yang, F.-L. Shang, G.-J. Yang, C.-X. Li, and C.-J. Li. 2014b. Microstructure, mechanical properties, and two-body abrasive wear behavior of cold-sprayed 20 vol.% cubic BN-NiCrAl nanocomposite coating. Journal of Thermal Spray Technology, published online.
Lupoi, R., and W. O’Neill. 2011. Powder stream characteristics in cold spray nozzles. Surface and Coatings Technology 206:1069–1076.
Luzin, V., K. Spencer, and M. X. Zhang. 2011. Residual stress and thermo-mechanical properties of cold spray metal coatings. Acta Materialia 59:1259–1270.
Lynden-Bell, R. M. 1995. A simulation study of induced disorder, failure and fracture of perfect metal crystals under uniaxial tension. Journal of Physics Condensed Matter 7:4603–4624.
Ma, C., X. Liu, and C. Zhou. 2014. Cold-sprayed Al coating for corrosion protection of sintered NdFeB. Journal of Thermal Spray Technology 23 (3): 456–462.
Maev, R., and V. Leshchynsky. 2006. Air gas dynamic spraying of powder mixtures: theory and application. Journal of Thermal Spray Technology 15 (2): 198–205.
Marot, G., et al. 2006. Interfacial indentation and shear tests to determine the adhesion of thermal spray coatings. Surface and Coatings Technology 201 (5): 2080–2085.
Marrocco, T., et al. 2006. Production of titanium deposits by cold-gas dynamic spray: Numerical modeling and experimental characterization. Journal of Thermal Spray Technology 15 (2): 263–272.
Marrocco, T., T. Hussain, D. G. McCartney, and P. H. Shipway. 2011. Corrosion performance of laser posttreated cold sprayed titanium coatings. Journal of Thermal Spray Technology 20 (4): 909–917.
Marx, S., A. Paul, A. Köhler, and G. Hüttl. 2005. Cold spraying—Innovative layers for new applications. In Thermal spray 2005: Explore its surfacing potential!, 209–215. Basel: ASM International.
Masters, C. B., and N. J. Salamon. 1993. Geometrically nonlinear stress-deflection relations for thin film/substrate systems. International Journal of Engineering Science 31:915–925.
Matejicek, J., and S. Sampath. 2001. Intrinsic residual stress in single splats produced by thermal spray processes. Acta Materialia 49:1993–1999.
Mc Cune, R. C., W. T. Donlon, O. O. Popoola, et al. 2000. Characterization of copper layers produced by cold gas dynamic spraying. Journal of Thermal Spray Technology 9:73–82.
Melendez, N., Narulkar, V., Fisher, G., and A. McDonald. 2013. Effect of reinforcing particles on the wear rate of low-pressure cold-sprayed WC-based MMC coatings. Wear 306:185–195.
Meng, X., J. Zhang, J. Zhao, Y. Liang, and Y. Zhang. 2011a. Influence of gas temperature on microstructure and properties of cold spray 304SS coating. Journal of Material Science and Technology 27 (9): 809–815.
Meng, X., J. Zhang, W. Han, J. Zhao, and Y. Liang. 2011b. Influence of annealing treatment on the microstructure and mechanical properties of cold sprayed 304 stainless steel coating. Applied Surface Science 258:700–704.
Meyers, M. A. 1994. Dynamic behavior of materials. New York: Wiley.
Mittal, K. L. 1978. Adhesion measurement: Recent progress, unsolved problems, and prospects. In Adhesion measurement of thin films, thick films, and bulk coatings, STP 640, ed. K. L. Mittal, 5–17. Philadelphia: ASTM.
Moridi, A., S. M. Hassani-Gangaraj, M. Guagliano, et al. 2014a. Cold spray coating: review of material systems and future perspectives. Surface Engineering 30:369–395.
Moridi, A., S. M. H. Gangaraj, S. Vezzu, and M. Guagliano. 2014b. Number of passes and thickness effect on mechanical characteristics of cold spray coating. Procedia Engineering 74:449–459.
Morris, M. A., E. Sauvain, and D. G. Morris. 1987. Post compaction heat treatment response of dynamically compacted Inconel 718 powder. Journal of Material Science 22:1509–1516.
Nayebi, A., et al. 2001. New method to determine the mechanical properties of heat treated steels. International Journal of Mechanical Sciences 43 (11): 2679–2697.
Nayebi, A., et al. 2002. New procedure to determine steel mechanical parameters from the spherical indentation technique. Mechanics of Materials 34:243–254.
Ogawa, K., K. Ito, Y. Ichimura, Y. Ichikawa, S. Ohno, and N. Onda. 2008. Characterization of low pressure cold sprayed aluminium coatings. Journal of Thermal Spray Technology 17 (5–6): 728–735.
Oliver, W. C., and G. M. Pharr. 2004. Measurement of hardness and elastic modulus by instrumented indentation: advances in understanding and refinements to methodology. Journal of Materials Research 19:3–20.
Ortner, H. M., P. Ettmayer, and H. Kolaska. 2014. The history of the technological progress of hardmetals. International Journal of Refractory Metals and Hard Materials 44:148–159.
Papyrin, A., Kosarev, V., Klinkov, S., Alkimov, A., and V. Fomin. 2007. Cold spray technology, 1st ed., 328. Amsterdam: Elsevier (printed in the Netherlands).
Pattison, J., S. Celotto, R. Morgan, et al. 2007. Cold gas dynamic manufacturIn a non thermal approach to freeform fabrication. International Journal of Machine Tools and Manufacture 47:627–634.
Paul, H., J. H. Driver, and C. Maurice, et al. 2007. The role of shear banding on deformation texture in low stacking fault energy metals as characterized on model Ag crystals. Acta Materialia 55:575–588.
Pawloski, L. 2008. The science and engineering of thermal spray coatings, 2nd ed. Hoboken: Wiley.
Perton, M., S. Costil, W. Wong, D. Poirer, E. Irissou, J. G. Legoux, A. Blouin, and S. Yue. 2012. Effect of pulsed laser ablation on the adhesion and cohesion of cold sprayed Ti–6Al–4V coatings. Journal of Thermal Spray Technology 21 (6): 1322–1332.
Pitchuka, S., B. Boesl, C. Zhang, D. Lahiri, A. Nieto, G. Sundararajan, and A. Agarwal. 2014. Dry sliding wear behavior of cold sprayed aluminum amorphous/nanocrystalline alloy coatings. Surface and Coatings Technology 238:118–125.
Poza, P., C. J. Múnez, M. A. Garrido-Maneiro, S. Vezzù, S. Rech, and A. Trentin. 2014. Mechanical properties of Inconel 625 cold-sprayed coatings after laser remelting. Depth sensing indentation analysis. Surface and Coatings Technology 243:51–57.
Price, T. S., P. H. Shipway, and D. G. McCartney. 2006. Effect of cold spray deposition of a titanium coating on fatigue behaviour of a titanium alloy. Journal of Thermal Spray Technology 15 (4): 507–512.
Rech, S., A. Trentin, S. Vezzu, J. G. Legoux, E. Irissou, C. Moreau, and M. Guagliano. 2009. Characterization of residual stresses in Al and Al/Al2O3 cold sprayed coatings. Proceedings of ITSC 2009:1012–1017.
Rech, S., A. Trentin, S. Vezzu, J. G. Legoux, E. Irissou, and M. Guagliano. 2011. Influence of pre-heated Al 6061 substrate temperature on the residual stresses of multipass Al coatings deposited by cold spray. Journal of Thermal Spray Technology 20 (1–2): 243–251.
Rech, S., A. Trentin, S. Vezzu, E. Vedelago, J. G. Legoux, and E. Irissou. 2014. Different cold spray deposition strategies: single- and multi-layers to repair aluminium alloy components. Journal of Thermal Spray Technology. doi:10.1007/s11666-014-0141-y (in press).
Revankar, G. 2000. ASM Handbook: Mechanical testing and evaluation, hardness testing, vol. 8, 416–614. Materials Park: ASM International.
Rickerby, D. S. 1986. Journal of Vacuum Science and Technology A 4: 2809–2814.
Rickerby, D. 1996. Measurement of coating adhesion. In Metallurgical and ceramic protective coatings, ed. K. Stern, 306–333. Amsterdam: Springer.
Rickerby, D. S., and P. J. Burnett. 1988. Thin Solid Films 157: 195–223.
Rolland, G., F. Borit, V. Guipont, et al. 2008. Three dimensional analysis of cold sprayed coatings using microtomography. In International thermal spray conference, ed. E. Lugscheider, 607–610. Düsseldorf: DVS.
Rolland, G., Y. Zeralli, V. Guipont, et al. 2012. Lifetime of cold sprayed electrical contacts. In 26th international conference on electrical contacts (ICEC-ICREPEC 2012), 338–345. 14–17 May 2012, Beijing.
Rösler, J., H. Harders, and M. Bäker. 2007. Mechanical behaviour of engineered materials. New York: Springer.
Saleh, M., V. Luzin, and K. Spencer. 2014. Analysis of the residual stress and bonding mechanism in the cold spray technique using experimental and numerical methods. Surface and Coatings Technology 252:15–28.
Sansoucy, E., G. E. Kim, A. L. Moran, and B. Jodoin. 2007. Mechanical characteristics of Al–Co–Ce coatings produced by the cold spray process. Journal of Thermal Spray Technology 16 (5–6): 651–660.
Sansoucy, E., P. Marcoux, L. Ajdelsztajn, and B. Jodoin. 2008. Properties of SiC-reinforced aluminum alloy coatings produced by the cold gas dynamic spraying process. Surface and Coatings Technology 202 (16): 3988–3996.
Schajer, G. S. 2013. Practical residual stress measurement methods. Chichester: Wiley.
Schijve, J. 2001. Fatigue of structures and materials. Boston: Kluwer.
Schmidt, T., T. Gartner, H. Assadi, and H. Kreye. 2006a. Development of a generalized parameter window for cold spray deposition. Acta Materialia 54:729–742.
Schmidt, T., T. Gartner, and H. Kreye. 2006b. New developments in cold spray based on higher gas and particle temperatures. Journal of Thermal Spray Technology 15 (4): 488–494.
Schmidt, T., H. Assadi, F. Gartner, et al. 2009. From particle acceleration to impact and bonding in cold spraying. Journal of Thermal Spray Technology 18:794–808.
Schweitzer, P. A., ed. 1996. Corrosion engineering handbook. New York: Marcel Dekker.
Seo, D., K. Ogawa, K. Sakaguchi, N. Miyamoto, and Y. Tsuzuki. 2012a. Parameter study influencing thermal conductivity of annealed pure copper coatings deposited by selective cold spray process. Surface and Coating Techonology 206:2316–2324.
Seo, D., K. Ogawa, K. Sakaguchi, N. Miyamoto, and Y. Tsuzuki. 2012b. Influence of crystallite size and lattice spacing on thermal conduction of polycrystalline copper deposited by solid particle impingment: contribution of electron and phonon conduction. Surface and Coatings Technology 207:233–239.
Seo, D., M. Sayar, and K. Ogawa. 2012c. SiO2 and MoSi2 formation on Inconel 625 surface via SiC coating deposited by cold spray. Surface and Coatings Technology 206 (11–12): 2851–2858.
Sevillano, F., P. Poza, C. J. Múnez, S. Vezzù, S. Rech, and A. Trentin. 2013. Cold-sprayed Ni–Al2O3 coatings for applications in power generation industry. Journal of Thermal Spray Technology 22:772–782.
Shabel, B., and R. Young. 1987. A new procedure for the rapid determination of yield and tensile strength from hardness tests. In Nondestructive characterization of materials II, eds. J. Bussière, et al., 335–343. Boston: Springer.
Shayegan, G., H. Mahmoudi, R. Ghelichi, J. Villafuerte, J. Wang, M. Guagliano, and H. Jahed. 2014. Residual stress induced by cold spray coating of magnesium AZ31B extrusion. Materials and Design 60:72–84.
Shockley, J., H. Strauss, R. Chromik, N. Brodusch, R. Gauvin, E. Irissou, and J.-G. Legoux. 2013. In situ tribometry of cold-sprayed Al–Al2O3 composite coatings. Surface and Coatings Technology 215:350–356.
Shockley, J., S. Descartes, E. Irissou, J.-G. Legoux, and R. Chromik. 2014. Third body behavior during dry sliding of cold-sprayed Al–Al2O3 composites: In situ tribometry and microanalysis. Tribology Letters 54:191–206.
Shorey, A. B., et al. 2001. Nanoindentation hardness of particles used in magnetorheological finishing (MRF). 0003–6935 (Print).
Smurov, I., V. Ulianitsky, S. Zlobin, and A. Sova. 2010. Comparison of cold spray and detonation coatings properties. Proceedings of Thermal Spray: Global Solutions for Future Application, Singapore, May 2010.
Sova, A., S. Grigoriev, A. Okunkova, et al. 2013a. Potential of cold gas dynamic spray as additive manufacturing technology. International Journal of Advanced Manufacturing Technology 69:2269–2278.
Sova, A., et al. 2013b. Cold spray deposition of 316 L stainless steel coatings on aluminium surface with following laser post-treatment. Surface and Coatings Technology 235:283–289.
Spencer, K., and Zhang, M.-X. 2011. Optimisation of stainless steel cold spray coatings using mixed particle size distributions. Surface and Coatings Technology 205:5153–5140.
Spencer, K., D. M. Fabijanic, and M.-X. Zhang. 2009. The use of Al–Al2O3 cold spray coatings to improve the surface properties of magnesium alloys. Surface and Coatings Technology 204:336–344.
Spencer, K., D. M. Fabijanic, and M. X. Zhang. 2012a. The influence of Al2O3 reinforcement on the properties of stainless steel cold spray coatings. Surface and Coatings Technology 206 (14): 3275–3282.
Spencer, K., V. Luzin, N. Matthews, and M. X. Zhang. 2012b. Residual stresses in cold spray Al coatings: the effect of alloying and of process parameters. Surface and Coatings Technology 206:4249–4255.
Stark, L., I. Smid, A. Segall, T. Eden, and J. Potter. 2012. Self-lubricating cold-sprayed coatings utilizing microscale nickel-encapsulated hexagonal boron nitride. Tribology Transactions 55:624–630.
Stoltenhoff, T., and F. Zimmermann. 2009. Cold spray coatings for aluminum aerospace components exposed to high dynamic stresses. Proceedings of 8th HVOF Kolloquim Erding 5–6 November 2009, 135–143.
Stoltenhoff, T., H. Kreye, and H. J. Richter. 2001. An analysis of the cold spray process and its coatings. Journal of Thermal Spray Technology 11:542–550.
Stoltenhoff, T., C. Borchers, F. Gärtner, and H. Kreye. 2006. Microstructures and key properties of cold-sprayed and thermally sprayed copper coatings. Surface and Coatings Technology 200 (16–17): 4947–4960.
Stoney, G. 1909. Proceedings of Royal Society of London.
Sudharshan, P.P., V. Vishnukanthan, and G. Sundararajan. 2007. Effect of heat treatment on properties of cold sprayed nanocrystalline copper alumina coatings. Acta Materialia 55:4741–4751.
Suhonen, T., A. Varis, S. Dosta, M. Torrell, and J. M. Guilemany. 2013. Residual stress development in cold sprayed Al, Cu and Ti coatings. Acta Materialia 61:6329–6337.
Sun, J., Y. Han, and K. Cui. 2008. Innovative fabrication of porous titanium coating on titanium by cold spraying and vacuum sintering. Materials Letters 62:3623–3625.
Sundararajan, G., P.P. Sudharshan, A. Jyothirmayi, A. Ravi, and C. Gundakaram. 2009. The influence of heat treatment on the microstructural, mechanical and corrosion behaviour of cold sprayed SS 316 L coatings. Journal of Materials Science 44 (9): 2320–2326.
Suo, X. K., M. Yu, W. Y. Li, M. P. Planche, and H. L. Liao. 2012. Effect of substrate preheating on bonding strength of cold-sprayed Mg coatings. Journal of Thermal Spray Technology 21 (5): 1091–1098.
Tabor, D. 1951. The hardness of metals. Oxford: Clarendon Press.
Talbot, D. and J. Talbot. 1998. Corrosion science and technology. Boca Raton: CRC Press LLC.
Taljat, B., T. Zacharia, and F. Kosel. 1998. New analytical procedure to determine stress-strain curve from spherical indentation data. International Journal of Solids and Structures 35 (33): 4411–4426.
Tao, Y., et al. 2009. Effect of α-Al2O3 on the properties of cold sprayed Al/α-Al2O3 composite coatings on AZ91D magnesium alloy. Applied Surface Science 256 (1): 261–266.
Tao, Y., T. Xiong, C. Sun, L. Kong, X. Cui, T. Li, and G.-L. Song. 2010. Microstructure and corrosion performance of a cold sprayed aluminium coating on AZ91D magnesium alloy. Corrosion Science 52:3191–3197.
Taylor, K., B. Jodoin, and J. Karov. 2006. Particle loading effect in cold spray. Journal of Thermal Spray Technology 15 (2): 273–279.
Tjong, S. C., and H. Chen. 2004. Nanocrystalline materials and coatings. Materials Science and Engineering R 45:1–88.
Tran-Cong, S., M. Gay, and E. E. Michaelides. 2004. Drag coefficients of irregularly shaped particles. Powder Technology 139:21–32.
Tsui, Y. C., and T. W. Clyne. 1997. An analytical model for predicting residual stresses in progressively deposited coatings Part1: Planar geometry. Thin Solid Films 306:23–33.
Valente, T., C. Bartuli, M. Sebastiani, and A. Loreto. 2005. Implementation and development of the incremental hole drilling method for the measurement of residual stress in thermal spray coatings. Journal of Thermal Spray Technology 14 (4): 462–470.
Van Steenkiste, T. H., J. R. Smith, and R. E. Teets. 2002. Aluminum coatings via kinetic spray with relatively large powder particles. Surface and Coatings Technology 154:237–252.
Venkatesh, L., N. M. Chavan, and G. Sundararajan. 2011. The influence of powder particle velocity and microstructure on the properties of cold sprayed copper coatings. Journal of Thermal Spray Technology 20 (5): 1009–1021.
Vezzu, S., S. Rech, E. Vedelago, G. P. Zanon, G. Alfeo, A. Scialpi, and R. Huang. 2014. On deposition of Waspaloy coatings by cold spray. Surface Engineering 30:342–351.
Vijgen, R. O. E., and J. H. Dautzenberg. 1995. Mechanical measurement of the residual stress in thin PVD films. Thin Solid Films 270:264–269.
Villa, M., S. Dosta, and J. M. Guilemany. 2013. Optimization of 316 L stainless steel coatings on light alloys using cold gas spray. Surface and Coatings Technology 235:220–225.
Villafuerte, J., D. Dzhurinskiy, R. Ramirez, E. Maeva, V. Leshchynsky, and R. Maev. 2009. Corrosion behavior and microstructure of the Al–Al2O3 coatings produced by low pressure cold spraying. In Thermal spray 2009: expanding thermal spray performance to new markets and applications, eds. B. Marple, M. Hyland, Y.-C. Lau, C.-J. Li, R. Lima, and G. Montavon, 908–913. Las Vegas: ASM International.
Vreijling, M. 1998. Electrochemical characterization of metallic thermally sprayed coatings, printed in the Netherlands, 143.
Wang, A. P., T. Zhang, and J. Q. Wang. 2006. Ni-based fully amorphous metallic coating with high corrosion resistance. Philosophical Magazine Letters 86 (1): 5–11.
Wang, H.-R., B.-R. Hou, J. Wang, W.-Y. Li. 2008. Effect of process conditions on microstructure and corrosion resistance of cold-sprayed Ti coatings. Journal of Thermal Spray Technology 17 (5–6): 736–741.
Wang, Q., et al. 2010a. The influence of ceramic particles on bond strength of cold spray composite coatings on AZ91 alloy substrate. Surface and Coatings Technology 205 (1): 50–56.
Wang, T. G., S. S. Zhao, W. G. Hua, J. B. Li, J. Gong, and C. Sun. 2010b. Estimation of residual stress and its effects on the mechanical properties of detonation gun sprayed WC-Co coatings. Material Science and Engineering A 527:454–461.
Wang, Q., et al. 2013. Microstructure characterization and nanomechanics of cold-sprayed pure Al and Al–Al2O3 composite coatings. Surface and Coatings Technology 232:216–223.
Withers, P. J., and H. K. D. H. Bhadeshia. 2001. Materials Science and Technology 17:355–365.
Wolfe, D. E., T. J. Eden, J. K. Potter, and A. P. Jaroh. 2006. Investigation and characterization of Cr3C2-based wear-resistant coatings applied by the cold spray process. Journal of Thermal Spray Technology 15 (3): 400–412.
Wong, W, A. Rezaeian, E. Irissou, J. G. Legoux, and S. Yue. 2010. Cold spray characteristics of commercially pure Ti and Ti–6Al–4V. Advanced Materials Research 89–91:639–644.
Wong, W., P. Vo, E. Irissou, A. N. Ryabinin, J. G. Legoux, and S. Yue. 2013. Effect of particle morphology and size distribution on cold-sprayed pure titanium coatings. Journal of Thermal Spray Technology 22 (7): 1140–1153.
Wu, J., J. Yang, H. Fang, S. Yoon, and C. Lee. 2006. The bond strength of Al–Si coating on mild steel by kinetic spraying deposition. Applied Surface Science 252 (22): 7809–7814.
Xie, J., D. Nelias, H. Walter-Le Berre, et al. 2013. Numerical modeling for cold sprayed particle deposition. In 40th Leeds-Lyon symposium on tribology & tribochemistry forum, 4–6 Sept 2013, Lyon.
Xiong, Y., and M. X. Zhang. 2014. The effect of cold sprayed coatings on the mechanical properties of AZ91D magnesium alloy. Surface and Coatings Technology 253:89–95.
Xiong, T., Y. Tao, C. Sun, H. Jin, H. Du, and T. Li. 2009. Study on corrosion behavior of cold sprayed Al/α–Al2O3 deposit on AZ91D alloy. In Thermal spray 2009: expanding thermal spray performance to new markets and applications, eds. B. Marple, M. Hyland, Y.-C. Lau, C.-J. Li, R. Lima, and G. Montavon, 669–672. Las Vegas: ASM International.
Xiong, Y., X. Xiong, S. Yoon, et al. 2011. Dependence of bonding mechanisms of cold sprayed coatings on strain rate induced non equilibrium phase transformation. Journal of Thermal Spray Technology 20:860–865.
Yamada, M., Y. Kandori, S. Kazumori, et al. 2009. Fabrication of titanium dioxide photocatalyst coatings by cold spray. Journal of Solid Mechanics and Materials Engineering 3:210–216.
Yan, W., C. Lun Pun, and G. P. Simon. 2012. Conditions of applying Oliver–Pharr method to the nanoindentation of particles in composites. Composites Science and Technology 72:1147–1152.
Yandouzi, M., P. Richer, and B. Jodoin. 2009. SiC particulate reinforced Al–12Si alloy composite coatings produced by the pulsed gas dynamic spray process: microstructure and properties. Surface and Coatings Technology 203 (20–21): 3260–3270.
Yang, G. J., H. T. Wang, C. J. Li, and C. X. Li. 2011. Effect of annealing on the microstructure and erosion performance of cold-sprayed FeAl intermetallic coatings. Surface and Coatings Technology 205 (23–24): 5502–5509.
Yin, S., P. He, H. Lia, et al. 2014. Deposition features of Ti coating using irregular powders in cold spray. Journal of Thermal Spray Technology 23:984–990.
Zeralli, Y., G. Rolland, M. Jeandin, et al. 2014. Novel in-situ gradient heat treatment during cold spray. In International thermal spray conference, Barcelona, 21–23 May 2014, 923–928.
Zhou, X., and P. Mohanty. 2012. Electrochemical behavior of cold sprayed hydroxyapatite/titanium composite in Hanks solution. Electrochimica Acta 65:134–140.
Ziemann, C. W., M. M. Sharma, B. D. Bouffard, T. Nissley, and T. J. Eden. 2014. Effect of substrate roughnening and cold spray coating on the fatigue life of AA2024 specimens. Materials and Design 54:212–221.
Zou, Y., W. Qin, E. Irissou, et al. 2009. Dynamic recrystallization in the particle/particle interfacial region of cold sprayed nickel coating: electron backscatter diffraction characterization. Scripta Materialia 61:899–902.
Zou, Y., et al. 2010. Microstructure and nanohardness of cold-sprayed coatings: electron backscattered diffraction and nanoindentation studies. Scripta Materialia 62 (6): 395–398.
Acknowledgement
Chapter authors would like to thank Mrs Odile Adam from MINES ParisTech for efficient help in the achievement of the list of references, all the Ph.D students and research scientists who worked at MINES ParisTech/C2P in the field of cold spay for relevant research results, Prof Yuji Ichikawa for helpful discussion and providing with pictures, Enrico Vedelago and Silvano Rech from Veneto Nanotech for their kind support and Prof Mario Guagliano from Politecnicodi Milano for helpful discussion.
Author information
Authors and Affiliations
Corresponding author
Editor information
Editors and Affiliations
Rights and permissions
Copyright information
© 2015 Springer International Publishing Switzerland
About this chapter
Cite this chapter
Jeandin, M., Koivuluoto, H., Vezzu, S. (2015). Coating Properties. In: Villafuerte, J. (eds) Modern Cold Spray. Springer, Cham. https://doi.org/10.1007/978-3-319-16772-5_4
Download citation
DOI: https://doi.org/10.1007/978-3-319-16772-5_4
Published:
Publisher Name: Springer, Cham
Print ISBN: 978-3-319-16771-8
Online ISBN: 978-3-319-16772-5
eBook Packages: Chemistry and Materials ScienceChemistry and Material Science (R0)