
Abstract
The chapter author worked with Manfred R. Schroeder for about 25 years at Bell Telephone Laboratories starting in May 1961. Manfred always inspired this author to look for things one has never seen before. Digital computers were emerging in the 1960s with great promise and we used computers to do many new things: simulation of acoustics of concert halls, studying sound decay in rooms using ray tracing, and producing high-quality speech at low bit rates. This chapter will highlight a few examples. Manfred had been deep in the area of vocoder research at that time, but we started on a new track leading us ultimately to code-excited linear prediction. This set the spark for expanding the use of cell phones worldwide. As a manager, Manfred Schroeder was uncompromising in pushing for scientific excellence resulting in success; Bell Labs had the reputation of being the best.
Access provided by Autonomous University of Puebla. Download chapter PDF
Keywords
These keywords were added by machine and not by the authors. This process is experimental and the keywords may be updated as the learning algorithm improves.
1 Introduction
I worked with Manfred Schroeder for about 25 years at Bell Telephone Laboratories starting in May 1961. Manfred always inspired me to look for things one has never seen before. Digital computers were emerging in the 1960s with great promise and we used computers to do many new things: simulation of acoustics of concert halls, studying sound decay in rooms using ray tracing, and producing high-quality speech at low bit rates. This chapter will highlight a few examples. Manfred had been deep in the area of vocoder research at that time, but we started on a new track leading us ultimately to code-excited linear prediction (CELP). This set the spark for expanding the use of cell phones worldwide. As a manager, Manfred Schroeder was uncompromising in pushing for scientific excellence resulting in success; Bell Labs had the reputation of being the best.
2 Computer Simulation of Acoustics of Concert Halls
In early 1960s, digital computers were primarily used for solving numerical problems. However, it was becoming increasingly obvious that computer simulation was a powerful tool for understanding complicated processes. Manfred Schroeder was a pioneer in using such tools. In one of the early applications of computer simulation, a digital computer (IBM 7099) was programmed to “simulate” sound transmission in rooms [1]. The idea was that one could evaluate the “acoustics” of a new concert hall even before the hall was built. The digital simulation could help to “preaudit” architectural designs before construction and to investigate subjective correlates of a wide variety of reverberation processes. If a design was found to be unsatisfactory, as a result of subjective evaluations of the simulation, modifications could be made in the architectural plans.
Thus, one could start with reverberation-free signals and program a digital computer to add echoes and reverberation with specified delays, spectral content, and decay characteristics. Several output signals could be generated on the computer; these signals when radiated from loudspeakers in an anechoic chamber could produce sound pressure waves at listener’s ears resembling those in real halls. Since we have only two ears to listen with, it should be possible to accomplish the result by radiating from only two loudspeakers. If done properly, the acoustical cross-talk between two loudspeakers at the two ears can be eliminated.
Figure 10.1 illustrates the sequence of pulses to be emitted from the two loudspeakers to achieve the desired response from a source S on the right. The details of these operations are contained in [1]. Sound arrivals from about ten different directions were created on the computer and reproduced in the anechoic chamber at Bell Laboratories by means of two loudspeakers located several meters in front of the listener. Although the computations were based on an essentially fixed head position, the experiments showed that head movements up to ±10° did not affect the percept; “externalization” (perceiving the sound as originating outside one’s head) was perfect. In fact, the synthesis of lateral arrival, including arrivals from ±90° was so perfect that listeners often turned their heads to see the nonexistent sound source.

Creation of virtual sound image at an arbitrary lateral direction by means of two loudspeakers in front of the listener. The signals x 1(t), x 2(t) from the two loudspeakers combine at the listener’s ears to resemble those from a real lateral sound source S
3 Study of Sound Decay in Rooms Using Ray Tracing on Computers
Shortcomings of classical reverberation time formulas, named after Sabine, Eyring, and Millington, to predict reverberation time correctly or to calculate absorption coefficients accurately have been known for a long time. Occasionally, one obtained absorption coefficients greater than 1, a physically impossible result! Such problems were often ascribed to “lack of diffusion” in the reverberation chambers. Manfred and I felt that the basic assumptions that go into these formulas were incorrect.
Another argument raised by many people then was that the existing reverberation theories were based on ray approximation. Since, sound does not travel like rays, no wonder, theory and experimental results do not agree. It turned out that the existing reverberation theories were not correct even under the ray approximation [2, 3].
In order to develop an accurate theory of reverberation based on ray acoustics, I computed sound decays in two-dimensional “rooms” of different shapes and sizes by simulating the propagation of rays on a digital computer. The method of ray tracing on a digital computer is shown in the Fig. 10.2. It shows a two-dimensional enclosure with a patch of absorbing material on one of its walls and an omnidirectional sound source emitting 300 equal-energy rays spaced 1.2° apart (although any other directional characteristic could have been used). The computer program tracked the path of each of the 300 rays following the laws of geometrical acoustics and the energy of each of these rays as they traveled in the room. Each time a ray hit the wall, its energy was diminished by a factor (1 − α), where α is the absorption coefficient. The computer program could follow a ray over any desired length of time. The total sound energy after the introduction of a short pulse of sound in the enclosure was obtained by adding the energies of all the component rays.

The computer calculates the path of 300 rays from an omnidirectional source. Every time a ray hits an absorbing material, its energy is reduced depending on the absorption coefficient of the material. The computer keeps a running account of the remaining energy
An example of the sound decay in a two-dimensional non-rectangular enclosure with one of the walls covered with an absorbing material with α = 0.8 is shown in Fig. 10.3. The figure shows a comparison between the decay obtained on the computer (reverberation time T = 0.38 s) and the decays predicted by the two-dimensional forms of the Sabine (T = 0.63 s), Eyring (T = 0.56 s), and Millington formulas (T = 0.31 s), respectively. The reverberation time predicted by the Sabine formula is 65 % too large. The Millington value is 17 % too small. The Eyring formula provides an intermediate value with an error of +45 %.

Comparison of sound decay curves found by computer ray-tracing with decay rates predicted by the Sabine, Eyring, and Millington formulas
I made a modest beginning in developing a new theory of sound decay in rooms. I will give here a brief outline of steps that provide a more accurate representation of how sound decays in rooms. For simplicity, the case of absorbing material on a single wall is considered. The theory can easily be generalized to case when the absorbing material is spread over more than one wall. Let ε(α, t) represent the total sound energy in the room at a time t sec after the sound source is stopped. It is easily seen that ε(α, t) is written as
where P(k, t) is the probability of a ray hitting the sound absorber k times in t sec. The logarithmic decay ln ε(α, t) can be expressed in terms of cumulants q n (t) of the probability distribution P(k, t). Thus,
where \( \overline{n}(t)={\displaystyle {\sum}_{n=0}^{\mathit{\infty}} nP\left( n, t\right)} \). All of the classical reverberation time formulas can be derived from Eq. (10.2) by substituting the cumulants appropriate to the probability distribution implicit in the formulas. For example, Sabine’s formula is obtained by setting all the cumulants equal to \( \overline{n}(t) \). The above equations can be easily generalized when more walls are covered with absorbing material. The probability distribution and cumulants are replaced by the joint distribution and joint cumulants.
Further analysis of Sabine and Eyring formulas has revealed that the underlying probability distributions implicit in these formulas are based on the assumption that the probability that a ray hits a given wall is independent of the wall the ray came from. This cannot be correct, since a ray cannot hit the same wall twice in succession. The probability of hitting a wall at any reflection depends upon the entire past history of the ray. One can thus regard the Eyring formula as equivalent to a zero-order Markov process. A natural way of improving the Eyring formula will be to consider the effect of taking the first-order Markov dependence into account in developing the theory.
3.1 Reverberation Theory Based on First-Order Markov Dependence
Here is a brief description of the new theory. Consider a room with K walls. Let α i be the absorption coefficient of the absorbing material on wall i. Let p ij be the probability that a ray starting from the wall i hits the wall j at the next reflection. It is reasonably straightforward to compute these probabilities from the geometry of the room. Consider now a matrix P with its term in the row i and column j given by p ij and a diagonal matrix A with its i-th diagonal term given by 1 − α i . Then, each element of the matrix PA is nonnegative and the matrix PA has an eigenvalue λ 1(α 1, …, α K ) which is greater than the absolute value of every other eigenvalue of the matrix PA [4]. The reverberation time is given by
where \( \overline{n} \) is the mean collision frequency of the rays. Equation (10.3) reduces to Eyring formula if p ij is independent of i (Fig. 10.4).

(a) Comparison of reverberation times, obtained by computer ray-tracing (abscissa), with reverberation times computed by Eyring formula for 36 different shapes (ordinate) and (b) comparison of reverberation times, obtained by computer ray-tracing, with reverberation times computed using the new theory based on first-order Markov dependence for the same 36 shapes used in (a)
4 Early Predictive Coding Research
The research in speech coding (or speech bandwidth compression) originated about 75 years ago. At that time, the demand for telephones was growing rapidly. Telephone service was available coast-to-coast, with close to ten million telephones in service. The first under-the-ocean transatlantic telephone cable was still years away. Western Electric asked its research engineers at Bell Telephone Laboratories if voice signals could be transmitted over existing telegraph cables.
The bandwidth required for voice transmission is approximately 3,000 Hz, but the transatlantic telegraph cables had a bandwidth of only a few hundred Hz. Homer Dudley, who had joined Western Electric (parent of Bell Laboratories) in 1921, argued that the real information in speech was carried by telegraph-like low-frequency modulation signals corresponding to slow motion of the vocal organs. Dudley implemented his ideas in a device named “Vocoder,” but the signal processing technology available then was primitive and it was very difficult to realize the full potential of his ideas. Although vocoders did not produce speech of quality good enough for telephone application, they were used during World War II by President Roosevelt and Prime Minister Churchill for secure voice communication. Vocoders remained the central theme of speech coding research for about 35 years.
During the time speech scientists were occupied with vocoders, several major developments of fundamental importance were taking place outside speech research. A major contribution to the mathematical theory of communication of signals was made by Claude Shanon, represented in his published work in 1948 [5]. Shanon’s work established a mathematical framework for coding and transmission of signals. In the 1940s, Norbert Wiener developed a mathematical theory for calculating the best filters and predictors for detecting signals hidden in noise.
Wiener worked during the Second World War on the problem of aiming anti-aircraft guns to shoot down an airplane. Since the plane moves, one must predict its position at the time the shell will reach the plane. Wiener’s work appeared in his famous monograph [6], “Extrapolation, Interpolation and Smoothing of Time Series,” published in 1949.
Linear Prediction is now a major tool in signal processing. Another development was Pulse Code Modulation (PCM), a method for sampling a continuous signal and quantizing each sample into binary digits. It enabled coding of speech with telephone bandwidth at a bit rate of 64 kb/s with negligible loss of quality. PCM marked the beginning of the digital age.
Following the work of Shanon and Wiener, Peter Elias published two papers in 1955 [7] on predictive coding. In predictive coding, both the transmitter and the receiver store the past values of the transmitted signal and from them predict the current value of the signal. The transmitter transmits, not the signal, but the prediction error, that is the quantized difference between the signal and its predicted value. At the receiver, this transmitted prediction error is added to the predicted value to reproduce the signal. For efficient coding, the successive terms of the prediction error should be uncorrelated and the entropy of its distribution should be as small as possible. In predictive coding, the transmitted prediction error is made as white as possible (Fig. 10.5) to achieve coding efficiency. Predictive coding is a remarkably simple concept.

Spectrum of the speech signal (first waveform), the spectrum of the prediction error after prediction with a linear predictor of order 16 (second waveform), and the spectrum of the prediction error after prediction with a linear predictor of order 128 (third waveform). The speech signal was sampled at 8 kHz. The 128th-order linear predictor was able to remove most of the pitch-related fine structure of the signal
In 1965, as part of my Ph.D. course work at the Polytechnic Institute of Brooklyn, New York, I had to review two papers of my choice and present the material in the class. One of them was Peter Elias’s paper on predictive coding, published in 1955. Just a few months later, in 1966, I was one day in Manfred Schroeder’s office at Bell Labs when John Pierce brought a tape showing a new speech time compression system. Schroeder was not impressed. After listening to the tape, he said that there had to be a better way of compressing speech and mentioned the work in image coding by Chape Cutler at Bell Labs based on differential pulse code modulation (DPCM) technique, which was a simplified version of predictive coding. Our discussions that afternoon kept me thinking. Schroeder’s remarks at our meeting made a deep impression. Waiting at the subway station for a train to Brooklyn, I convinced myself that I should do some exploratory investigation to determine if predictive coding could work for speech signals. A first step was to find out if the first-order entropy of the distribution of prediction error signal is significantly smaller than the corresponding entropy of the speech signal; indeed, smaller entropy of the prediction error could produce a lower bit rate. The results were encouraging. For speech sampled at 6.67 kHz, the first-order entropy of prediction error turned out to be 1.3 bits/sample as compared to 3.3 bits/sample for the speech signal.
Of course, for a signal that changes rapidly from one speech sound to the next the prediction has to be adaptive; hence the name adaptive predictive coding (APC). We demonstrated the first APC system and its speech quality at the IEEE International Conference on Speech Communication held in Boston in 1967 [8], using two-level encoding of the prediction error. The predictive coder produced natural-sounding speech and speech quality was good [9], except for the presence of a low-level crackling noise that could be heard with careful listening over headphones.
5 Exploiting Masking for Noise Reduction in Speech Coders
Digital coders invariably introduce errors in the coded speech signal. Our next advance came in 1978 when we started to introduce perceptual error criteria. In other words, instead of minimizing a mathematical root-mean-square error, we minimized the subjective loudness of the quantizing noise as perceived by the human ear in the presence of the speech signal [10, 11]. This required measurements of loudness and masking was performed in collaboration with J. L. Hall [10], to educate us as to the precise causes of audible distortion in a speech signal coded at low bit rates. Our new directions were recognized by IEEE with an award in 1980 (Fig. 10.6). The importance of adjusting the spectrum of the error so as to minimize the subjective distortion is now well established.

Manfred and I were working hard to reduce noise in speech coders to compress speech at low bit rates
6 Developments in Speech Coders Leading to CELP
The optimum noise spectrum for minimum subjective distortion is in general non-flat. Early predictive coders designed for minimum subjective distortion used instantaneous quantizers; but instantaneous quantizers are suboptimal. We therefore decided to investigate non-instantaneous quantizing. Ideally in speech coding, one is interested in finding a sequence of binary digits which after decoding produces speech with minimal audible distortion. We therefore considered the use of block codes using tree search procedures to determine the optimal code. We first employed a binary tree search procedure for coding the excitation at 1 bit/sample which produced speech of high quality.
The use of block codes is necessary when only a fraction of a bit is available for coding each sample of the excitation. Very low bit rates for the excitation are necessary to bring the total bit rate for coding the speech signal down to 8 kb/s or even lower. In code-book coding, a set of possible sequences (may be random) is stored in a code book. For a given speech segment, the optimum sequence is selected by exhaustive search of the code book and an index specifying the optimum sequence is transmitted to the receiver. Code-book coding is often impractical due to the large size of code books. At very low bit rates, however, exhaustive search of the code book became practical, when the processing speed of digital processing chips was increasing three times every 2 years. The search procedure was still computationally very expensive; it took 125 s of Cray-1 CPU time to process 1 s of the speech signal. Here is a summary of various coding methods that we investigated before converging to code-excited linear prediction (CELP) (Fig. 10.7) [12].
-
[1978] Subjective error criteria
-
[1979] Exploiting masking properties of human ear
-
[1981] Tree coding based on rate distortion theory
-
[1982] Tree coding using block codes
-
[1982] Multipulse LPC
-
[1983] Stochastic coding of speech
-
[1984] Code-excited linear prediction
Fig. 10.7 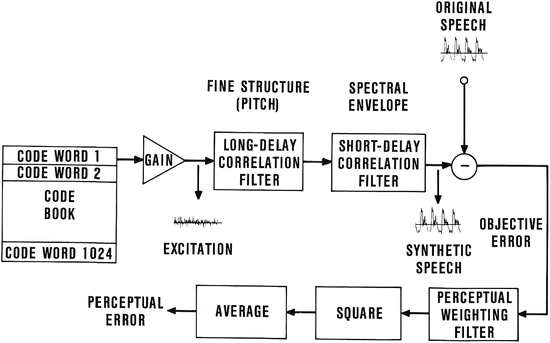
Illustration of the search procedure in a code-excited linear prediction (CELP) coder

7 Conclusion
The entrance hall of the Bell Telephone Laboratories building at Murray Hill, New Jersey had an inscription attributed to Alexander Graham Bell that said “Leave the beaten track and dive into the woods. You will be certain to find something that you have never seen before.” Working with Manfred was always looking for something new. Research was great fun. I presented a few examples in this chapter, but Manfred played around with many more exciting things. I hope that the other chapters will share some of this excitement (Fig. 10.8).

Corrections from Manfred on the first manuscript of the code-excited linear prediction (CELP) coder
References
Schroeder, M. R., Atal, B. S., Bird, C.: Digital computers in room acoustics. In: Proc. Fourth Intern. Congr. Acoust, Copenhagen (Aug 1962)
Atal, B.S., Schroeder, M.R.: Study of sound decay using ray-tracing techniques. J. Acoust. Soc. Am. 41, 1598 (1967)
Schroeder, M.R.: Digital simulation of sound transmission in reverberant spaces. J. Acoust. Soc. Am. 47, 424 (1970)
Braner, A.: On the characteristics roots of non-negative matrices. In: Schnieder, H. (ed.) Recent Advances in Matrix Theory, pp. 3–38. University of Wisconsin Press, Madison (1964)
Shanon, C.E.: A mathematical theory of communication. Bell Syst. Tech. J. 27(379–423), 623–656 (1948)
Wiener, N.: Extrapolation, Interpolation, and Smoothing of Stationary Time Series. The MIT Press, Cambridge, MA (1949)
Elias, P.: Predictive coding - I II. In: IRE Trans. Inform. Theory, IT-1, pp. 16–33 (Mar 1955)
Atal, B. S., Schroeder, M. R.: Predictive coding of speech signals. In: Proc. 1967 Conf. on Communication and Proc., pp. 360–361 (Nov 1967)
Atal, B.S., Schroeder, M.R.: Adaptive predictive coding of speech signals. Bell Syst. Tech. Jour. 49, 1973–1986 (1970)
Schroeder, M.R., Atal, B.S., Hall, J.L.: Optimizing digital speech coders by exploiting masking properties of the human ear. J. Acoust. Soc. Am. 66, 1647–1652 (Dec 1979)
Atal, B. S., Schroeder, M. R.: Predictive coding of speech signals and subjective error criteria. In: IEEE Trans. Acoust., Speech, Signal Proc., ASSP-27, pp. 247–254 (Jun 1979)
Schroeder, M. R., Atal, B. S.: Code-excited linear prediction (CELP): high-quality speech at very low bit rates.’ In: Proc. Int. Conf. on Acoust., Speech and Signal Proc., vol. 10, paper no 25.1, pp. 937–940 (Apr 1985)
Author information
Authors and Affiliations
Corresponding author
Editor information
Editors and Affiliations
Rights and permissions
Copyright information
© 2015 Springer International Publishing Switzerland
About this chapter
Cite this chapter
Atal, B.S. (2015). Manfred R. Schroeder: Challenge the Present and There Is a Better Way. In: Xiang, N., Sessler, G. (eds) Acoustics, Information, and Communication. Modern Acoustics and Signal Processing. Springer, Cham. https://doi.org/10.1007/978-3-319-05660-9_10
Download citation
DOI: https://doi.org/10.1007/978-3-319-05660-9_10
Published:
Publisher Name: Springer, Cham
Print ISBN: 978-3-319-05659-3
Online ISBN: 978-3-319-05660-9
eBook Packages: Physics and AstronomyPhysics and Astronomy (R0)