
Abstract
The refurbishment of building opaque envelope represents an important approach for the reduction in global European energy consumption as prescribed by the Directive 2010/31/EU. Therefore, the knowledge of existing housing stock and their hygrothermal behaviour is necessary to define effective energy conservation measures. In this chapter, starting from the definition of the main thermal and hygrometrical parameters, a systematic analysis of the most common wall typologies in European construction is carried out for the definition of a structure catalogue. Moreover, for a set of envelope insulation interventions, the hygrothermal behaviour is evaluated and some diagrams for the assessment of the optimal intervention are defined. Finally, the incidence in terms of energy performance is tested considering a case study.
Access provided by Autonomous University of Puebla. Download chapter PDF
Keywords
These keywords were added by machine and not by the authors. This process is experimental and the keywords may be updated as the learning algorithm improves.
1 Introduction
The energy-saving target, in the refurbishment of existing buildings, requires considerable efforts on the choice of appropriate solutions that must be energy-efficient and feasible from a technical and economical point of view. Actions on the building envelope are not always possible, and in any case, they must be evaluated with care: higher thermal insulation can be achieved, for example, causing worse hygrometrical behaviour of the walls. Moreover, under certain conditions, it may be convenient to consider jointly the choices for a good thermal insulation and for a good sound insulation.
The improvement of the energy performance of existing buildings is one of the primary goals of the most recent European Directives, starting from 2002/91/EC.
In the case of renovation or maintenance of building walls, the minimum requirements imposed at national level usually indicate precise limits for the values of walls thermal transmittance. In addition, the problem of indoor overheating in summer is considered in some countries by imposing limits related to the thermal inertia parameters (periodic thermal transmittance, decrement factor, etc.).
Moreover, in addition to the correct evaluation of the thermal and hygrometric parameters of existing structures, the definition of organic strategies to improve the energy performance of the building envelope may be useful.
The need to follow the regulatory minimum requirements must be blended with the technical feasibility and the most appropriate choice of insulating materials.
The classification and analysis of existing walls is a starting point for the study and the choice of appropriate energy-saving actions, taking into account also the issues related to heat storage and hygrometrical aspects.
In the following, a brief overview on typical building walls around Europe is considered. The calculation method of the energy performance of buildings is resumed, and the significant parameters of the opaque envelope are highlighted. Some definitions and fundamental concepts, on which the calculations to be carried out are based, are briefly summarized. The application of the calculation methods is supported by examples. Some considerations on the choice of insulating materials are proposed, considering both the thermal and hygrometrical behaviours of walls.
2 Residential Building Structures of the Twentieth Century: Database of Walls and Buildings
The analysis of the existing building stock represents the first step to define general actions for improving the quality of constructions. In particular, it is useful to catalogue the main building typologies and their structural features according to the construction period and the geographical area, as reported in Table 1 (COST C16, 2007).
As it is shown in Table 1, it is apparent that in the central-northern part of Europe, the concrete and the precast panels are the main technologies, while in the Mediterranean area the envelope is often made of hollow and massive bricks.
Furthermore, in the past recent years, the aim of some research programmes is the definition of a database of existing construction typologies, which represents a strategic operation aimed to begin a structured energy refurbishment programme for low-performance buildings.
Wider information on the existing structures are useful for calculations of standard interventions, which allow to reach established efficiency levels in a systematic way; therefore, their collection may represent a first step for planning.
Some European projects were devoted to a better knowledge of existing building energy performance and refurbishment. An organized analysis of the existing building stocks (INVESTIMMO 2001–2004) provides for useful information related to the most common deterioration problems of the envelope structures and the general state of conservation of European constructions. The analysis was developed on 300 buildings in six Europe countries (Italy, Denmark, Switzerland, Germany, Greece and France) and it highlights that quite half of the buildings considered had façade thermal insulation damaged. If the results can be projected on a larger scale, the energy saving from the façade’s restoration could be significant globally.
Moreover, a more recent database of construction typologies, energy-related properties of structure and energy performance assessment (TABULA, 2009–2012) allows defining effective energy conservation measures.
In particular, it aimed to assess how a set of parameters (i.e. construction year, building size) influences the energy performance of existing buildings and the possibilities of energy saving; this acknowledgement allows to define, at national level, general plans for renovation and energy refurbishment.
The high thermal transmittance of the building envelope evaluated for a 230 multi-storey buildings sample taken all over Europe confirms the problem of the lack of insulation and the need of refurbishment (Fig. 1, no insulation dots). The U-values show a global reduction quite only in the last 10 years.

Thermal transmittance U related to building construction year
Furthermore in Fig. 1, the possible reduction in wall thermal transmittance is shown applying an insulation layer, respectively, 2 and 4 cm of mineral wall [λ = 0.036 W/(m K)]. It is apparent that the thermal transmittance decreases according to the insulation thickness with the best results for the worst cases. Therefore, the most effective actions can be addressed to the thermal insulation of buildings with the lowest energy performances: the results may contribute better to optimize the efforts required by the European Directives.
The scenario analysis of the possible energy savings through the improving of building energy performance represents a target of a more general European refurbishment planning. In particular, the project EPISCOPE (2013–2016), based on the national residential building typologies developed during the TABULA project, is planned to track the energy refurbishment progress of housing stock at different scales. Various refurbishment measures will be determined and compared with those activities needed to attain the relevant climate protection targets.
The preliminary analysis of TABULA proposed two refurbishment levels, to enhance the energy saving of the actual existing building (Level 1):
-
Level 2: standard refurbishment measures, commonly used in the countries.
-
Level 3: advanced refurbishment measures that use the best available technologies.
In Fig. 2, transmission losses of a series of multi-familiar houses, built in the twentieth century (most of all after the Second World War, until 1995), are shown, referring to the existing conditions (Level 1) and the two levels of interventions (2 and 3).

Annual transmission losses according to the existing situation (Level 1) and intervention (Levels 2 and 3)
It is apparent, also from these calculations, that the energy refurbishment of high-loss buildings, both because of the climate conditions and because of the level insulation of the actual envelope, is associated to high energy savings. On the other hand, increasing the energy performance of low-losses buildings is harder, even adopting advanced refurbishment techniques. Anyway, only in a few cases, the annual transmission losses account for less than 50 kWh/(m2 year) although the thermal transmittance of the envelope is reduced to 0.07–0.3 W/(m2 K).
3 Building Energy Performance: The Envelope Influence Calculation by Means of a Quasi-Steady-State Approach
The EN ISO 13790 Standard (Energy performance of buildings—Calculation of energy use for spaces—heating and cooling) provides, at European level, some indications on the calculation methods for the design and evaluation of thermal and energy performance of buildings.
Two approaches are possible:
-
quasi-steady-state methods, calculating the heat balance over 1 month or the whole season, taking into account dynamic effects by the simplified determination of a gain utilization factor;
-
dynamic methods, calculating the heat balance over 1 h and taking into account the heat stored and released from the mass of the building in a detailed way.
The building energy need for space heating, Q H,nd, in conditions of continuous heating, is calculated by:
where
-
Q H,nd is the building energy need for continuous heating, assumed to be greater than or equal to 0 (MJ);
-
Q H,ht is the total heat transfer for the heating mode (MJ);
-
Q H,gn gives the total heat gains for the heating mode (MJ);
-
η H,gn is the dimensionless gain utilization factor
and the total heat transfer, Q H,ht, is given by
where Q ve is the total heat transfer by ventilation and Q tr is the total heat transfer by transmission, which depends on temperature difference between indoor and outdoor environment \( \left( {\theta_{i} - \theta_{e} } \right) \), on the heating or cooling time period t and on H tr, the overall heat transfer coefficient by transmission, determined by
where
-
H D direct heat transfer coefficient by transmission to the external environment (W/K);
-
H g steady-state heat transfer coefficient by transmission to the ground (W/K);
-
H U transmission heat transfer coefficient by transmission through unconditioned spaces (W/K);
-
H A heat transfer coefficient by transmission to adjacent buildings (W/K).
In general, H x, representing H D, H g, H U, or H A, consists of three terms (see EN ISO 13789):
where
-
A i area of the i-element of the building envelope (m2);
-
U i thermal transmittance of the i-element of the building envelope [W/(m2 K)];
-
l k length of the k-linear thermal bridge (m);
-
\( \psi_{k} \) linear thermal transmittance of the k-thermal bridge [W/(m K)];
-
\( \chi_{j} \) point thermal transmittance of the j-point thermal bridge [W/(K)];
-
b tr,x adjustment factor for the external temperature.
The adjustment factor b tr,x has to be applied when the envelope element borders on a space which has a different temperature than external environment. As established by the EN ISO 13790, for the monthly and seasonal applications, the total heat transfer by transmission, Q tr, is calculated for each month or season and for each zone and depends on the overall heat transfer coefficient by transmission and on the monthly mean external and internal temperatures.
4 Main Parameters for the Thermal Characterization of Walls
As seen in the previous section, the evaluation of the envelope thermal losses requires the assessment of the heat transfer coefficient H tr, which depends on the thermal transmittance of the building walls and thermal bridges.
4.1 Building Walls: Thermal Transmittance
In order to define the thermal transmittance of walls, different methodologies could be applied as shown in Fig. 3.

Wall U-value definition
The thermal transmittance evaluation for new construction buildings represents an easy operation, since the thermo-physical properties are reported in the technical documents of the project. On the other hand, for existing constructions, the data related to the thermal behaviour of materials are usually not easily available.
Surface heat transfer coefficients and air layer thermal resistances can be calculated according to the values defined by the EN ISO 6946 Standard, which reports all the indications for the evaluation of thermal transmittance.
4.1.1 Example of Thermal Transmittance Evaluation
Given a wall structure with its layers’ characteristics and thermal properties, it is possible to calculate the thermal transmittance. In Table 2, the calculation details are reported, considering that:
-
the thermal resistance of homogeneous layers can be calculated as: R = L/λ
-
the thermal transmittance U is obtained as: U = 1/R t.
4.2 Thermal Bridges Evaluation
In the envelope energy performance assessment, thermal bridges play an important role because they influence the heat flow rate and the internal surface temperature, as indicated in the Eq. 4 for the heat transfer coefficient.
Thermal bridge is defined as follows: part of the building envelope, where the otherwise uniform thermal resistance is significantly changed by full or partial penetration of the building envelope by materials with a different thermal conductivity, and/or a change in thickness of the fabric, and/or a difference between internal and external areas, such as occur at wall/floor/ceiling junctions (EN ISO 10211 Standard).
In general, they are located in any connection between building components or where the building structure changes composition, and in these elements, the hypothesis of mono-dimensional flow is not correct, since they cause two-dimensional or three-dimensional heat flows.
In order to take into account the incidence of a thermal bridge on the whole heat flow, the linear thermal transmittance ψ [W/(m K)] is used; it represents the heat flow rate in steady-state conditions, divided by the length of the junction and by the temperature difference between internal and external surfaces.
In particular, reference values could be used for some standard structures referring to a catalogue of thermal bridges and values of ψ (EN ISO 14683) in relation to some different geometrical dimension, as follows:
-
ψ e : linear thermal transmittance determined according to the external dimensions and measured between the finished external faces of the building external elements;
-
ψoi linear thermal transmittance determined according to the overall internal dimensions and measured between the finished internal faces of the building external elements including the thickness of internal partitions;
-
ψ i : linear thermal transmittance determined according to the internal dimensions and measured between the finished internal faces of each room in a building excluding the thickness of internal partitions.
Furthermore, if the analysed thermal bridge is not included in the standard catalogue, it is possible to determine its linear thermal transmittance through numerical methods. The EN ISO 10211 Standard provides for the definition of a geometrical model of a thermal bridge for the numerical calculation of heat flows and surface temperatures considering the following assumptions:
-
all physical properties are independent from temperature;
-
there are no heat sources within the building element.
Moreover, a thermal coupling coefficient is defined depending both on the heat flows and on the linear thermal transmittance.
In particular, given the geometrical features and the thermal properties of the thermal bridge, it is possible to use a numerical model, whose output is the global heat flows through the element. The coupling coefficient can be determined by the following equation:
where
-
θ i and θ e represent the internal and the external air temperature;
-
\( \varphi_{\text{l}} \) is the linear thermal flow of the thermal bridge;
-
L 2D is the coupling thermal coefficient of the thermal bridge, which has to be evaluated
Then, the linear thermal transmittance can be assessed through:
where
-
\( U_{i} \) is the thermal transmittance of one-dimensional component separating the two environments;
-
\( l_{j} \) is the length within the 2D geometrical model over which the value U j is applied;
-
N j is the number of one-dimensional components.
4.3 Dynamic Thermal Characteristics of the Envelope
The evaluation of the dynamic thermal behaviour of the envelope is based on the definition of transient building simulation models that consider the heat storage in the structure and the time dependence of boundary conditions.
These models should be adopted for the analysis of summer behaviour; in fact, for the heating season, the evaluation by quasi-steady-state methods allows to obtain reliable results. Nevertheless, the quasi-steady-state methods do not represent accurately the thermal behaviour of buildings during the cooling season; therefore, a transient model has to be applied to have accurate results.
Moreover, the European Directive 2020/31/EU highlights that the cooling energy needs have been increased during the last years, and it suggests to focus on strategies which enhance the thermal performances also during summer period, and on the thermal properties that influence the internal overheating, such as heat thermal capacity, specific mass, periodic thermal transmittance, time shift and decrement factor. In particular, the Directive establishes that minimum requirements according to the climatic conditions have to be fixed at national level; therefore, for the countries of the Mediterranean area, dynamic envelope features that reduce the cooling energy needs have to be evaluated.
The EN ISO 13786 Standard defines the dynamic thermal characteristics of the envelope.
One of the significant parameters in this field is the periodic thermal transmittance Y ie [W/(m2 K)], which is defined as the amplitude of the heat flow rate through the component surface adjacent to a zone which is kept at constant temperature, divided by the amplitude of the temperature in the adjacent zone (which also could be the external environment).
Another parameter, which represents the effect of the envelope on the inward heat flow rate, is the decrement factor, which is expressed by the ratio between the periodic thermal transmittance Y ie [W/(m2 K)] and the quasi-steady-state thermal transmittance U [W/(m2 K)]:
The envelope influence on the thermal behaviour is also represented by the time shift Δt, which is defined as the period of time between the maximum amplitude of a cause and the maximum amplitude of its effect.
5 Vapour Transmission Problems
The knowledge of moisture transfer mechanisms, material properties, initial and boundary conditions is often limited.
The building structures are exposed to variable internal and external climatic conditions, as they are usually influenced by outdoor air temperature, relative humidity, solar radiation, rain or are in contact with humid soil. In addition, some building components (concrete, etc.) in the construction process are characterized by high moisture contents that should be dried in short times to avoid the risk of damage to the other components.
The moisture problems that may affect building structures are various: capillary rise of water in the walls, condensation inside building components due to infiltration of indoor air (hot and humid), problems with tightness to rainwater, salts migration inside materials, etc. and, not less important phenomena, hygrometric surface problems (growth of mould and moisture condensation) and water vapour condensation inside structures.
Therefore, the hygrometric assessment of existing building components presents considerable practical interest and it can be used, for example, to determine whether the operating conditions may lead to a progressive deterioration of the structures.
The constructions can indeed present different degradation levels depending on the types of aggression to which they are subjected: one of the most significant causes is represented by the presence of moisture or liquid water. Some materials, in fact, absorbing water vapour, increase their volume and can generate movements and internal tensions to the structures causing leakages and deformations.
Moreover, the presence of liquid water can cause an increase of thermal conductivity, thus degrading the heat transmission properties. The elimination of the serious damage resulting from the presence of water in the structures may represent a significant item of the costs for the building refurbishment.
The moisture transport and condensation in porous media is very complex, so even today, the degree of knowledge of the interaction between the various transport mechanisms and properties of building materials is unsatisfactory, incomplete and under development.
The International Standard, that gives calculation guidelines to assess of surface mould growth and the interstitial condensation for the prevention of these phenomena, adopts therefore simplified methods. The results of the calculations should be considered an approximation of more complex physical phenomena and therefore characterized by uncertainty. The standardization of simplified methods obviously does not preclude the use of more accurate calculation methods.
The following considered aspects are related only to a part of the hygrometric problems that afflict building structures: in fact, the surface mould growth and the interstitial condensation are considered essentially due to the vapour transport through the wall caused by a difference in partial vapour pressure of the internal/external environment.
The calculations follow the indications provided by the most recent release of the EN ISO 13788 Standard. Therefore, the moisture transfer through a wall is considered purely a function of inside and outside temperature and humidity conditions, and of dimensional and thermo-physical characteristics of its layers.
The diffusion of water vapour through a structure by itself may not cause problems, if it does not cross areas with too low temperature to cause condensation. In particular, two different phenomena can be considered:
-
at the wall surface: high values of relative humidity or even, vapour condensation (surface phenomena);
-
inside the material layers: vapour condensation as the vapour pressure reaches the saturation pressure (interstitial phenomena).
These phenomena can occur at different times and the distinction between them may not always be clearly defined: the effects of interstitial condensation may arise on the surface and this can happen even after a long time and in zones far from the ones where it took place.
Side effects resulting from these phenomena can produce degradation of buildings and unhealthy environments in the following forms:
-
growth of fungal colonies on the inner surface of the building envelope;
-
the presence of condensed water on the surface and inside of the walls;
-
decay of wooden structures;
-
degradation of plaster;
-
reduction in the thermal insulation;
-
dimensional changes and damage of artefacts;
-
migration of salts, efflorescence.
The occurrence of these phenomena, as well as depending on the characteristics of the building and the external climatic conditions, increases with the indoor vapour production and with the reduced air renewal.
5.1 Vapour Diffusion: Basic Parameters
To address the problem of the vapour transfer in walls it is necessary to consider the mechanisms that produce its movement.
Mainly, the vapour flow within a material is determined by a difference between the partial vapour pressures or the vapour concentrations in the air in contact with the two faces of the wall. This phenomenon can be observed commonly in building structures.
Human activities modify the vapour concentration in the internal environment that, therefore, especially in winter, is higher than the one in the external environment. It can be assumed that, at least in the winter season, the moisture transfer is from inside to outside the building.
The thermo-physical parameters of the materials involved in a simplified approach to the problem, in steady-state conditions, are mainly the thermal conductivity λ [W/(m K)], which affects the temperature profile within the layers, and the water vapour permeability δ [kg/(m s Pa)], which determines the greater or lesser capacity of a material to be crossed by the water vapour. For some materials, it is indicated the hygroscopic resistance factor μ = δo/δ (–), where δo is the water vapour permeability of the air, which assumes, as the reference value, 200 × 10−12 kg/(m s Pa).
To describe in a quantitative way the mass transport by diffusion, the Fick’s law can be applied: it relates the vapour flow rate per unit area \( {g}_{\text{v}}^{{\prime }}\) through a material (thickness L and vapour permeability δ), with the difference ΔP v between the vapour pressures of the air on its surfaces. Assuming steady-state conditions, \({g}_{\text{v}}^{{\prime }}\) [kg/(m2 s)] can be expressed as
It remains constant if there are not condensation phenomena in the internal layers. They may occur if the internal temperatures are low enough to cause low values of saturation vapour pressure: local vapour pressure can reach easily the maximum value of saturation.
The expression often refers to the equivalent thickness s d [m]:
where
- μ = δo/δ:
-
Hygroscopic resistance factor
- δo :
-
Vapour permeability of air = 193 × 10−12 kg/(m s Pa), approximated in the calculations to 200 × 10−12 kg/(m s Pa)
Therefore, the vapour flow rate \({g}_{\text{v}}^{{\prime }}\) [kg/(m2 s)] can be written as
5.2 The Assessment of the Risk of Interstitial Condensation Due to Water Vapour Diffusion
The Glaser method allows to verify the risk of interstitial condensation in a building wall through a graphical representation.
It compares the vapour pressure values with the saturation pressure ones, calculated as a function of the temperature distribution within the different layers of the wall. From the graphical comparison of the two trends, it is possible to put in evidence the condition in which there is condensation of the vapour, which occurs if the vapour pressure reaches the value of the saturation.
The wall passes the test if two criteria are met:
-
the calculation (usually on a monthly basis) demonstrates that any condensation can be completely dried throughout the year.
-
the condensation in a layer does not exceed the limit values of the materials involved.
Although the Glaser method is the reference for the evaluation of the vapour condensation risk in building structures, the method has limitations that can lead to mistakes.
Indeed, the thermo-physical characteristics of the materials, such as thermal conductivity, depend on the moisture content of the materials, which is influenced by the capillary absorption, by the liquid water transfer, or even by the movements of air through cavities or by the superficial absorption of rain.
The method considers the built-in water dried out and it neglects some effects:
-
the variation of material properties with moisture content;
-
the capillary suction and the liquid water transport within the material;
-
the air movement through cavities or air spaces;
-
the hygroscopic moisture capacity of materials.
The evaporation and condensation processes that may occur in the materials also involve thermal energy exchanges that modify the temperatures distribution and the corresponding saturation pressures. Moreover, the effects of the solar radiation can contribute to change the distribution of the temperature in the outer layers.
In addition, neglecting the effects listed above, the analysis based on the Glaser method is carried out considering the mono-dimensional moisture transport and assuming constant boundary conditions.
The interstitial condensation assessment is developed referring to the monthly mean values of the climatic data. The verification process can be summarized in the following steps.
-
Step 1
Boundary conditions
-
(a)
Material properties and geometrical dimensions (thickness).
Thermal conductivity or thermal resistance or conductance and vapour permeability of the layers are the main information needed.
For new buildings, the necessary data can be found in the technical specifications, while for existing buildings, some indications provided by international/national standards can be considered as reference values. For example, EN ISO 10456:2008 “Materials and products for buildings—Hygrothermal properties, tabulated design values and procedures for determining declared and design thermal values” can be a reference for some materials.
Some indications (by EN ISO 13788) should be taken into account:
-
elements with a thermal resistance greater than 0.25 m2 K/W should be subdivided into a number of notional layers, each one with thermal resistance ≤0.25 m2 K/W; these subdivisions are treated as separate material layers with interfaces between them in all calculations;
-
if the wall presents a ventilated cavity, the presence of materials between this and the outside is ignored;
-
some materials, such as aluminium foil, effectively prevent vapour transmission: their water vapour resistance factor is practically infinite. However, since for the calculation procedure is required a finite value, for these materials it is assumed μ = 100,000. This can lead to predict small quantities of condensed water that should be neglected.
-
(b)
Surface thermal resistance. To calculate the surface thermal resistance, the reference standard is EN ISO 6946 (Table 3), as well as for the thermal resistance of cavities. For air layers, the equivalent thickness s d is considered to be equal to 0.01 m, regardless of their real thickness and position (vertical/horizontal).
Table 3 Surface thermal resistance for the interstitial condensation calculations -
(c)
External boundary conditions: monthly mean temperature and vapour pressure values are considered.
-
(d)
Internal boundary conditions: air temperature. The indoor air temperature is assumed according to the expected use of the building. For residential buildings, in the absence of specific information, the following values may be considered (ref. Italian regulations):
-
t i = 20 °C in the heating period (heating system is on);
-
t i = 18 °C out of the heating period, when the monthly average outdoor temperature is t e <18 °C;
-
t i = t e when the monthly average outdoor temperature is ≥18 °C.
-
(e)
Internal boundary conditions: vapour pressure. If there is a HVAC system, relative humidity and internal temperature are imposed and the corresponding vapour pressure can be calculated. In the absence of a relative humidity control system, the data should be obtained by a hygrometrical balance of the environment.
Alternatively, for maritime-mild climates, in the absence of detailed information on the building use, and of a RH control system, the information provided by the graph in Fig. 4 may be useful.

P vi − P ve as function of humidity classes. Legend: Class 1 unoccupied buildings, storage of dry goods. Class 2 offices, dwellings with normal occupancy and ventilation. Class 3 buildings with unknown occupancy. Class 4 Sports halls, kitchens, canteens. Class 5 Special buildings, e.g. laundry, brewery, swimming pool
The horizontal axis represents the external monthly mean temperature. Month-to-month, the difference between internal and external vapour pressure ΔP v can be determined, rising up from the temperature to meet the upper line of the chosen class. The upper lines are the reference for each class. In principle, residential buildings refer to class 3.
-
Step 2
Starting month
The climatic conditions of the starting month correspond to the first month in which condensation occurs (if there is). In principle, as a first attempt, the climatic conditions of a month at the end of the autumn can be considered. Once the starting month is individuated, the monthly mean external climatic conditions (temperature and relative humidity or vapour pressure) are used to calculate the amount of condensed/evaporated water (if any) month by month to complete the annual cycle.
-
Step 3
Calculation of the temperature and saturation pressure distribution inside the wall.
All data are referred to interfaces between layers. The temperatures at each interface between layers are calculated, as function of the thermal resistances and the temperatures of the indoor–outdoor environments.
The saturation pressure P s (Pa) is calculated as a function of temperature. The following expressions can be used:
-
Step 4
Vapour pressure distribution. Graphical comparison between vapour pressure and saturation pressure values, as a function of the equivalent thickness s d, allows to verify whether there is condensation. It occurs if the vapour pressure reaches the saturation pressure.
-
Step 5
In case of the presence of condensation in the trial month conditions: the calculation must be performed for the external climatic conditions of the previous month. The procedure is repeated backwards until it is individuated the first month in which no condensation occurs. Starting from this one, the amount of condensation the next months is calculated.
-
Step 6
In case of no condensation in the wall: the wall is checked with the climatic conditions of the following month. If there is no condensation in all the 12 months of the year, the structure is free of interstitial condensation. If condensation occurs in a following month, this is considered the starting month for the calculation of the amount of condensation.
-
Step 7
The presence of condensation during some months. The condensation can evaporate in some other months of the year. In the first month in which the calculation does not show condensation, it is assumed P v = P s in the wet layer of the previous month, to calculate the amount of evaporated water. In the following months, the same principle is applied, until all the condensation is progressively dried.
-
Step 8
Add up all positive (condensation) and negative (evaporation) quantities and verify that the sum of the positive contributions can be balanced by the negative ones over the year.
-
Step 9
The total amount of accumulated condensate is compared with the maximum values allowed for the different types of materials.
In the EN ISO 13788 standard, the risk of run-off from non-absorbent materials is considered very high over 200 g/m2 of condensate. In other cases (i.e. Italian regulations), for example, the maximum amount of condensate accumulated in a layer is \( M_{\text{c},\text{amm}} = { 5}00\;{\text{g}}/{\text{m}}^{ 2} \). For some materials, lower values are taken into account, in function of thickness L (m), density ρ (kg/m3) and conductivity λ [W/(m K)]:
-
Wood \( (\rho = { 5}00 \, - { 8}00{\text{ kg}}/{\text{m}}^{ 3} ) :\, M_{{\text{c},{\text{amm}}}} \le 30\,\rho\,{\text{L}} \)
-
Plaster and mortar \( (\rho = { 6}00 \, - { \text{2,000}}{\text{ kg}}/{\text{m}}^{ 3} ) :\, M_{{\text{c},\text{amm}}} \le 30\;\rho\;{\text{L}} \)
-
Mineral wool \( (\rho = { 1}0 - 1 50{\text{ kg}}/{\text{m}}^{ 3} ) :\, M_{{\text{c}, \text{amm}}} \le {\text{5,000}}\;\rho\;{\text{L }}[\uplambda/( 1 { } - { 1}, 7\,\uplambda)] \)
-
Cellular plastic materials \( (\rho = 10 - 80 \, \text{kg/m}^{3} ) :\, M_{{\text{c},\text{amm}}} \le {\text{5,000}}\;\rho \;L \, [\lambda /(1 \, - \, 1,7\,\lambda )] \)
-
Step 10
The assessment is positive if both conditions referred to in Steps 8 and 9 are satisfied.
5.2.1 Example: Interstitial Condensation Calculation
To illustrate the calculation procedure for the verification of interstitial condensation problems, a wall with the geometrical and thermal characteristics described in the following has been considered.
-
Step 1
(1a, 1b)—the geometrical structure and thermal parameters are summarized in Table 4. The climatic conditions (1c, 1d) are reported in Table 5. The indoor vapour production (1e) is assumed corresponding to class 3 (Fig. 4); therefore, the internal vapour pressure can be calculated by means of the slope of the corresponding lane, analytically expressed as:
Table 4 Thermal properties of the wall Table 5 Internal and external climatic conditions
The P vi values are resumed in Table 5, as well as the internal temperature of the environment, based on the criteria reported in Step 1 of the procedure. For each layer is calculated also the equivalent thickness for vapour diffusion \( s_{\text{d}} = L\updelta_{\text{o}} /\updelta\left( {\text{m}} \right) \) (Table 6).
-
Step 2
The calculations start with the conditions of the trial month: it is established (arbitrarily) to be October. The corresponding monthly mean values of temperature and vapour pressure are considered. Depending on the climatic conditions, it is possible that condensation will not occur in October and it will not be necessary to proceed backwards with the search of the first month of the condensation.
-
Step 3
The temperatures at different interfaces are calculated, based on the outside temperature and on the relationship:
and they are applied for each x-interface:
and so on for all the layers. All the values are reported in the third column of Table 7. From them, it is possible to calculate the corresponding values of the saturation pressure.
-
Step 4
To calculate the vapour pressure in each interface, the vapour resistance surface coefficients are neglected, and therefore, the vapour pressures on the two wall surfaces coincide with the corresponding environmental ones:
Starting from the assumption that there is not condensation and therefore the vapour flow rate through the wall is constant, the two surface values can be connected by a straight-line segment in a plot P v versus s d. Analytically, the vapour pressure of each interface is calculated according to Fick’s law:
and therefore
and similarly, applying the same relation to all the following layers:
from which
and so on for the other layers.
The vapour pressure values in the different interfaces are reported in Table 7.
The calculations for October show that all values of the saturation pressure are higher than the vapour pressure in each interface and therefore no condensation occurs for the conditions of this month. Step 5 can be skipped.
-
Step 6
The calculations are developed for the 12 months (Table 7) with the input data in Tables 4 and 5. The difference between saturation and vapour pressure in November can be put in evidence: in the interface 3c-4, it can be observed that P v > P s. The diagrams in Fig. 5 highlight the occurrence.
Fig. 5 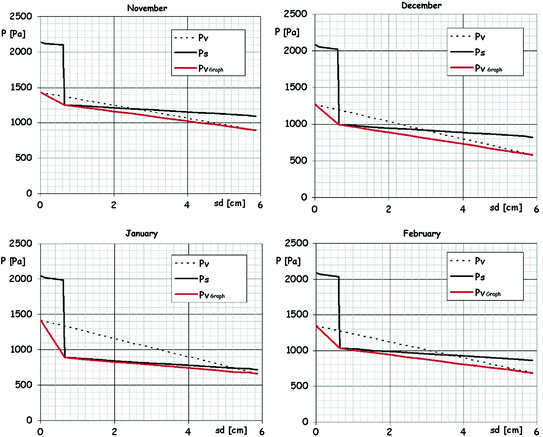
Glaser diagrams (condensation) for a November, b December, c January, d February

Then, the month of November is the starting month for the calculation of the amount of condensation that forms at the interface between the two layers.
P v is plotted as a straight line between the surface values and the P s lower value (in this case at the interface 3c-4). The difference between the two slopes represents the rate of condensed water.
-
Step 7
The calculations proceed with the climatic conditions of the subsequent months, to determine the amount of condensate accumulated in the interface for each month. The condition P v > P s is observed until February and the same procedure of November is applied. Note that for January, the comparison between P v and P s shows that P v > P s, also the interface 3b-3c. From the graph (Fig. 5c), however, it is observed that the minimum P s corresponds to the interface 3c-4.
For example, the condensate for November is detailed (\( {\text{g}}_{{\text{H}}_2{\text O}} \) in [kg/(m2 s)]):
The water condensate in the whole month will be
The calculation of the amount of condensed water is performed for all months until February: the quantities are indicated in Table 8.
In March, all interfaces present P v < P s; therefore, the amount of evaporated water is calculated assuming that P v = P s in the 3c-4 interface, where the condensate remains concentrated until complete evaporation.
On a graph (Fig. 6), the trends of the saturation and vapour pressure are shown; the mass of evaporated water in the period can be calculated as

Example of Glaser diagrams for evaporation: a March, b June
Due to the positive direction of the x-axis from inside to outside, the negative sign indicates that the vapour flow is directed from the interface to the indoor environment. The vapour flow from the interface 3c -4 to outside can be expressed as
In this case, the positive sign indicates that the vapour flow is directed to outside. The two calculated flow rates show that the vapour transfer occurs from the interface where it condensed in the previous months both to the internal and external environments.
The total amount of evaporated water in March will be
The calculation goes on under the climatic conditions of the subsequent months, starting from the hypothesis (P v = P s)3c-4 until the total amount of condensate is dried. The results, obtained with the same procedure, are in Table 8.
-
Step 8
The progressive sum of condensate (Table 8) grows from November to February and then decreases until June, due to evaporation. In the following months, the wall is dry.
-
Step 9
Assuming the limits for the condensation in mineral wool panels as indicated in the previous paragraph, the maximum level should be
The values in Table 8 show that the sum of the condensate at the end of January would exceed the limit for mineral wool.
-
Step 10
The assessment is negative, as the condition referred to in Step 8 is satisfied, but not the one in Step 9.
6 Common Typologies of Walls and Their Characteristics: A Wall Database
Considering the method and the results of the projects INVESTIMMO and TABULA, a wall database, which integrates information related both to energy performance (i.e. thermal conductivity, transmittance and dynamic properties) and to hygrothermal behaviour (interstitial condensation assessment) was developed.
The database collects a large number of walls, which represent the constructive typologies of post–World War II buildings all over Europe.
In particular, the database includes information related to:
-
thermal parameters: thermal transmittance, thermal mass, areal thermal capacitance;
-
dynamic parameters: periodic thermal transmittance, time shift and decrement factor.
The control of moisture problems, such as the interstitial condensation risk, must be analysed basing on specific climatic conditions.
In Table 9 are reported the wall typologies and their parameters. For the calculations, surface thermal resistances of Table 3 are applied.
7 Thermo-Hygrometric Problems: Introduction to Energy Refurbishment
The overall energy consumption of a building is determined by numerous factors, and some of them cannot be changed under renovation. In fact, the geometry, the orientation, the relationship between opaque and transparent surfaces, and the location in urban area represent some of the constraints to the improvement of building energy performance.
In order to reduce energy consumption in existing buildings, the possibilities offered by synergistic actions on elements of the building envelope and plant components have to be assessed.
The HVAC system can be, at least partially, replaced or made more efficient with non-invasive interventions, while the renovation of the envelope can cause more inconveniences to the occupants. Nevertheless, the insulation of the envelope allows to reduce the transmission losses and the energy needs of buildings.
The building energy performance assessment requires also the analysis of HVAC systems, in order to verify whether the plants can efficiently operate even with a low energy demand. On the other hand, reducing the amount of energy allows to consider alternative system solutions that include the exploitation of renewable sources. The refurbishment of the opaque elements of existing buildings means, in general, using thermal insulation materials to decrease the transmittance and therefore the energy losses through the walls facing towards the external environment. The consequences of the insulation can be summarized with the following considerations.
Increasing insulation of external structures allows the reduction of winter heat losses and of summer loads, with the reduction of global energy consumption.
Moreover, a careful design and verification of glazed surfaces and their solar shading is necessary. In fact, incorrect evaluation of the transparent elements influence in summer could cause overheating and greenhouse effects in the indoor environment. In this case, a high thermal insulation level would reduce the heat loss through the walls from inside to outside, maintaining a high temperature, not desired, in the indoor environments, in summer.
Insulating the external envelope can improve the indoor comfort as if the wall surface temperature is closer to the air one, the heat exchange by radiation between the human body and the different surfaces is reduced.
There are three main solutions for thermal insulation:
-
external insulation;
-
internal insulation;
-
air layer insulation.
The most effective one is the external insulation, even if it is also the most expensive. Moreover, it is not always feasible, since, for the application, the facade must be free of ornaments. This solution is interesting if the installation cost of scaffolding and other works is considered in association with the other renovation actions already planned and if there is not a large number of overhang elements in the external surface.
With the installation of a ventilated facade, good results can be reached, even if with rather high costs. The intervention with insulating plaster could be useful, if considered synergistically with other actions, due to the low thickness of the layer. In fact, even if insulating plaster is characterized by a low thermal conductivity, it could lead to results that do not comply the minimum requirements for the envelope.
The air layer insulation can be interesting for many buildings built between the 1960s and 1970s, since they often have empty cavity in the envelope layers, which can be filled by melted materials. The results can be effective: it is possible to apply the insulation from external holes in the façade or from inside without high costs.
However, the thermal properties of the insulation (foam or melted material) have to be defined. Moreover, before performing this kind of action, it would be appropriate to have information on the effective period in which the properties are guaranteed; otherwise, it will be necessary a second application after a period in dependence of the degeneration and the maintained uniformity of the filling material.
The internal insulation may be less difficult, since it regards single dwellings and it does not involve actions on the facade, the use of scaffolding, etc. Nevertheless, this intervention could reduce the internal surface of the living spaces; therefore, it has to be correctly designed and planned. In fact, while the insulation in the cavity presents physical limits due to the width of the air layer, the application of insulating panels becomes effective for thicknesses generally higher than 4–6 cm, especially in the continental climatic conditions.
Regarding the dynamic thermal performance of the walls, the position of the insulation greatly influences the thermal inertia of the structure. The heat storage is determined by the properties of materials, which are involved in the heating transmission of the envelope, In general, the external insulation provides better results.
As regards hygrometric properties, a higher thermal insulation undoubtedly involves a good improvement in terms of surface moisture problems. Nevertheless, the situation should be carefully assessed in terms of risk of interstitial condensation, especially when the insulating layer is located close to the internal side of the wall.
7.1 Evaluation of Insulation Intervention: Practical Examples
As reference for the thermal transmittance reductions of building walls, the effects of the thermal insulation of the structures of the database (Table 9) are calculated, considering two kind of installation, on the internal or the external side. As an alternative, for air layer masonry, the effect of the cavity insulation is also considered.
For each structure, three different kinds of insulated materials widely used in building refurbishment are considered (Table 10). Their properties are gathered from the technical files of commercial products.
Moreover, for the evaluation of the periodic thermal transmittance, it is also taken into account the position of the insulating layer (external or internal). An additional layer of external plaster is added in case of external insulation.
The following graphs (Fig. 7a–x) allow to check the insulation thickness needed to improve the performances indicated by local requirements or limits of the thermal transmittance U and periodic thermal transmittance Y ie. In addition, cavity filling is evaluated, where applicable.


U and Y ie values versus insulation thickness. a 01 BM—brick masonry. b 02 BM—masonry face brick. c 03 BM—cellular brick masonry. d 04 SM—stone masonry. e 05 SM—tuff stone masonry. f 06 SM—stone masonry with air layer. g 06 SM—stone masonry with air layer—cavity insulation. h 07 SM—stone masonry with insulated layer. i 08 CM—brick and stone masonry. j 09 CM—masonry with air layer. k 10 CM—hollow concrete block masonry (1). l 11 CM—hollow concrete block masonry (2). m 11 CM—hollow concrete block masonry (2)—cavity insulation. n 12 HB—hollow brick masonry (1). o 12 HB—hollow brick masonry (1)—cavity insulation. p 13 HB—air layer brick masonry (1). q 13 HB—air layer brick masonry (1)—cavity insulation. r 14 HB—air layer brick masonry (2). s 15 HB—air layer brick masonry (3). t 15 HB—air layer brick masonry (3)—cavity insulation. u 16 HB—air layer brick masonry (4). v 16 HB—air layer brick masonry (4)—cavity insulation. w 17 PC—concrete wall. x 18 PC—concrete insulated wall (2)
8 Interstitial Condensation Evaluation: Maximum Insulating Thickness Allowed in the Refurbishment for Some Wall Structures
It is important to associate the choice of insulation, in relation to the limits for the energy refurbishment, to the corresponding hygrometric assessment. Sometime, for particular climatic conditions and building structures, an optimal choice in terms of energy saving may not be suitable in relation to the risk of interstitial condensation.
Following the steps of the procedure for the interstitial condensation assessment, the previously described walls are considered in the following calculations, to determine the insulating layer thicknesses for a positive assessment (Step 10). As reference, only the structure number is indicated, from 01 to 18.
As before, for the thermal calculations, various insulating materials, thicknesses (from 1 to 12 cm), position (outside, inside, filling the air layer) have been considered with their hygrothermal parameters.
The indoor moisture production was referred to humidity class 3 (buildings with unknown occupancy, Fig. 4). The climatic data of six different regions in Europe are resumed in Table 11 [t e in (°C), P ve in (Pa)].
The upper limits of condensation in the annual cycle for different materials have been calculated in function of thickness L (m), density ρ (kg/m3) and conductivity λ [W/(m K)] of the chosen materials, in agreement with the indications described in Sect. 5 (Table 12).
8.1 Existing Walls
Condensation occurs in the following existing structures:
-
Wall 06, in the climatic conditions of Milan and Hamburg (<2 g/m2).
-
Wall 07, in the climatic conditions of Milan, Paris, Brussels (<3 g/m2) and Hamburg (<6 g/m2).
-
Wall 11 and 18, in the climatic conditions of Milan (<110 and <350 g/m2, respectively), Hamburg (<200 and <2,000 g/m2), Paris and Brussels (<35 and <720 g/m2).
-
Wall 14 and 16, in the climatic conditions of Milan (<20 and <4 g/m2, respectively).
8.2 External Insulation
The results of the assessment of condensation in the case of external insulation show that sometime condensation may occur before the external plaster layer with moderate quantities.
Walls 1–2, 4–11 and 13: no condensation occurs for any climatic conditions.
Wall 3:1 cm PY produces condensation in the climatic conditions of Milan (<30 g/m2) and Hamburg (<15 g/m2).
Wall 12 presents condensation in the climatic conditions of Milan, for MW and WF (thickness >2 cm), and of Hamburg for MW (>5 cm). In the same climatic conditions, 1 cm PY produces, respectively, <35 and <15 g/m2 of condensation in the annual cycle. In any case, the amount of condensation is moderate and lower than the maximum values for the materials involved.
Wall 14, affected by interstitial condensation in the existing conditions and climate of Milan, becomes free of condensation for the same climate, if MW or WF is used. For PY, the amount of assessed condensation reduces gradually to zero, but it occurs for 1–2 cm.
Walls 15, 16 and 17 present condensation for MW (for thickness >4, >5 and >4 cm, respectively), for WF (>7, >8, >5 cm) and for PY (1 cm only for 15 and 16) in the climatic conditions of Milan. Wall 15 presents condensation also for Hamburg only for 1 cm thickness PY (<20 g/m2). In any case, the amount of condensation is small and lower than the maximum values for the materials involved.
Wall 18: the problem of condensation, found for Paris and Brussels in the existing conditions, disappears with any insulating material and thickness, while for Milan remains also with 1 cm of MW, WF and PY. For the climatic conditions of Hamburg, condensation occurs only for 1 cm PY.
8.3 Internal Insulation
Generally, significant problems of condensation emerge for internal insulation, even if sometimes it is an easier refurbishment solution, mostly in the case of articulated, painted, decorated façades. The calculation results are summarized in Table 13: for each wall (01–18) and the three insulating materials, the thickness that corresponds to the absence of condensation is in brackets, the positive assessment is pointed out as X, on the contrary the number indicates the maximum thickness that allows a positive assessment.
8.4 Air Cavity Insulation
In the case of cavity insulation, the risk of condensation is estimated for 3–30 cm air layer thickness and for cellulose or polyurethane foam filling. Through the calculations, 12, 13 and 15 walls are free of condensation for all the climatic conditions considered (Table 11), even if 13 wall presents condensation for 3–11 cm cavity thickness with PY foam, in the climatic conditions of Milan. Condensation results in 06 and 11 walls are resumed in Table 14.
8.5 Refurbishment Example: How to Evaluate the Intervention
Considering the wall described in Table 15 (taken from Table 9), it is shown how to calculate the appropriate thickness of mineral wool, to reach the value of thermal transmittance U = 0.30 W/(m2 K) and the dynamic thermal transmittance Y ie = 0.12 W/(m2 K). Interstitial condensation assessment is also performed.
Starting from the thermal properties of the analysed wall, the minimum thickness of insulation which allows to reach the imposed transmittance values is determined through the diagrams in Fig. 8a and b.

a Thermal transmittance U. b Dynamic transmittance Y ie according to the insulation thickness (internal and external insulation layer)
To reach the U-value of 0.30 W/(m2 K), 7 cm insulation thickness is necessary both for the internal and the external insulation layer.
For the dynamic thermal transmittance, 4 cm thickness has to be applied for the external layer and 5.5–6 cm is needed if the intervention is on the internal layer.
This last information is useful to define the optimal position of the insulation layer (internal or external), even if in this case the most strict condition is determined by the thermal transmittance (Table 16).
Moreover, an intervention of air layer insulation is also evaluated (Fig. 9). If the air cavity thickness is greater than 10 cm, the target U-value is reached both with cellulose or polyurethane foam filling. The same result is obtained for the dynamic thermal transmittance limit.

a Thermal transmittance U. b Dynamic transmittance Y ie according to the insulation thickness (air layer)
Referring to the climatic conditions in Table 11, the application of 7 cm mineral wool insulating layer causes interstitial condensation. For the external insulation, it occurs in the climatic conditions of Milan and of Hamburg. In any case, the amount of condensation is moderate and lower than the maximum values for the materials involved. In case of internal insulation, the climatic conditions of Rome do not cause condensation at all; in Madrid, condensation occurs, but it satisfies the two criteria for interstitial condensation (acceptable maximum condensate quantity and complete evaporation). In the other climatic conditions (Milan, Paris, Brussels, and Hamburg), the wall is not verified.
The calculations show that the wall is free of condensation for all the climatic conditions considered, if the air cavity is filled with cellulose or polyurethane foam.
9 Case Study: Evaluation of the Envelope Incidence in Terms of Energy Performance
In order to estimate the importance of the envelope in building refurbishment, a set of simulations is carried out considering a case study. In particular, one flat of a typical construction built in the 1970s is adopted (Fig. 10).

Case study—general plan
The case study is a single dwelling in an intermediate level (adiabatic floor and ceiling). The main geometrical features are reported in Table 17.
The single glass windows have a wooden frame and a thermal transmittance of 3.44 W/(m2 K). In order to investigate the different hygrothermal behaviours of some representative wall typologies described in Sect. 6, three opaque envelope hypotheses were defined according to the age of the analysed construction, as reported in Table 18.
The energy performance of the base case (without thermal insulation) was assessed according to the quasi-steady-state method presented in Sect. 6, referring to three different climatic conditions (Hamburg, Madrid, Milan).
9.1 Refurbishment Interventions
According to each building typology, a set of envelope renewal interventions is defined in order to evaluate the improvement of the energy performance. In particular, the four insulation materials reported in Table 19 are adopted, considering three different thicknesses (4–8–12 cm).
In Table 20, the comparison of the improvement percentage in terms of envelope energy performance is presented, according to the kind of insulation and its thickness L, the climatic conditions, and the wall type that is investigated.
In general, it is possible to reach an average reduction, which accounts for 30–40 %, in comparison with the initial energy needs for the envelope, even with 4 cm of insulation. These values increase for the high-performance polyurethane, as it is expected, since it has a lower value of thermal conductivity.
It is apparent that for the wall 12, which presents the lowest value of thermal transmittance, the effect of the energy conservation measures is less significant than for 10 and 17 walls.
In particular, in Fig. 11, the percentage values for the wall types 12 and 17 are shown for the Hamburg climatic conditions. The differences related to the insulation types are negligible, except for the high-performance polyurethane, which is more effective than other materials. The main differences between the energy improvements are mainly related to the initial high thermal transmittance.

Results for 12 and 17 walls (Hamburg). WF = wooden fibreboard. MW = mineral wool. PS = Polystyrene. PU = Polyurethane
In fact, the energy refurbishment of low-performance buildings is more effective than in other cases. On the other hand, the less are the initial energy needs of the building, the more difficult is increasing the energy saving.
Abbreviations
- A f :
-
Internal floor area of the conditioned space (m2)
- EPgl :
-
Global energy performance index (EPH + EPw) [kWh/(m2 year)]
- EPH,env :
-
Energy performance index in the heating season for building envelope [kWh/(m2 year)]
- EPH :
-
Energy performance index in the heating season [kWh/(m2 year)]
- f a :
-
Decrement factor (–)
- L :
-
Thickness (cm)
- M s :
-
Specific mass (kg/m2)
- Q H,gn :
-
Total heat gains for the heating mode (MJ)
- Q H,ht :
-
Total heat transfer for the heating mode (MJ)
- Q H,nd :
-
Building energy need for continuous heating (MJ)
- Q int :
-
Sum of internal heat gains (MJ)
- Q l,e :
-
Emission subsystem thermal losses (MJ)
- Q sol :
-
Sum of solar heat gains over the given period (MJ)
- Q tr :
-
Total heat transfer by transmission (MJ)
- Q ve :
-
Total heat transfer by ventilation (MJ)
- R :
-
Thermal resistance (m2K/W)
- S:
-
Time shift (h)
- U :
-
Thermal transmittance [W/(m2 K)]
- Y ie :
-
Dynamic thermal transmittance [W/(m2K)]
- ϕ int :
-
Heat gains from internal heat sources (W)
- η e :
-
Emission subsystem efficiency (–)
- η H,gn :
-
Gain utilization factor (–)
- \( \eta_{y\lambda } \) :
-
Heating system global efficiency (–)
- ρ:
-
Density (kg/m3)
- c :
-
Heat capacity [J/(kg K)]
- λ:
-
Thermal conductivity [W/(m K)]
- \( \upkappa_{\text{i}} \) :
-
Areal heat capacity [kJ/(m2 K)]
References
Corrado V, Ballarini I, Corgnati S, Talà N (2010) Use of building typologies for energy performance assessment of national building stocks, existent experiences in European countries and common approach, First TABULA Synthesis Report. Available from: http://www.building-typology.eu/existent-concepts.html
Magrini A, Magnani L, Pernetti R (2012) The effort to bring existing buildings towards the A class: a discussion on the application of calculation methodologies. Appl Energy 97:438–450
Magrini A, Magnani L, Pernetti R (2011) Analysis of the thermal control system incidence on the energy performance in building refurbishment strategies. 48° AiCARR international conference: energy refurbishment of existing buildings: which solutions for an integrated system, envelope, plant, control. Baveno, 22–23 September 2011
European Project EPISCOPE (2013–2016) Energy performance indicator tracking schemes for the continuous optimisation of refurbishment processes in European housing stocks
European Project Cost C16 (2003–2007) Improving the quality of existing urban building envelopes
European Project INVESTIMMO (2001–2004) A decision-making tool for long-term efficient investment strategies in housing maintenance and refurbishment
Magrini A (2013) Soluzioni per l’isolamento termico di edifici esistenti. Esempi di analisi termica e verifica igrometrica delle pareti (Thermal insulation of existing buildings. Examples of thermal analysis and hygrometric assessment of walls). EPC Editore, Rome
Reference Standards
CEN: Hygrothermal performance of building components and building elements: internal surface temperature to avoid critical surface humidity and interstitial condensation—calculation methods, EN ISO 13788:2013, European Committee for Standardization
CEN: Building materials and products: hygrothermal properties, Tabulated design values and procedures for determining declared and design thermal values, EN ISO 10456: 2008, European Committee for Standardization
CEN: Building components and building elements—Thermal resistance and thermal transmittance, EN ISO 6946: 2008, European Committee for Standardization
CEN: Energy performance of buildings—calculation of energy use for space heating and cooling, EN ISO 13790:2008, European Committee for Standardization
CEN: Thermal bridges in building construction—heat flows and surface temperatures—detailed calculations. EN ISO 10211: 2008, European Committee for Standardization
CEN: Thermal performance of building components—dynamic thermal characteristics—calculation methods, EN ISO 13786:2008, European Committee for Standardization
European Union: Directive 2002/91/EC of the European Parliament and of the Council of December 16th, 2002 on the energy performance of buildings. Official Journal of the European Communities, 4 January 2003
European Union: Directive 2010/31/EU of the European Parliament and of the Council of May 19th, 2010 on the energy performance of buildings (recast). Official Journal of the European Union, 18 June 2010
Author information
Authors and Affiliations
Corresponding author
Editor information
Editors and Affiliations
Rights and permissions
Copyright information
© 2014 Springer International Publishing Switzerland
About this chapter
Cite this chapter
Magrini, A., Magnani, L., Pernetti, R. (2014). Opaque Building Envelope. In: Magrini, A. (eds) Building Refurbishment for Energy Performance. Green Energy and Technology. Springer, Cham. https://doi.org/10.1007/978-3-319-03074-6_1
Download citation
DOI: https://doi.org/10.1007/978-3-319-03074-6_1
Published:
Publisher Name: Springer, Cham
Print ISBN: 978-3-319-03073-9
Online ISBN: 978-3-319-03074-6
eBook Packages: EnergyEnergy (R0)