
Abstract
This chapter covers changes related to the optic disc and abnormalities in various ocular conditions. This chapter is divided into the following sections. (1) Glaucoma, the most important section of this chapter, describes different changes that can be detected in glaucoma and important considerations in the interpretation of the retinal nerve fiber layer (RNFL) thickness profile. OCT can assess glaucoma using parameters: (a) peripapillary RNFL (retinal nerve fiber layer) parameters, (b) optic nerve head parameters, (c) macular parameters. Pitfalls and artifacts in image acquisition and interpretation are fully discussed. (2) The myelinated nerve fiber layer in the optic disc area and other parts of the retina. In OCT, because the myelinated sheet of nerves can reflect light almost completely, we always have a highly reflective surface with strong shadowing of the underlying tissue. (3) The optic pit and its secondary retinoschisis. OCT in optic pit maculopathy demonstrates a combination of outer retinal layer detachment and retinoschisis in most cases. (4) Anterior ischemic optic neuropathy (AION). In early-stage AION, OCT shows a considerable increase in RNFL thickness that converts to a plateau and then atrophies in 6 months. (5) Optic disc drusen, which is a progressive disease; most cases lose the RNFL and show visual field defects in perimetry. “Lumpy-bumpy” internal reflectivity on OCT images strongly suggests drusen. (6) OCT in neurologic disease that covers new OCT findings in MS (multiple sclerosis), NMO (neuromyelitis optica), papillitis, papilledema, and intracranial lesion or tumor, and their effects on the retinal layer will completely be explained with other complementary tests and tips for differentiation between papilledema and papillitis.
Access provided by Autonomous University of Puebla. Download chapter PDF
Keywords
- Retinal nerve fiber layer
- Multiple sclerosis
- Glaucoma
- Papillitis
- Papilledema
- Optic disc drusen
- Optic pit
- Neuromyelitis optica
6.1 Glaucoma
Glaucoma is the main cause of irreversible blindness worldwide. Intraocular pressure is the only modifiable risk factor. Early detection of glaucoma is vital for the preservation of vision because damages will be permanent if they occur. Usually, structural damages occur before the functional loss (pre-perimetric glaucoma). So, screening the suspected individuals with OCT can be a valuable option.
Spectral-domain optical coherence tomography (SD-OCT) is the most utilized test and many studies have assessed the accuracy and reproducibility of OCT in different commercial platforms. Most confounding factors perhaps lie in the variation of normal ocular structures that overlaps with glaucomatous changes.
The following parameters can be assessed by OCT [1]:
-
1.
Peripapillary retinal nerve fiber layer (Figs. 6.1, 6.2, 6.3, 6.4 and 6.5)
Fig. 6.1 
Normal peripapillary nerve fiber layer. It is a circular, cross-sectional OCT with about 3.5 mm diameter that starts from the temporal area (1, Tem) and turns around counterclockwise in the left eye (clockwise direction on the right side) and passes through points 2 (Suptem), 3 (Nas), 4 (Inftem) and finally ends in the first point, 5 (Tem) again. Because of the shape of optic nerve radiation, we have two areas of most thickness in the superotemporal area (Suptem) and inferotemporal (Inftem) making this shape like a “double hump” pattern. The inferior chart shows a green area that most normal people (95%) should be placed in that area, with less than 5% in yellow and less than 1% in the red area. This chart is based on normative data of individual OCT apparatus and may vary according to the OCT system that is used. OCT optical coherence tomography
Fig. 6.2 
This is a printout of a peripapillary nerve fiber layer of a normal person by Spectralis (Heidelberg Engineering, Heidelberg, Germany). All the fields are normal with green color
Fig. 6.3 
This is another printout of peripapillary nerve fiber layer OCT of a normal person with a large optic disc cup by Cirrus HD-OCT (Carl Zeiss Meditec, Dublin, CA). OCT optical coherence tomography
Fig. 6.4 
RNFL thickness profile of a patient with advanced glaucoma. Sever RNFL atrophy and disappearance of double hump pattern are notable. RNFL retinal nerve fiber layer
Fig. 6.5 
The circular pattern OCT image reveals multiple indentations of the nerve fiber layer, which is detected by the retinal vascular apparatus and shows concavity between them (black arrowheads). This finding indicates nerve fiber layer damage mostly due to glaucomatous optic neuropathy. Changes are most prominent in the inferior part. In the lower-left part of the figure, the retinal nerve fiber layer thickness curve shows a lower amount of mean nerve fiber layer thickness. OCT optical coherence tomography
-
2.
Optic nerve head (Fig. 6.6)
Fig. 6.6 
Print out of the ONH in s normal person. The green arrow in each OCT image represents the MRW that is extended from BMO to ILM. At the bottom, the left chart represents the normal MRW measurement, and the normal value should be placed in the green area. The right chart is the RNFL thickness curve as well. ONH, optic nerve head. OCT, optical coherence tomography. MRW, minimum rim width. BMO, Bruch’s membrane opening. ILM, internal limiting membrane. ONH Optic nerve head
-
3.
Macula (Figs. 6.7, 6.8, 6.9, 6.10, 6.11, 6.12 and 6.13).
Fig. 6.7 
The topographic map is from the patient in Fig. 6.5 and shows mild to moderate macular atrophy, especially in parafoveal areas. This is another OCT finding (i.e., macular parameter) that is usually associated with glaucomatous optic nerve damage. OCT optical coherence tomography
Fig. 6.8 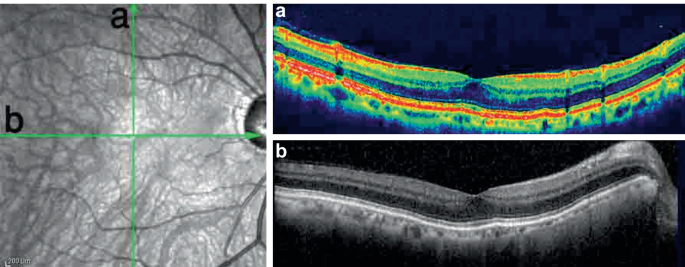
The a vertical and b horizontal cross-sectional OCT images of the same patient show loss of the foveal curve and flattening of the macula due to loss of the innermost layer, which belongs to nerve fiber layers and ganglion cell layer. Foveal thickness is preserved because of the normal absence of ganglion cells and nerve fiber layer. OCT optical coherence tomography
Fig. 6.9 
This compound image shows the longitudinal cross-sectional OCT images from a patient with advanced glaucoma. The area under the white dashed lines illustrates ganglion cell complex loss at the juxtafoveal area. The topographic map shows generalized macular atrophy. The RNFL thickness profile shows considerable thinning. OCT optical coherence tomography RNFL retinal nerve fiber layer
Fig. 6.10 
Two serial retinal nerve fiber thickness profiles of a patient that were taken within 3.5 years of follow-up. The localized nerve fiber layer loss in the inferotemporal area (arrow) and more extensive loss in the nasal area (arrowheads) are detectable by OCT. OCT optical coherence tomography
Fig. 6.11 
The follow up topographic map in the same patient in Fig. 6.21 illustrates decreased macular thickness (arrow) in the inferotemporal area in the retinal thickness change map
Fig. 6.12 
The SLO-OCT image from a patient with glaucoma and localized nerve fiber layer loss (area between the arrows). SLO-OCT scanning laser ophthalmoscopy optical coherence tomography
Fig. 6.13 
Topographic retinal thickness map of the same patient in Fig. 6.12. Inferior macular thinning is secondary to atrophy of the ganglion cell complex


Average RNFL thickness is between 91 and 117 μm in various studies with various OCT apparatus [2,3,4,5,6,7,8,9,10]. Interocular symmetry is also important and means RNFL differences of more than 8.8 microns are highly suggestive ofabnormal conditions [11]. Thinning of RNFL is the hallmark of glaucoma. (Fig. 6.4).
The value of these tests has been evaluated by area under the curve (AUC), which is a measure of how well a parameter can distinguish between diseased and healthy groups. As the AUC value approaches 1, the power of a test for discriminating normal from abnormal increases.
In OCT, indentations (Fig. 6.5) maybe the sign of early damage, even if the mean thickness is in the normal range. Shin et al. [12, 13] described that RNFL volume deviation (i.e., estimated lost RNFL) has higher sensitivity, specificity, and AUC—compared to average RNFL thickness—for the early detection of glaucoma. Liu et al. [14] proved that nerve fiber layer loss in the contralateral normal eye (assessed by visual field and optic disc photography) of glaucomatous patients suggests that OCT is more sensitive than other methods for detecting early glaucoma.
Optic nerve head (ONH) parameters include rim area (RA), cup volume (CV), disc area (DA), average cup disc ratio (ACDR), and vertical cup disc ratio (VCDR). All these variables could be provided by Cirrus HD-OCT 5000. In Spectralis (Heidelberg Engineering, Heidelberg, Germany) different variables could be defined such as MRW (minimum rim width) that extends from BMO (Bruch’s membrane opening to the ILM (internal limiting membrane. (Fig. 6.6) the green arrow represents the MRW extending from the Bruch's membrane opening (BMO) to the ILM (middle panel).
Pitfalls in Using the Retinal Nerve Fiber Layer Profile
Similar to other imaging in medicine, RNFL thickness profile and other related image modalities have some pitfalls that we should always keep in our mind when we want to read these images (Figs. 6.14, 6.15, 6.16, 6.17, 6.18, 6.19, 6.20 and 6.21).

The retinal nerve fiber layer profile shows a double-hump pattern on the OCT image. This pattern depends on the location, splitting, and thickness of nerve fiber radiation and the direction of withdrawal from the optic nerve head. a A normal nerve fiber layer thickness profile erroneously shows an abnormal pattern because of the larger distance of optic radiation (green arrowheads) from the optic disc because of the variation in the vascular distribution. b After adjusting the circle to the nasal side, it is possible to obtain a normal thickness profile map. This can also occur with abnormal optic discs such as a tilted optic disc, a posterior staphyloma around the peripapillary area, and other peripapillary deformities. OCT optical coherence tomography

The quality of OCT affects the nerve fiber layer thickness profile results. a An abnormal curve due to a poor-quality image with a considerable signal-to-noise ratio. b A normal curve with a high-quality image of the same patient and at the same location. OCT optical coherence tomography

An epiretinal membrane in the peripapillary area can affect the nerve fiber layer thickness profile. a The epiretinal membrane and retinal surface wrinkling result in a misidentification artifact and indicate a normal thickness pattern (Green Disease). b After manual correction in the temporal area (arrows), considerable temporal nerve fiber layer thinning is detected

The Spectralis OCT images output in some devices results from meaning multiple scans. In the retinal nerve fiber layer thickness profile evaluation, meaning results in an erroneously thicker layer. a The mean of 15 images create a near normal thickness profile. b The image is constructed from nine images; however, the mean thickness is thinner and abnormal. In such instances, images with a lower meaning rate may be more reliable. OCT optical coherence tomography

These two follow up OCT images show the progression of mild diabetic macular edema in the left eye of a patient with previously established glaucoma. OCT optical coherence tomography

The follow-up topographic maps in the same patient in Fig. 6.18 indicate thickening of the macula. The thickness change map shows a diffuse red color

Nerve fiber layer thickness in the peripapillary area in the same patient in Fig. 6.18 shows thickening (lower image) that is the result of edema

RNFL thickness profile comparison in the same patient in Fig. 6.18 before and after macular thickening and edema. The top profile shows thinning and borderline thickness. The lower profile shows a normal RNFL thickness profile—after macular thickening and edema, and considerable nerve fiber layer thickening have occurred
Many studies that mostly measured the optic disc parameters and peripapillary nerve fiber with Cirrus reported high AUC values [15]. A review study by Michelessi et al. [16], evaluated 106 studies, on the diagnostic ability of optic nerve head imaging by OCT, Heidelberg retina tomography (HRT), glaucoma diagnosis (GDx) scanning, and nerve fiber layer thickness measurements for glaucoma, the investigators concluded that using these modalities solely may be insufficient for detecting and monitoring glaucoma because of the overestimation of accuracy of each test and these tests have nearly the same amount of accuracy. Therefore, we strongly advise that clinicians should not rely solely on these tests for glaucoma detection and should perform further evaluations such as perimetry. Other tests should also be considered and suspected cases of glaucoma should be followed carefully and closely to avoid missing early glaucoma.
Glaucoma OCT Masquerading Etiologies
Some diseases could create NFL changes resembling glaucoma. The most common is an old retinal vascular obstruction. Inner layer chronic ischemia after vascular obstruction results in inner layer atrophy, including the NFL, that can cause changes similar to glaucoma. Anterior ischemic neuropathy (AION) is another etiology that can also cause NFL atrophy. Heavy retinal peripheral laser treatment (e.g., panretinal photocoagulation in diabetes) also may result in a thin NFL. Compressive lesions in the brain such as brain tumors, multiple sclerosis, chronic resolving papillitis, or papilledema can all result in an NFL thickness pattern that is similar to glaucoma.
6.2 Myelinated Nerve Fiber Layer
Myelinated retinal nerve fiber layer (MRNFL) is the presence of a myelinated sheet around the axons of the retinal ganglion cells beyond the lamina cribrosa. It has a gray to white appearance with feathery borders. In ophthalmoscopy, a MRNFL appears as a white discrete lesion with frayed borders. In the peripheral part, they appear feather-like. The prevalence of this abnormality is between 0.57 and 1% of the normal population [17,18,19]; it is bilateral in 7.7% of cases [17].
Most (66%) of the time, it is not continuous with the optic nerve head (mostly in the inferotemporal area). However, in 33% of cases, it ends at the optic nerve head (mostly the superior part) [17, 18]. Myelinated retinal nerve fiber layer is usually an incidental finding that is discovered during an eye examination with normal acuity. However, it sometimes can be a part of a syndrome that includes high myopia, amblyopia, and MRNFL [19]. The MRNFL lesion is static during a person’s lifetime and rarely changes.
In OCT, MRNFL always has a high reflective surface and causes strong shadowing on underlying tissues because the myelinated sheet of the nerve can reflect light almost completely (Figs. 6.22, 6.23, 6.24 and 6.25). If this lesion is adjacent to the optic nerve head, some cyst-like spaces can be found superficially on the myelinated area.

This is a color optic disc photograph and fundus autofluorescence (FAF) view of a myelinated optic disc of a 68-year-old patient with corrected distance visual acuity of 20/30. Hyporeflectivity in the FAF image is because of the barrier effect of the myelin on RPE lipofuscin. In OCT images, intense reflectivity with strong shadowing on outer structures is significant. Small superficial cyst-like spaces sometimes can be found in this condition (arrows). OCT optical coherence tomography RPE retinal pigment epithelium

The vertical (a) and horizontal (b) cross-sectional OCT images show the elevated hyperreflective optic disc inner parts. Differentiating a myelinated nerve fiber layer from papilledema and papillitis may be difficult in some cases. Multiple cystic spaces are also a sign associated with this anomaly. OCT optical coherence tomography

The horizontal OCT section crossed at the site of the myelinated nerve fiber layer in a different patient. Hyporeflective spaces, which may be small cystic spaces, are in the middle part of the lesion (arrows). OCT optical coherence tomography

a Fundus autofluorescence (FAF) and OCT images of a myelinated nerve fiber layer in the inferotemporal region of the macula (the usual location for such abnormalities). It results in hyporeflectivity on the FAF image and hyperreflectivity of the nerve fiber layer on the OCT image (black arrows). Some parts of the foveal area is also visible (black arrowhead). b In the SLO image, the myelinated nerve fiber layer is characterized by a hyperreflective feathery patch (between the white arrows). OCT optical coherence tomography SLO scanning laser ophthalmoscopy
Visual field defects and decreased vision are also associated with this condition [20]. Red-free and infrared images will show the lesions with a white appearance because of the high lipid content of the affected area. In autofluorescence, a deep dark area can be found that is related to blockage of the detection of lipofuscin by the lipid layer over it [21].
6.3 Optic Pit
Optic pit anomaly, morning glory disc anomaly, and optic disc coloboma are among the different appearances of congenital optic disc closure anomalies [22]. Defect in the lamina cribrosa with herniation of the abnormal retina and connection to the subarachnoid space is the main etiology [23]. The incidence of an optic pit is 1/11000 [24]. There are no gender preferences in this condition and 15% of cases are affected bilaterally [25]. This is a sporadic anomaly but can run in families.
In ophthalmoscopy, it appears as a gray, oval, hole-shaped depression more often in the inferotemporal part of the optic disc [24, 26] (Figs. 6.26, 6.27, 6.28, 6.29, 6.30, 6.31, 6.32, 6.33, 6.34, 6.35, 6.36, 6.37, 6.38, 6.39 and 6.40). The optic pit may be asymptomatic and discovered during a routine ophthalmology examination or may be associated with a visual field defect, an enlarged blind spot, or paracentral arcuate scotoma [27, 28]. However, 25–75% of patients with optic disc pit eventually experience maculopathy in their third and fourth decade of life [25, 27, 29, 30].

Color fundus photographs from a 40-year-old woman with a recent history of decreased vision in her right eye, beginning a few months ago. In the right eye, the temporal side of the optic disc has a round depressed lesion (black arrow), which is a small optic pit

This SLO-OCT is from the same patient in Fig. 6.26. The hyporeflective elevated area at the center of the macula indicates macular elevation. In the cross-sectional OCT, dome-shaped macular and foveal detachment exists, which corresponds to retinal schitic spaces and subretinal fluid. The vertical columns, which are at the boundaries of the outer nuclear layer and outer plexiform layer, are the typical pattern of schisis due to an optic pit. The pathway (white arrow) that connects the intraretinal space to the subretinal space (outer layer hole) is usually visible on OCT images. OCT optical coherence tomography SLO scanning laser ophthalmoscopy

In another horizontal section, through the optic pit, the site of the optic pit is visible (white arrow). Outer retinal layer schisis with vertical columns and subretinal spaces are also evident

One section vertically crosses the optic pit, using the EDI-OCT method. Section a reveals another area in which the inner retinal spaces connect to subretinal space. Section b shows the path of the optic pit. The outermost part of the pit and its base are not discerned by OCT. EDI-OCT enhanced depth imaging optical coherence tomography

These images show the vertical direction of the optic pit pathway (arrow)

These two cross-sectional EDI-OCT scans, which cross through an optic pit, illustrate the depth and anatomy of the pit. In conventional OCT, the direction of the pit is not completely visible. Serous detachment and visual disturbances are absent. EDI-OCT enhanced depth imaging optical coherence tomography

A large optic pit without retinal fluid accumulation. These two cross-sectional EDI-OCT images show the diameter of the pit but do not define its endpoint. EDI-OCT enhanced depth imaging optical coherence tomography

This image shows a 28-year-old man with recently decreased vision in his left eye. This compound picture of the cross-sectional horizontal OCT and fundus autofluorescence show schisis with column bridges in the retina which are more severe at the fovea. In FAF, the cart-wheel pattern shows the retinal schisis more clearly. FAF fundus autofluorescence, OCT optical coherence tomography

In another view of the same patient in Fig. 6.33, section a, which traverses the optic pit, reveals a narrow long canal (white arrows) at the deep part of the optic pit. Section b demonstrates the exact location of the schisis, which is at the boundary of the outer nuclear layer and outer plexiform layer

The SLO-OCT image shows the remnants of the intraretinal walls with an apparent optic disc pit in the temporal margin of the optic disc. SLO-OCT scanning laser ophthalmoscopy optical coherence tomography

The depth of the lesion with undetermined ends and adjacent serous retinal detachment leads to a diagnosis of optic pits (arrow)

Color fundus photographs and SLO-OCT images of a patient with optic pit-related foveoschisis. Schisis exists in most layers containing the internal limiting membrane (arrowheads) and the outer nuclear layer (arrows). Extension of serous fluid into retinal tissue at the foveal area results in a large foveal cyst (asterisk). Large subfoveal serous detachment is also visible. SLO-OCT scanning laser ophthalmoscopy optical coherence tomography

The color fundus photograph, autofluorescence, and OCT images from a patient with optic disc pit and serous macular detachment. This type of detachment could be mistaken for chronic active central serous chorioretinopathy, especially when there are hyperfluorescent dots in a FAF image. The main feature of detachment in an optic pit is the presence of a schisis, even in a small area (in this patient, mostly near optic disc territory, arrow). FAF fundus autofluorescence, OCT optical coherence tomography

Optic pits usually are associated with other anomalies such as retinochoroidal coloboma, as shown in this patient. The optic pit may be accompanied by other retinal abnormalities such as an inferior retinal coloboma, which is demonstrated in this figure. The small strand of retinal layer columns is connected to the posterior part of the retina

Multiple patterns of retinal schisis and detachment in an optic disc pit maculopathy. a A small area of schisis at the nasal side of the fovea can help in differentiating it from serous detachment secondary to active central serous chorioretinopathy. b The existence of an optic pit with regular schitic spaces in the macular area that is predominantly limited to the outer nuclear layer-outer plexiform layer interface could help in differentiating it from severe longstanding cystoid macular edema. c Schitic spaces at the inner part of the retina with a large central foveal cyst that is connected to the subfoveal serous detachment and the existence of an optic pit differentiate it from severe cystoid macular edema
There is no known predisposing factor for the initiation of maculopathy, except possibly posterior vitreous detachment [22, 24, 31]. Maculopathy is associated with intraretinal and subretinal fluid accumulation with vision equal to or less than 20/70 [24].
Optical coherence tomography (OCT) imaging in optic pit maculopathy demonstrates a combination of retinal detachment and retinoschisis in 79.17% of cases (Figs. 6.27, 6.28 and 6.29), only retinal detachment in 12.5% of cases, and only retinoschisis in 8.33% of cases (Figs. 6.33 and 6.34) [32]. An outer layer hole (between schisis and serous detachment) occurs in approximately 73% of cases with maculopathy. Schisis often involves multiple layers [32] (Figs. 6.35, 6.36, 6.37, 6.38, 6.39 and 6.40).
In some patients, the inner layers dissolve and are lost because of longstanding disease, and only small strands remain. It appears as a posterior retinal detachment, similar to the pattern that occurs in pathologic myopia. However, the existence of such strands could help in the differentiation.
6.4 Anterior Ischemic Optic Neuropathy
Anterior ischemic optic neuropathy is the result of complete or partial impairment of optic nerve head perfusion. In AION, early-stage OCT imaging shows a considerable increase in the NFL thickness, which then converts to a plateau, and finally atrophies in 6 months [33]. The NFL loss is very similar to that of glaucoma and sometimes it is very difficult to differentiate it from glaucoma. However, in non-arteritic AION (NAION) ganglion cell inner plexiform layer (GCIPL) is significantly thinner, compared to a glaucomatous patient (Figs. 6.41, 6.42, 6.43, 6.44, 6.45, 6.46 and 6.47) [34].

This compound image shows a male patient with a 15-year history of diabetes mellitus who experienced a sudden decreased vision in his left eye. White edema at the inferotemporal border of the optic disc with a flame-shaped hemorrhage and blurring of the optic disc margin are visible. In the recirculation phase of fluorescein angiography, leakage and hyperfluorescence of this area are evident. The SLO images show it as a hyporeflective area. The OCT image shows sectoral elevation and thickening of the nerve fiber layer band (area between the arrowheads). OCT optical coherence tomography SLO scanning laser ophthalmoscopy

The color fundus photograph and the fluorescein angiography are from a 56-year-old man with a sudden loss of vision about 6 months ago. He was diagnosed as having AION with partial improvement of his vision during this period. In fluorescein angiography, impaired circulation of the superior part of the optic disc is notable. AION anterior ischemic neuropathy

Fluorescein angiography images (the same patient in Fig. 6.42) obtained 48 s and 4 min and 58 s after dye injection. The perfusion of the superior part of the optic disc is absent, even in the recirculation phase

The macular topographic map (the same patient in Fig. 6.42) demonstrates superior atrophy and thinning. The RNFL OCT also shows considerable thinning of the nerve fiber layer. Such OCT findings also occur in longstanding branch retinal vein occlusion

Vertical cross-sectional OCT images (the same patient in Fig. 6.42) show superior macular atrophy, which is primarily caused by loss of the inner layers, especially the ganglion cell complex. OCT optical coherence tomography

Retinal nerve fiber layer thickness curve (the same patient in Fig. 6.32) is out of the normal limit in the upper image. The double-humped pattern structure is impaired by the loss of the superior fibers

Two horizontal cross-sectional OCT images (the same patient in Fig. 6.42) were taken from two sides at equal distances from the central fovea. Section a (upper image) shows atrophy and loss of the nerve fiber layer and the ganglion cell layer with inner plexiform layer in comparison to section b between the arrows area. OCT optical coherence tomography
In NAION, focal loss volume (FLV) and global loss volume (GLV) of the ganglion cell layer in the macula are significant. These findings have a good reproducibility for detecting ganglion cell loss in cases of NAION [35]. Schuster et al. [36] showed that macular choroidal thickness in both eyes of individuals affected with unilateral NAION is significantly lower than in normal individuals.
6.5 Optic Disc Drusen
Optic disc drusen or optic nerve head drusen (ONHD) may be caused by the accumulation of mucoprotein and mucopolysaccharides in the optic disc with progressive calcification. They are a benign congenital anomaly of the optic disc [37, 38]. The incidence of ONHD is 2.4% with 13% of cases occurring bilaterality [37] with an autosomal dominant inheritance pattern [39]. This finding may result from abnormal axonal metabolism that eventually leads to intracellular mitochondrial calcification [40]. With aging and atrophy of the axons overlying the drusen, they become more visible in an eye examination [41]. Optic nerve head drusen is a progressive disease and most patients lose the NFL and show visual field defects in the perimetry. Buried disc drusen can sometimes be difficult to differentiate from papilledema. In such cases, OCT can be helpful. Internal reflectivity that appears “lumpy-bumpy” on OCT images strongly suggests drusen; by contrast, the inner part of elevated papilledema is a smooth hyporeflective space [42]. Increased subretinal hyporeflective space (SHYPS) measurements along the RNFL thickness curve can also help differentiate between these two conditions; papilledema has a considerable increase [42]. Transient deflection of the peripapillary RPE also can be seen in intracranial pressure rise and may also be a good differentiating sign [43, 44].
Fundus autofluorescence (FAF) imaging is another modality that can help in diagnosing ONHD (Figs. 6.48, 6.49, 6.50 and 6.51). Hyperautofluorescence of the optic disc is diagnostic for ONHD, whereas papilledema will have increased papillary hypoautofluorescent areas. B-scan ultrasonography is the best method for differentiating and diagnosing buried drusen [45, 46].

The color fundus photograph, FAF, and fluorescein angiography images of optic disc drusen 10 min after dye injection. A white feather-like pseudoedema and elevation of the optic disc are evident in the color fundus image. The absence of an engorged retinal vascular plexus and hemorrhage can differentiate it from papilledema or papillitis. In the FAF image, hyperautofluorescent areas at the optic disc (white arrows) strongly suggest drusenoid material accumulation at the optic disc. The absence of leakage at the late stage of fluorescein angiography could be another sign used to differentiate it from inflammation or papilledema. FAF fundus autofluorescence

The multiple OCT sections (a–f) are from different parts of the optic disc drusen. The white arrowheads delineate the outer boundary of hyperreflective material that accumulate in the optic disc area as drusen. OCT optical coherence tomography

These compound images are from a patient with nerve fiber layer loss secondary to glaucoma. The color fundus photographs show lobulated glistening pearls at the level of the optic disc. Fundus autofluorescence images show hyperfluorescence of the optic disc, which is a hallmark sign of optic disc drusen. The SLO-OCT images show medium reflective material with internal hypocenters in the deep part of the peripapillary retina (delineated by the black arrows). SLO-OCT scanning laser ophthalmoscopy optical coherence tomography

The retinal nerve fiber layer thickness profiles of the patient in Fig. 6.50 shows attenuation and atrophy of the nerve fiber layer
6.6 OCT in Neurologic Disease
There are many recent studies about the role of OCT in the diagnosis, management, and monitoring of the treatment of patients with neurologic diseases. OCT clearly illustrates the nerve fiber layer without a myelin sheet and perhaps can provide a crystal clear sample of brain nerve fiber condition, therefore we can use it as a biomarker in diagnosing and treating neurodegenerative disease. Besides its value for diagnosis and management of neurological disease OCT is a noninvasive, noncontact, fast, safe, and reproducible imaging tool that provides information on neural tissue in vivo that reflects the condition of neuronal tissue in the brain.
How a neurologist could use and read OCT: The basics and retinal anatomy were discussed widely in the introduction section, but the most important parts of concern for neurologists are the macular area and retinal nerve fiber layer profile.
Multiple sclerosis (MS):
Optical coherence tomography has given greater comprehensions into the pathophysiology of MS. It is quick, non-invasive, and easy to use. The images are highly reproducible with high resolution. Evaluation of the RNFL and GCL using OCT hypothetically allows us to assess neuronal and axonal degeneration. OCT act as a window through that we can see central nervous system axonal health without a myelin sheet. OCT has established very practical concerns for research, predicting disability, and disease monitoring in MS. 90% of MS patients even who have not experienced optic neuritis (ON), will most likely also have lesions in their visual pathways [47, 48].
Recent studies are proved that RNFL and GCIPL thinning correlates with parameters such as biomarkers, visual disability, function, and MRI (magnetic resonance imaging) in MS. OCT parameters may also be able to calculate disability progress and visual function in MS.
The pathological mechanism of reduction of RNFL and ganglion cell and inner plexiform layer (GCIPL) thickness in MS patients despite a negative or positive history of prior ON is still in debate. Axonal retrograde degenerations in patients with the history of ON could explain the RNFL and GCIPL thinning (Figs. 6.52, 6.53, 6.54, 6.55, 6.56, 6.57 and 6.58). However, in MS patients without any history of ON about 6.73 μm reduction in RNFL and GCIPL have been reported [49].

Retinal topographic map of both eyes of a patient with proven MS and history of optic neuritis in the left side. Considerable thinning of the left side is remarkable. MS Multiple sclerosis

The cross-sectional macular SLO-OCT images of the same patient in Fig. 6.52 clearly show loss of GCIPL in the perifoveal area (white arrowheads). OCT optical coherence tomography SLO scanning laser ophthalmoscopy

RNFL cross-sectional SLO-OCT of both eyes in the patient in Fig. 6.52. Above image belongs to the right side and the bottom to the left side. Considerable RNFL atrophy is prominent on the left side (white arrowheads). RNFL retinal nerve fiber layer. OCT optical coherence tomography SLO scanning laser ophthalmoscopy

Ganglion layer map of both eyes of the patient in Fig. 6.52 illustrates bilateral asymmetry and severe GCL atrophy of the left side, which is the hallmark of MS patients. GCL ganglion cell layer MS multiple sclerosis

Compound images of retinal topographic maps (above), GCL maps (middle), and cross-sectional SLO-OCT of the macula (bottom) of both eyes of a patient with chronic MS and multiple attacks of ON with normal visual acuity. Despite normal visual acuity, there are considerable thinning and atrophy of macula and GCL map in both eyes. OCT optical coherence tomography SLO scanning laser ophthalmoscopy GCL ganglion cell complex ON optic neuritis MS multiple sclerosis

RNFL thickness profiles of both eyes of the same patient from Fig. 6.56 show bilateral abnormal temporal quadrant thinning, which is characteristic of MS NFL loss. RNFL retinal nerve fiber layer. MS multiple sclerosis

Bilateral perimetry 30-2 of the same patient from Fig. 6.56. Despite the abnormal macular volume, GCL and RNFL atrophy perimetry are unremarkable. This shows the importance and sensitivity of OCT in MS patients. RNFL retinal nerve fiber layer. MS multiple sclerosis OCT optical coherence tomography GCL ganglion cell complex
With the evaluation of inter-eye percentage difference (IEPD), using OCT we can also differentiate MS patients from healthy controls [50]. The diagnostic accuracy of the IEPD (AUC) is 0.75–0.94 for the GCIPL and 0.73–0.86 for the RNFL with the diagnostic specificity of 97% of the GCIPL IEPD and sensitivity of 70% for discriminating healthy controls from MS with unilateral ON. The IEDP has possible to be a very useful paraclinical parameter because it is not affected using different devices, segmentation algorithms, intrapersonal factors, ethnicity, and physiological variability.
Neuromyelitis optica (NMO):
Neuromyelitis optica spectrum disorders (NMOSD) are relapsing autoimmune central nervous system (CNS) inflammatory conditions [51]. Longitudinally extensive transverse myelitis (LETM), optic neuritis (ON), and brain stem encephalitis are clinical hallmarks of this disease [52,53,54,55,56]. Depression [57], neuropathic pain [56] and fatigue [58] are important symptoms, Aquaporin-4 (AQP4-ab), a serum autoantibody against the astrocytic water channel is measurable in almost 80% of the patients [59,60,61,62]. NMOSD has different immunopathogenesis from MS, which powerfully determines both of these conditions as unattached neurologic entities [63,64,65] with different treatment modalities.
In 55% of the patient with NMOD, ON is the first clinical feature that usually results in severe structural destruction to the optic nerve and retina [66]. The disease pattern is bilateral, occasionally simultaneous ON, recurrent relapses, and severely disturbed visual acuity or even complete vision loss [66]. The disease progresses as subacute visual loss in days or weeks, with possible recovery in half a year [67, 68].
In the acute phase, OCT shows a highly swollen RNFL and near normal or mild thickening of GCIPL that are due to inflammatory processes. After the acute phase, the loss of retinal axons and ganglion cells happens over an era of 6 months [69, 70]. In NMOSD the optic nerve is frequently involved near the chiasm, therefore it can have an impact on the contralateral optic nerve even after a unilateral attack (Figs. 6.59, 6.60, 6.61, 6.62, 6.63 and 6.64).

SLO images of a young 35 years old female with a sudden decrease of right eye vision a week ago and RAPD. Optic nerve head and perivascular edemaedema are evident on the right side. The left side seems to be normal. SLO scanning laser ophthalmoscopy RAPD relative afferent pupillary defect

SLO-OCT image of the right side of the same patient in Fig. 6.59. Above is a peripapillary RNFL SLO-OCT image, that illustrates severe nerve fiber layer thickening with mild vitreous inflammation. Bottom is macular OCT which shows a fine epiretinal membrane and vitreous floating hyperreflective dots that represent vitritis. OCT optical coherence tomography SLO scanning laser ophthalmoscopy RNFL retinal nerve fiber layer

Fluorescein angiography of the same patient in Fig. 6.59 shows severe papillary and peripapillary and peripheral vascular leakage on the right side and a small amount of leakage at the deep part of the left optic nerve head

SLO images of both eyes on the second attack of left ON (the same patient on Fig. 6.59) show severe papilledema with the same pattern as the right eye and optic nerve atrophy with vascular narrowing at the right side. SLO scanning laser ophthalmoscopy. ON optic neuritis

SLO-OCT, RNFL images of both eyes of the same patient on Fig. 6.59, revealed severe optic nerve and RNFL atrophy (above image) on the right side as a sequel of the previous attack of ON and severe RNFL thickening (bottom image) due to recent left side ON. OCT optical coherence tomography SLO scanning laser ophthalmoscopy ON optic neuritis RNFL retinal nerve fiber layer

a SLO-OCT image of the left side during the acute attack of ON of the same patient in Fig. 6.59 illustrates blurred and elevated optic disk (green arrowheads) and sever perivascular edema (red arrows). b SLO-OCT images of the right side in chronic atrophic phase, reveals macular GCIPL atrophy and fine epiretinal membrane bridging over the foveal pit (white arrows). c GCL map of the right side on the chronic phase shows atrophy and thinning. d GCL map of the left side on acute phase shows normal even thicker than normal due to edema and inflammation. OCT optical coherence tomography SLO scanning laser ophthalmoscopy GCL ganglion cell complex ON optic neuritis
NMOSD often results in severe RNFL thinning, especially after recurrent attacks, with RNFL thickness less than 30 μm [71]. Due to flooring effects after severe optic atrophy, the further neuro-axonal loss is difficult to monitor.
In MS retinal and GCIPL damage show a temporal preponderance, while in NMOSD all areas can be affected equally [70, 72]. After ON attack, reduced RNFL and GCIPL thickness are highly correlated with contrast visual acuity disturbance. [73, 74].
After ON about 20% of patients show microcystic changes in the inner nuclear layer (INL). References [75,76,77,78] called microcystic macular edema (MME) (Fig. 6.65).

SLO-OCT image of a patient with MME clearly illustrates GCIPL atrophy with small slit-like hypo-reflective spaces (white arrows) at the level of INL (main location of Muller cells in the retina). OCT optical coherence tomography SLO scanning laser ophthalmoscopy GCIPL ganglion cell and inner nuclear layer MME microcystic macular edema
MME is related to severe and fast axonal loss conditions due to various etiologies and is not specific to NMOSD [76, 79, 80].
Mueller cells are astrocytic cells mainly located on INL and are responsible for energy metabolism, water homeostasis, and neurotransmitter recycling and maybe the targeting for Aquaporin-4 that results in primary retinopathy in NMOSD [81,82,83].
In NMOSD without ON we can have neuroaxonal damage but in a limited amount [84].
The patient in Figs. 6.59, 6.60 and 6.61 was not diagnosed as NMO and was treated with a high dose of oral steroids without any significant change in vision on the right side. After 2 months she referred us because of the drop in left side vision a few days before. Laboratory examination revealed AQP4-ab positive in serum and after neurologic consultation, NMOSD diagnosis was confirmed.
Papillitis and Papilledema
Papilledema defines as the thickening of the peripapillary nerve fiber layer due to increase intracranial pressure (Figs. 6.66, 6.67 and 6.68) or acute accelerated hypertension (Figs. 6.69, 6.70 and 6.71). Papillitis describes as the thickening of the peripapillary nerve fiber layer secondary to inflammation (Fig. 6.72). In some patients, differentiating papillitis from papilledema is very difficult because of their similar fundoscopic and OCT characteristics. Pseudo-papilledema defines as fundoscopic blurring and elevation of the optic disc without any pathology. Optic disc drusen and small optic disc and hyperopia could masquerade papilledema. By OCT we could differentiate pseudopapilledema from real papilledema. An increase in peripapillary RNFL thickness occurs in 43.3% of patients with papilledema versus 9.7% in patients with pseudopapilledema. Papilledema usually shows thicker NFL in all quadrants (Figs. 6.66 and 6.67) [42]. Nasal RNFL measurement had the highest diagnostic ability to differentiate papilledema from pseudopapilledema in one study [85]. Another factor is the measurement of the subretinal hyporeflective space (SHYPS) (Fig. 6.68) thickness, which is significantly greater in papilledema (Fig. 6.68) [42]. In the chronic phase of papilledema, sometimes there is only extreme thinning of the nerve fiber layer.

Fundus color images and late phase of fluorescein angiography of a patient with papilledema. Severe late leakage is evident. There is no evidence of peripheral retinal vasculitis and vascular leakage

The SLO-OCT images of both eyes of the same patient in Fig. 6.66. The rims and the central part of the optic disc are elevated. SLO-OCT scanning laser ophthalmoscopy optical coherence tomography

Color fundus, SLO-OCT images of a young female withhistory of headaches and transient blurring of vision since a few months ago. The blurring and elevation of the optic disk in both eyes are remarkable. There is a large hyporeflective space at the root of the optic disk (white arrowheads) (SHYPS) and a small number of hard exudates in the peripapillary area (white arrow) that confirm papilledema diagnosis. The patient was referred to a neurologist for further evaluation and it appeared that she had high intracranial pressure. OCT optical coherence tomography SLO scanning laser ophthalmoscopy

SLO-FA images of a middle-aged man referred us for subacute decreased vision with a severe headache. On SLO images a and c blurring of optic disk margin with an elevation that appears as hypo-reflectivity on SLO are remarkable. On FA b and d on the recirculation phase, severe optic disc leakage is notable which is characteristic of papilledema. SLO scanning laser ophthalmoscopy FA fluorescein angiography

SLO-OCT images of the same patient of Fig. 6.69 revealed severe peripapillary NFL thickening (arrowheads in a and c) more severe in the right side (a) and subfoveal serous detachment (asterisk) accompanied by peripapillary intraretinal fluid accumulation (white arrows in b and d). Subfoveal serous retinal detachment indicates the severity and acuteness of papilledema and is usually associated with hypertensive retinopathy. This patient was revealed to have severe hypertension. Neurologic consultation must be done for ruling out intracranial problems. NFL nerve fiber layer

SLO-OCT images of the same patient in Fig. 6.69 few weeks after blood pressure control and intraocular injection. a and b shows near-complete resolution of papilledema, peripapillary retinal edema and subfoveal serous detachment with residual nerve fiber layer thinning (white arrowheads), perifoveal GCIPL loss (red arrowheads) and hard exudates (white arrow). c and d shows the same changes with lesser extend in the left side. OCT optical coherence tomography SLO scanning laser ophthalmoscopy GCIPL ganglion cell and inner nuclear layer

a SLO-OCT, RNFL thickness profile of a patient with ocular pain and decreased vision. Thickening of RNFL is evident. Fundus examination also revealed blurring and edema of optic disk head. b and c FA of the same patient revealed severe vascular leakage and vasculitis that made the diagnosis of papillitis easier. OCT optical coherence tomography SLO scanning laser ophthalmoscopy RNFL retinal nerve fiber layer FA fluorescein angiography
Toxic/metabolic/drug-induced optic neuropathy:
Toxic optic neuropathy is a set of medical conditions which can be described by visual loss secondary to optic nerve damage by a toxin. It is mostly diagnosed in late stages when recovery is not possible. Exposure to toxic elements can happen in work environment, with ingestion of substances or foods comprising a toxin, or systemic medications.
Toxic optic neuropathy is characterized by reduced color vision, papillomacular bundle atrophy, and central or cecocentral scotoma.
It starts as an insidious painless, bilateral, progressive, symmetrical visual loss with variable optic disk pallor [86, 87]. Color vision disturbance or dyschromatopsia is regularly the first symptom. the loss of color vision is disproportionate to the decline in visual acuity [88]. The pattern of visual loss typically involves a central or paracentral field of vision and extends toward the periphery at the end stages. Common etiologies of toxic neuropathy are Methanol, Ethylene glycol (the most prevalent), Chloroquine family drugs, antibiotics such as Chloramphenicol, antitubercular drugs like Isoniazid, Ethambutol, antiarrhythmics like Digitals and Amiodarone, anticancer agents, like as Vincristine and Methotrexate and finally heavy metals such as Leads and Mercury.
We introduce a patient with Imatinib toxic neuropathy, a rare complication.
Imatinib is a 2-phenyl amino pyrimidine derivative that acts as a tyrosine kinase enzyme inhibitor[89].
Imatinib is an encouraging treatment modality in patients affected by chronic myeloid leukemia (CML) and gastrointestinal stromal tumor (GIST) [90]. Imatinib side effects consist of edema, skin rash, and ocular side effects.
The most common ocular side effects of imatinib include periorbital edema and optic neuropathy has not been reported till now. But there is a case report of Dasatinib optic neuropathy which is in the family of Imatinib [91] (Figs. 6.73, 6.74, 6.75, 6.76 and 6.77).

Photo of an old male (76 years old) referred to our center because of decreased vision in his right eye. He had a history of chronic myelocytic leukemia for 10 years and consumes imatinib. Note the bilateral orbital edema

a Color fundus photograph, b RNFL thickness profile, and “c” SLO-OCT images of the macula of the affected eye in the same patient in Fig. 6.73. Hard exudates on color fundus (yellow dots) represent edema and fluid accumulation. RNFL thickness profile shows thickening of nerve fiber layer with multiple cystic spaces on it and on ONL (white arrows) that indicates chronic disease and edema with cell loss. There is a small subfoveal retinal detachment (white arrowhead) that indicates the severity of edema. OCT optical coherence tomography SLO scanning laser ophthalmoscopy GCL ganglion cell complex ON optic neuritis RNFL retinal nerve fiber layer ONL outer nuclear layer

FA of both eyes in the late stage of fluorescein angiography shows prominent leakage at the optic disk on the right side and minimum leakage on the left. FA Fluorescein angiography

Macular topographic maps show severe macular edema in the right eye and normal volume in the left

a Wide field, SLO-OCT image of the same patient before discontinuation of the drug. Sever macular edema, intraretinal fluid accumulation, and subfoveal serous detachment are notable. b Wide field SLO-OCT images 3 months after discontinuation of Imatinib, show significant Improvement with mild residual thickening and small hard exudate remnant. c First topographic map versus one d after 3 months of discontinuation of the drug. OCT optical coherence tomography SLO scanning laser ophthalmoscopy
After consultation with his oncologist, we decided to discontinue the drug for 3 months, without any further treatment for him.
Intracranial space-occupying lesion and compressive optic neuropathy:
In the case of nerve fiber layer thinning (Figs. 6.78, 6.79, 6.80, 6.81 and 6.82), clinicians should always consider intracranial etiologies.

The color fundus photographs are from a 56- year-old woman with a recent decrease in the vision of her left eye (less than 20/200). She had a normal eye examination, except for mild temporal left optic disc pallor. There is no evidence of hypertension, diabetes mellitus, or other systemic diseases

a and b Fluorescein angiography of the same patient in Fig. 6.78, is unremarkable in both eyes. There is a mild thickness difference between eyes. The left macula is thinner than the right one. c and d The tomographic findings indicate the loss of inner layers of the left eye

Retinal nerve fiber layer thickness curve evaluation in the same patient in Fig. 6.78 reveals considerable thinning of the nerve fiber layer on the temporal side of the left eye. The right side shows a normal thickness

The visual field (same patient in Fig. 6.78) shows considerable and near-complete loss of the left visual field

Brain magnetic resonance imaging with gadolinium (same patient n Fig. 6.78) revealed an extra-axial isosignal-intensity mass lesion in all sequences in the left middle cranial fossa. The dimensions were approximately 25 mm × 20 mm × 18 mm with total enhancement. The mass had a dural tail, which was compatible with a sphenoidal ridge meningioma. The left optic nerve and internal carotid artery were encased by the lesion with extension to the cavernous sinus
In the case of nerve fiber layer thinning, especially on the temporal side in an OCT image, neurological evaluation should seriously be performed to rule out intracranial etiologies.
We introduce a 48 years old male with 20/20 vision with a chief complaint of diplopia who was referred to us from the strabismus clinic. He had a car accident a few month ago with severe head trauma and loss of consciousness for a few days and hospitalization (Figs. 6.83, 6.84, 6.85, 6.86 and 6.87).

a and b SLO-OCT images shows temporal GCL atrophy on the right side (red arrowheads in a) and nasal GCL loss in the left eye (red arrowheads in b). OCT optical coherence tomography SLO scanning laser ophthalmoscopy GCL ganglion cell layer

RNFL thickness profile shows near-normal measurement except mild temporal side thinning. RNFL retinal nerve fiber layer

a and c macular topographic map of both eyes show temporal on the right side and nasal on the left side atrophy (white arrowheads). b and d GCL thickness maps reveal the same findings (white arrowheads). GCL ganglion cell layer

Perimetry of both eyes revealed left hemianopia that could explain patient diplopia due to loss of central vision and inability to merge retinal images

References
Mwanza JC, Budenz DL. Optical coherence tomography platforms and parameters for glaucoma diagnosis and progression. Curr Opin Ophthalmol. 2016;27:102–10.
Appukuttan B, Giridhar A, Gopalakrishnan M, et al. Normative spectral domain optical coherence tomography data on macular and retinal nerve fibre layer thickness in Indians. Indian J Ophthalmol. 2014;2014(62):316–21.
Knight ORG, Girkin CA, Budenz DL, et al. Effect of race, age, and axial length on optic nerve head parameters and retinal nerve fiber layer thickness measured by Cirrus HD-OCT. Arch Ophthalmol. 2012;130(3):312.
Budenz DL, Anderson DR, Varma R, et al. Determinants of normal retinal nerve fiber layer thickness measured by stratus OCT. Ophthalmology. 2007;114(6):1046–52.
Tariq YM, Li H, Burlutsky G, et al. Retinal nerve fiber layer and optic disc measurements by spectral domain OCT: normative values and associations in young adults. 2012;26(12):1563–70
MashigeK P, Oduntan OA. Retinal nerve fibre layer thickness values and their associations with ocular and systemic parameters in Black South Africans. Afr Health Sci. 2017;16(4):1188.
Sani R, Abdu L, Pam V. Retinal nerve fiber layer thickness measurements of normal Northern Nigerian adults using optical coherence tomography. Ann Afr Med. 2016;15:52–7.
Manassakorn A, Nouri-Mahdavi K, Caprioli J. Comparison of retinal nerve fiber layer thickness and optic disk algorithms with optical coherence tomography to detect glaucoma. Am J Ophthalmol. 2006;141:105–15.
Bendschneider D, Tornow RP, Horn FK, et al. Retinal nerve fiber layer thickness in normals measured by spectral domain OCT. J Glaucoma. 2010;19:475–82.
Hirasawa H, Tomidokoro A, Araie M, et al. Peripapillary retinal nerve fiber layer thickness determined by spectral-domain optical coherence tomography in ophthalmologically normal eyes. Arch Ophthalmol. 2010;128:1420.
Mwanza J-C, Durbin MK, Budenz LB. Interocular symmetry in peripapillary retinal nerve fiber layer thickness measured with the cirrus HD-OCT in healthy eyes. Am J Ophthalmol. 2011;151:514–21.
Shin JW, Uhm KB, Seong M. Retinal nerve fiber layer defect volume deviation analysis using spectral-domain optical coherence tomography. Invest Ophthalmol Vis Sci. 2015;56:21–8.
Shin JW, Uhm KB, Seong M, Lee DE. Retinal nerve fiber layer volume measurements in healthy subjects using spectral domain optical coherence tomography. J Glaucoma. 2014;23:567–73.
Liu T, Tatham AJ, Gracitelli CP, Zangwill LM, Weinreb RN, Medeiros FA. Rates of retinal nerve fiber layer loss in contralateral eyes of glaucoma patients with unilateral progression by conventional methods. Ophthalmology. 2015;122:2243–51.
Bussel II, Wollstein G, Schuman JS. OCT for glaucoma diagnosis, screening and detection of glaucoma progression. Br J Ophthalmol. 2014;98 Suppl–2:ii15–9.
Michelessi M, Lucenteforte E, Oddone F, Brazzelli M, Parravano M, Franchi S, et al. Optic nerve head and fibre layer imaging for diagnosing glaucoma. Cochrane Database Syst Rev. 2015;(11):CD008803.
Straatsma BR, Foos RY, Heckenlively JR, Taylor GN. Myelinated retinal nerve fibers. Am J Ophthalmol. 1981;91:25–38.
Kodama T, Hayasaka S, Setogawa T. Myelinated retinal nerve fibers: prevalence, location and effect on visual acuity. Ophthalmologica. 1990;200:77–83.
Tarabishy AB, Alexandrou TJ, Traboulsi EI. Syndrome of myelinated retinal nerve fibers, myopia, and amblyopia: a review. Surv Ophthalmol. 2007;52:588–96.
Lam AK, Pang PC. The effect of myelination on perimetry and retinal nerve fibre analysis. Clin Exp Optom. 2000;83:4–11.
Shelton JB, Digre KB, Gilman J, et al. Characteristics of myelinated retinal nerve fiber layer in ophthalmic imaging: findings on autofluorescence, fluorescein angiographic, infrared, optical coherence tomographic, and red-free images. JAMA Ophthalmol. 2013;131:107–9.
Jain N, Johnson MW. Pathogenesis and treatment of maculopathy associated with cavitary optic disc anomalies. Am J Ophthalmol. 2014;158:423–35.
Ferry AP. Macular detachment associated with congenital pit of the optic nerve head. Pathologic findings in two cases simulating malignant melanoma of the choroid. Arch Ophthalmol. 1963;70:346–57.
Georgalas I, Ladas I, Georgopoulos G, et al. Optic disc pit: a review. Graefes Arch Clin Exp Ophthalmol. 2011;249:1113–22.
Brodsky MC. Congenital optic disk anomalies. Surv Ophthalmol. 1994;39:89–112.
Theodossiadis GP, Panopoulos M, Kollia AK, et al. Long-term study of patients with congenital pit of the optic nerve and persistent macular detachment. Acta Ophthalmol. 1992;70:495–505.
Brown GC, Shields JA, Goldberg RE. Congenital pits of the optic nerve head. II. Clinical studies in humans. Ophthalmology. 1980;87:51–65.
Shah SD, Yee KK, Fortun JA, et al. Optic disc pit maculopathy: a review and update on imaging and treatment. Int Ophthalmol Clin Spring. 2014;54:61–78.
Bonnet M. Serous macular detachment associated with optic nerve pits. Graefes Arch Clin Exp Ophthalmol. 1991;229:526–32.
Kranenburg EW. Crater-like holes in the optic disc and central serous retinopathy. Arch Ophthalmol. 1960;64:912–24.
Brockhurst RJ. Optic pits and posterior retinal detachment. Trans Am Ophthalmol Soc. 1975;73:264–91.
Sanghi G, Padhi TR, Warkad VU, et al. Optical coherence tomography findings and retinal changes after vitrectomy for optic disc pit maculopathy. Indian J Ophthalmol. 2014;62:287–90.
Contreras I, Noval S, Rebolleda G, et al. Follow-up of nonarteritic anterior ischemic optic neuropathy with optical coherence tomography. Ophthalmology. 2007;114:2338–44.
Fard MA, Afzali M, Abdi P, et al. Comparison of the pattern of macular ganglion cell-inner plexiform layer defect between ischemic optic neuropathy and open-angle glaucoma. Invest Ophthalmol Vis Sci. 2016;57:1011–6.
Gonul S, Koktekir BE, Bakbak B, et al. Comparison of the ganglion cell complex and retinal nerve fiber layer measurements using Fourier domain optical coherence tomography to detect ganglion cell loss in non arteritic anterior ischaemic optic neuropathy. Br J Ophthalmol. 2013;97:1045–50.
Schuster AK, Steinmetz P, Forster TM, et al. Choroidal thickness in nonarteritic anterior ischemic optic neuropathy. Am Ophthalmol. 2014;158:1342–7.
Friedman AH, Henkind P, Gartner S. Drusen of the optic disc. A histopathological study. Trans Ophthalmol Soc U K. 1975;95:4–9.
Golnik K. Congenital optic nerve anomalies. Curr Opin Ophthalmol. 1998;9:18–26.
Antcliff RJ, Spalton DJ. Are optic disc drusen inherited? Ophthalmology. 1999;106:1278–81.
Tso MO. Pathology and pathogenesis of drusen of the optic nervehead. Ophthalmology. 1981;88:1066–80.
Spencer TS, Katz BJ, Weber SW, Digre KB, et al. 2004;24:297–8.
Johnson LN, Diehl ML, Hamm CW, Sommerville DN, Petroski GF. Differentiating optic disc edema from optic nerve head drusen on optical coherence tomography. Arch Ophthalmol. 2009;127:45–9.
Kupersmith MJ, Sibony P, Mandel G, et al. Optical coherence tomography of the swollen optic nerve head: deformation of the peripapillary retinal pigment epithelium layer in papilledema. Invest Ophthalmol Vis Sci. 2011;52:6558–64.
Sibony P, Kupersmith MJ, Rohlf FJ. Shape analysis of the peripapillary RPE layer in papilledema and ischemic optic neuropathy. Invest Ophthalmol Vis Sci. 2011;52:7987–95.
Kurz-Levin MM, Landau K. A comparison of imaging techniques for diagnosing drusen of the optic nerve head. Arch Ophthalmol. 1999;117:1045–9.
Boldt HC, Byrne SF, DiBernardo C. Echographic evaluation of optic disc drusen. J Clin Neuroophthalmol. 1991;11:85–91.
Ikuta F, Zimmerman HM. Distribution of plaques in seventy autopsy cases of multiple sclerosis in the United States. Neurology. 1976;26(6 PT2):26–8.
Toussaint D, Périer O, Verstappen A, et al. Clinicopathological study of the visual pathways, eyes, and cerebral hemispheres in 32 cases of disseminated sclerosis. J Clin Neuroophthalmol. 1983;3:211–20.
Britze J, Pihl-Jensen G, Frederiksen JL. Retinal ganglion cell analysis in multiple sclerosis and optic neuritis: a systematic review and meta-analysis. J Neurol. 2017;264:1837–53.
Coric D, Balk LJ, Uitdehaag BMJ, et al. Diagnostic accuracy of optical coherence tomography inter-eye percentage difference for optic neuritis in multiple sclerosis. Eur J Neurol. 2017;24:1479–84.
Wildemann B, Jarius S, Paul F. Neuromyelitis optica. Nervenarzt. 2013;84(4):436–41.
Jarius S, Paul F, Franciotta D, et al. Mechanisms of disease: aquaporin-4 antibodies in neuromyelitis optica. Nat Clin Pract Neurol. 2008;4(4):202–14.
Jarius S, Wildemann B, Paul F. Neuromyelitis optica: clinical features, immunopathogenesis and treatment. Clin Exp Immunol. 2014;176(2):149–64.
Wingerchuk DM, Banwell B, Bennett JL, et al. International consensus diagnostic criteria for neuromyelitis optica spectrum disorders. Neurology. 2015;85(2):177–89.
Kremer L, Mealy M, Jacob A, et al. Brainstem manifestations in neuromyelitis optica: a multicenter study of 258 patients. Mult Scler. 2014;20(7):843–7.
Zhao S, Mutch K, Elsone L, et al. Neuropathic pain in neuromyelitis optica affects activities of daily living and quality of life. Mult Scler. 2014;20(12):1658–61.
Chavarro VS, Mealy MA, Simpson A, et al. Insufficient treatment of severe depression in neuromyelitis optica spectrum disorder. Neurol Neuroimmunol Neuroinflamm. 2016;e286:3.
Chanson J-B, Zéphir H, Collongues N, et al. Evaluation of health-related quality of life, fatigue and depression in neuromyelitis optica. Eur J Neurol. 2011;18(6):836–41.
Metz I, Beißbarth T, Ellenberger D, et al. Serum peptide reactivities may distinguish neuromyelitis optica subgroups and multiple sclerosis. Neurol Neuroimmunol Neuroinflamm. 2016;e204:3.
Zekeridou A, Lennon VA. Aquaporin-4 autoimmunity. Neurol Neuroimmunol Neuroinflamm. 2015;2(4):e110.
Paul F, Jarius S, Aktas O, et al. Antibody to aquaporin 4 in the diagnosis of neuromyelitis optica. PLoS Med. 2007;e133:4.
Jarius S, Ruprecht K, Wildemann B, et al. Contrasting disease patterns in seropositive and seronegative neuromyelitis optica: a multicentre study of 175 patients. J Neuroinflammation. 2012;9:14.
Bennett JL, O’Connor KC, Bar-Or A, et al. B lymphocytes in neuromyelitis optica. Neurol Neuroimmunol Neuroinflamm. 2015;e104:2.
Melamed E, Levy M, Waters PJ, et al. Update on biomarkers in neuromyelitis optica. Neurol Neuroimmunol Neuroinflamm. 2015;e134:2.
Takeshita Y, Obermeier B, Cotleur AC, et al. Effects of neuromyelitis optica-IgG at the blood-brain barrier in vitro. Neurol Neuroimmunol Neuroinflamm. 2017;e311:4.
Ramanathan S, Prelog K, Barnes EH, et al. Radiological differentiation of optic neuritis with myelin oligodendrocyte glycoprotein antibodies, aquaporin-4 antibodies, and multiple sclerosis. Mult Scler. 2016;22(4):470–82.
Sanchez-Dalmau B, Martinez-Lapiscina EH, Torres-Torres R, et al. Early retinal atrophy predicts long-term visual impairment after acute optic neuritis. Mult Scler. 2017;1352458517718628.
Balcer LJ. Clinical practice. Optic neuritis. N Engl J Med. 2006;354(12):1273–80.
Sotirchos ES, Saidha S, Byraiah G, et al. In vivo identification of morphologic retinal abnormalities in neuromyelitis optica. Neurology. 2013;80(15):1406–14.
Schneider E, Zimmermann H, Oberwahrenbrock T, et al. Optical coherence tomography reveals distinct patterns of retinal damage in neuromyelitis optica and multiple sclerosis. PLoS ONE. 2013;8(6):e66151.
Costello F. Optical coherence tomography in neuro-ophthalmology. Neurol Clin. 2017;35(1):153–63.
Bock M, Brandt AU, Dörr J, et al. Patterns of retinal nerve fiber layer loss in multiple sclerosis patients with or without optic neuritis and glaucoma patients. Clin Neurol Neurosurg. 2010;112(8):647–52.
Merle H, Olindo S, Jeannin S, et al. Treatment of optic neuritis by plasma exchange (add-on) in neuromyelitis optica. Arch Ophthalmol Chic Ill. 1960;2012(130):858–62.
Monteiro MLR, Fernandes DB, Apóstolos-Pereira SL, et al. Quantification of retinal neural loss in patients with neuromyelitis optica and multiple sclerosis with or without optic neuritis using Fourier-domain optical coherence tomography. Invest Ophthalmol Vis Sci. 2012;53(7):3959–66.
Sotirchos ES, Saidha S, Byraiah G, Mealy MA, Ibrahim MA, Sepah YJ, et al. In vivo identification of morphologic retinal abnormalities in neuromyelitis optica. Neurology. 2013;80(15):1406–14.
Kaufhold F, Zimmermann H, Schneider E, et al. Optic neuritis is associated with inner nuclear layer thickening and microcystic macular edema independently of multiple sclerosis. PLoS ONE. 2013;8(8):e71145.
Gelfand JM, Cree BA, Nolan R, et al. Microcystic inner nuclear layer abnormalities and neuromyelitis optica. JAMA Neurol. 2013;70(5):629–33.
Brandt AU, Oberwahrenbrock T, Kadas EM, et al. Dynamic formation of macular microcysts independent of vitreous traction changes. Neurology. 2014;83(1):73–7.
Balk LJ, Killestein J, Polman CH, et al. Microcystic macular oedema confirmed, but not specific for multiple sclerosis. Brain J. Neurol. 2012;135:e226. Return to ref 128 in article
Gelfand JM, Nolan R, Schwartz DM, et al. Microcystic macular oedema in multiple sclerosis is associated with disease severity. Brain J Neurol. 2012;135(6):1786–93.
Felix CM, Levin MH, Verkman AS. Complement-independent retinal pathology produced by intravitreal injection of neuromyelitis optica immunoglobulin G. J Neuroinflammation. 2016;13(1):275.
Reichenbach A, Bringmann A. Müller cells in the healthy and diseased retina. 1st ed. New York: Springer; 2010.
Reichenbach A, Bringmann A. New functions of Müller cells. Glia. 2013;61(5):651–78.
Tian D-C, Su L, Fan M, et al. Bidirectional degeneration in the visual pathway in neuromyelitis optica spectrum disorder (NMOSD). Mult Scler. 2017;1352458517727604.
Bassi ST, Mohana KP. Optical coherence tomography in papilledema and pseudopapilledema with and without optic nerve head drusen. Ind J Ophthalmol. 2014;62:1146–51.
Lessell S. Nutritional deficiency and toxic optic neuropathies. In: Albert DM, Jakobiec FA, editors. Principles and practice of ophthalmology. 2nd ed. Philadelphia: W.B. Saunders Company; 2000. p. 4169–76.
Phillips PH. Toxic and deficiency optic neuropathies. In: Miller NR, Newman NJ, Biousse V, Kerrison JB, editors. Walsh and Hoyt’s clinical neuro-ophthalmology. 6th ed. Baltimore, Maryland: Lippincott Williams.
Kerrison JB. Optic neuropathies caused by toxins and adverse drug reactions. Ophthalmol Clin North Am. 2004;17:481–8.
Nagar B, Bornmann WG, Pellicena P, et al. Crystal structures of the kinase domain of c-Abl in complex with the small molecule inhibitors PD173955 and imatinib (STI-571). Cancer Res. 2002;62:4236–43.
Buchdunger E, O’Reilly T, Wood J. Pharmacology of imatinib (STI571). Eur J Cancer. 2002;385:S28–36.
Monge KS, Gálvez-Ruiz A, Alvárez-Carrón A, et al. Optic neuropathy secondary to dasatinib in the treatment of a chronic myeloid leukemia case. Saudi J Ophthal. 29(3):227–31
Author information
Authors and Affiliations
Corresponding author
Editor information
Editors and Affiliations
Rights and permissions
Copyright information
© 2022 The Author(s), under exclusive license to Springer Nature Switzerland AG
About this chapter

Cite this chapter
Hajizadeh, F., Tabatabaei, S.M. (2022). Circumpapillary Retinal Nerve Fiber Layer, Optic Nerve Head, and Related Structural Abnormalities. In: Hajizadeh, F. (eds) Atlas of Ocular Optical Coherence Tomography. Springer, Cham. https://doi.org/10.1007/978-3-031-07410-3_6
Download citation
DOI: https://doi.org/10.1007/978-3-031-07410-3_6
Published:
Publisher Name: Springer, Cham
Print ISBN: 978-3-031-07409-7
Online ISBN: 978-3-031-07410-3
eBook Packages: MedicineMedicine (R0)