
Abstract
Solar energy has an important place in the global energy context, this leading to an intense concern in the unconventional energies field. Even if the earth receives only a small fraction of the solar radiation emitted by the Sun (because the radiation suffers the phenomena of absorption and diffusion in the atmosphere) the solar energy has become one of the most important renewable sources. Solar energy can be captured and converted into electrical energy by using the photovoltaic technologies and/or thermal energy, through the use of various types of solar panels heat shields. In this context, the field of producing electricity with photovoltaic panels is approached in this chapter. The photovoltaic panels are devices that convert the solar energy into electrical energy. Depending on weather conditions, the generated renewable energy oscillates, being required an energy storage system to store the excess energy or to discharge energy during the lack of energy. The best solution applied for short-term storage of energy is the battery. On the other hand, the photovoltaic systems only use a portion of the solar radiation and of certain wavelengths, in order to produce electrical energy. The rest of the energy received at the surface is converted into heat, leading to a rise in temperature of the cells components and reduction in yield. In conclusion, increasing productivity and energy efficiency of these facilities involves both the efficiency of their operation in the electric field and the study of the thermal phenomena that take place. In order to ensure a high degree of felicity of the electrical energy management at the level of a microgrid type user, it is necessary to know the energy flows, the structure of the distribution network, and identification of the technical solutions depending on the field. In this chapter, the main functional parameters of the system considered will be analyzed, the quality parameters at the level of the electricity system of the user will be estimated, and the operating parameters of the system considered will be also analyzed. The objective of the chapter is to propose a technical solution to improve the efficiency of a photovoltaic power plant within an area of seventy hectares through control, surveillance , metering and monitoring of the system from distance based on Supervisory Control and Data Acquisition (SCADA) system. The photovoltaic power plant used to carry out the experiments is located in Romania. The location of the photovoltaic park is in a plain area where solar radiation is higher (over 1450 kWh/m2 year, in particular in the summer). With the help of the SCADA system, the energy management of the photovoltaic park can be achieved for: a short period (one day) or for a longer period (a week). The SCADA system offers information about: total energy delivered (kWh), day energy delivered (kWh), active inverter power (kW), percent of availability for photovoltaic power plant , weather info (ambient temperature, plane radiation etc.), hourly graphs about plant production, alarms, current strings, energy meter (exported active-reactive power, imported active-reactive power), data about the weather station, inverter graphs, state of power transformers, breaker state, earthing state, month radiation, month exported active energy, currents variation (Ia, Ib, Ic), leakage current variation (Ig), and voltage variation (Va, Vb, Vc). The data stored by the system will allow the user to receive current information, but also these data can be compared with the data stored in the same period of the past years, in order to establish the productive efficiency of the photovoltaic power plant .
Access provided by Autonomous University of Puebla. Download chapter PDF
Keywords
- Alarms
- Control
- Energy management
- Energy meter
- Metering
- Monitoring
- Photovoltaic power plant
- SCADA
- Surveillance
1 Introduction
The sun is the most important source of energy for all natural processes on Earth. It is a source of energy vital for the survival of all species of plants and animals and supplies power for many critical processes such as photosynthesis.
The production of energy using solar radiation can be made using direct or indirect methods. The indirect form of solar energy is biological material from the past which has been converted into fossil fuels (oil or coal), and the wind energy, hydro and bioenergy. The photovoltaic installations generate a form of direct solar energy.
2 SCADA Microgrid Architecture for Photovoltaic Power Plant Studied
Key parts of a photovoltaic system for the generation of electricity are:
-
The photovoltaic cells and modules for capturing solar energy;
-
An inverter to convert the direct current (DC) in alternating current (AC);
-
A set of batteries and charging controller for autonomous systems;
-
The other components of the system.
All the components of the system, with the exception of the photovoltaic modules, are called components of the Balance-of-System (BOS).
Measurements have been carried out in a photovoltaic park situated in the southern part of Romania.
Modules are connected in series (called string) to obtain necessary voltage. Enumerated strings are connected in parallel to obtain required current of the system (Fig. 11.1).

Modules checks in the park of the PV analyzed
The PV modules can generate power between 25 Wp up to 350 Wp depending on the size of PV panel. The small power modules are usually used in standalone applications, where usually required power is not so big. Modules can be dimensioned for quick installation in any location (Fig. 11.2). The module manufacturers usually provide an output power of 70% from the nominal power and after 25 years of use [1,2,3].

Cables arranged on the structure
2.1 SCADA System-Presentation
Supervisory Control and Data Acquisition (SCADA) are the management and supervisory components system [4,5,6,7].
This system is composed of:
-
The center of computing equipment which is considered as a Master User Terminal (MUT);
-
Units located in the field (remote terminal) for acquisition and adjustment (RTU);
-
Software for monitoring, control , remote control and adjustment of the equipment.
The calculation is intended to allow the process and the execution of the application program which will allow monitoring and implementation of the energy balance sheets .
In this respect, an IBM compatible PC computer (Fig. 11.3) is used, which must to have the following minimal features:

IBM compatible PC computer
-
Intel Core 2 Duo Processor: 2.13 GHz;
-
Hard disk—1 × 160 GB SATA drives;
-
RAM—1 GB;
-
2 free slots on the standard PCI bus;
-
DVD—R/W;
-
10/100 Fast Ethernet network interface;
-
Audio—on board;
-
Power management;
-
Graphical User Interface—least 256 MB RAM;
-
TFT color Monitor—22″;
-
Mouse, Keyboard;
-
A Windows Operating System;
-
Uninterruptible Power Supply 220 V/50 Hz;
-
Putter: 1000 VA.
2.1.1 The Switch Cabinet with Programmable Automation Automatically
The cabinet of automation is structured on the programmable resources of the automatics Simatic S Series 7 200 [4].
The process automatically interfaces with Siemens programmable is composed of:
-
1.
Uch block CPU 224 XP AC/DC/Relay (component 6ES7 224-2BD23-0XB0):
-
The maximum expansion modules: 7;
-
Number of communication interfaces RS 485: 2;
-
Numeric inputs: 14 galvanic isolations by optocoupler;
-
Numeric outputs: 10 with relay;
-
The maximum number of I/O Extension numeric controlled: 256 256 entries and exits numerics;
-
The maximum number of analog I/O:16-16 analog inputs and outputs;
-
The maximum number of central unit on RS 485 Serial Bus: 32;
-
Power: 220 V/50 Hz through the filter.
-
-
2.
The Profibus communication protocol (Code 6ES7 277-022-0 said AA0)
-
Industry Standard serial port RS 485;
-
The Profibus communication protocols: DP (slave); MPI (slave);
-
The Communication Speed: 12 Mbit/s with automatic detection of the transmission speed;
-
The address of the programmable station: 0–99; (Fig. 11.4).
Fig. 11.4 
Communication from PV ST1
-
-
3.
Block Extension analog EM231 you 4 × 12 Bit (Code 6ES7 231-0HC20-0XA0):
-
Number of analogue channels: 8;
-
Type entry: Current unipolar/unified selectable voltage.
-
-
4.
A display device type Touch Panel TP 177A:
-
The touch control panel;
-
16 shades of gray, the protocol dialog: PPI, MPI, Profibus.
-
-
5.
The control block/pump drive:
-
The safety switch (breaker) Code 3CC10 11-1JA1;
-
Soft starter type 3RW 30-16/380 VAC—3RW30 16-1CB14;
-
Fuses 3NA 3807-0; support fuse 3NP 40-10.
-

2.1.2 The Closet of the Electronic Regulators
In the closet are installed:
-
The regulator TriStar is an all-in-one;
-
Sources photovoltaic regulators;
-
Accumulator battery;
-
Inverter type XTH 6000-48 system: (Fig. 11.5a);
Fig. 11.5 
a Inverter checks, b the inverter communication system
-
The task of unloading (diversion);
-
Connecting Block photovoltaic sources (Fig. 11.5b).

2.2 The SCADA System Functions
The system drop is implemented for the purpose of monitoring the main parameters of the energy sector, the establishment of arrangements for operation, the acquisition of data and storing them in the database, processing on the data bases for the drawing up of energy balances and the determination of the efficiency of the generation [3, 4, 7].
The main functions are:
-
Achievement of the console operator—dispatcher man—machine interface (HMI);
-
Tracking System layout of detail at each point of monitoring and other equipment integrated into the fall;
-
Sending commands to the equipment performance;
-
Measurement of analogue and numerical magnitudes continuously and storage in the data bases of measurements;
-
View analog and numerical data from each measuring point on the general or his own screen automation cabinet;
-
Demonstration in real time the occurrence of critical events of alarm or hazard warning lights and visual and audible alert the operator to operator interfaces;
-
Configuration of the generating equipment; set the parameters for the transducers; the allocation of signals; defining the damage, filtering information and generate a report of events;
-
Saving data acquired and the specific information events in relational database;
-
Tracking status for the operation of the energy sources and protections in real time;
-
Perform the correlation between parameters and processing on the quantities purchased;
-
Display of reports and tables relating to the operation of the system and equipment for the generation technology.
2.2.1 The Structure of the SCADA Informatics Systems
The computer system uses the standard procedures by defining a rigorous task for the used and developed documents and detailed rules for the testing and validation stages. Application software packages are developed under development environments as appropriate for the type of application by using the facilities given by the specific functions developed in the language of high level, the modules provided by the libraries environment for development, the possibilities for the generation, and the management of databases .
It will ensure that the computer after the implementation of the Decision Support System (DSS) components system must comply with the following essential requirements of the application [3, 8]:
-
Compliance with the response times, required by technological processes;
-
The concomitance use (facilities for multiple users at the same time, the execution of several independent tasks for the same user);
-
The efficiency of the system in the optimum use of the resources;
-
Sharing and protection, prevent unauthorized access and accidental or intentional alteration of information;
-
Reliability and availability of the system;
-
Commonality, flexibility, and expandability;
-
Modularity horizontally and vertically;
-
The transparency and visibility for the purposes of the efficient use and performance;
-
Flexible structure, so as to permit the integration into the system of databases used for storing the historical data [6, 7].
2.2.2 Decision Support System (DSS)
Decision support system , being integrated into the main system of supervision and control at the level of the human operator, is one liabilities for a single human decident (does not have effective role in the process control; see F.G. Filip in presentation about decision support systems, 2004).
Its construction consists of a series of activities which have as their purpose the obtaining of stable, usable variants of the decision support system .
Further improvement is provided by its capacity of supervised learning [4, 5, 9,10,11,12,13,14]. The decision system support is detailed by stages of development in Fig. 11.6.

The stages of development of the decisional system support
2.2.3 The Analysis of the System
It involves the collection and processing of data. It includes:
-
The inventory and the in-depth study of the decision-making statements for which it is intended to provide a computer;
-
The identification of each operator who will become a user of the system;
-
Registry of items of context that the restrictions placed at the top level in the development of the transmission infrastructure/decisions, the computerized existence;
-
The assessment of the results of initiatives prior to the introduction of the decision support system.
2.2.4 Technical Design
At this stage, the system and its components is actually designed as a whole from the point of view of information technology , the content of the specification being already transposed into a project of execution. The modern design is based on modern and modular information tools, which provides high flexibility in designing of the system. The design process consists in activities to establish of the structure of the DSS, define the technology of each component of the system, and set ways of integration with other parts of the main information system (note that the DSS is a software module embedded in the system of supervision and control at the level of the dispatcher).
2.2.5 Implementation
It is the stage at which will be carried out of the DSS software module in accordance with the technical project. It is the implementation and testing of the model of the original DDS. The test involves checking the solutions generated by the DSS with an indication that the system has the ability to learn while supervised. The activities of the verification and validation are intended to determine the extent to which the implementation has led to the achievement of an efficient system. Checking the aims to the appreciation of the correctness of the transposition of the systems of the project Validation is intended to determine the extent to which they are satisfied with the detailed specifications regarding the functions carried out by the DSS.
2.2.6 The Exploitation and Development
Operation consists in the putting into service of the system validated and constant analysis by dispatcher performance decisions generated by the DSS. Supervised learning capability (storage of corrections introduced by the dispatcher) allows the decision support system to evolve [4, 6].
2.2.7 The Implementation of an Embedded System for Decision Support at the Level of the SCADA Application
Decision support system will be implemented at the level of the operator who will supervise the system energy efficiency through SCADA platform.
The practical implementation of the DSS will consists in adding additional functions of specific SCADA functions.
The operating strategy must help the human operator of the system to decide how many and which generators must be running, which controllable tasks to be connected and storage control energy. Selecting the best combination of operation for each application depends on several parameters: the load characteristics; the system configuration; requirements regarding the quality of energy.
The control strategy adopted should determine the best operating mode of the system.
It is influenced by multiple factors:
-
Change in energy demand in time; the variation of power;
-
The number of renewable energy generators;
-
The uncertainty of power products from specific sources;
-
The quality of the energy supplied (of the required quality—variation in frequency and voltage around the nominal value).
The quality of the power represents a main concern in electrical networks, especially in our days when the power converters producing harmonicas are most often encountered in all branches of industry and in the residential sector.
Improvement of the quality of the power will consist of the following:
-
Compensation and voltage voids;
-
Frequency Control;
-
The control voltage;
-
The phase unbalance compensation;
-
Compensation harmonics.
Of these adjusting voltage and frequency are the most important aspects in the framework of the control system of a Micro MN (Network Micro).
In addition to these another very important aspect is to ensure continuity in the energy supply of consumers [5, 7, 15, 16].
3 Management Processes Through SCADA
Since 1980, the supervisory Control and data acquisition (SCADA) has been used as a computerized system for the collection and analysis of data in real time of the supply system [5, 6, 17, 18].
3.1 The Correlation Energy Resources on the Basis of Geographic Area
Choosing the location of a photovoltaic park is of great importance from the point of view of the effectiveness of the investment and the acceptability for the population.
Also, the cost of connection to the main power supply will be influenced by the position of the site in relation to the connection point.
On completion of the site the following general aspects:
-
The characteristics of the solar radiation in the area (evaluate the solar potential);
-
Graph of the temperatures in the area;
-
Atmospheric moisture;
-
The air density;
-
Solar irradiation;
-
Important weather phenomena;
-
The presence of the chemical active substances;
-
The presence of active mechanical particles;
-
The possibility of the employment land (environmental impact).
3.2 Location of the Photovoltaic Panels
For the location of the solar sources knowledge of solar potential is required (the quantity of solar irradiation in that area).
The photovoltaic panels will be placed on a flat surface, free of mechanical shock. The surface occupied by a photovoltaic panel is proportional to its power.
Thus, photovoltaic panel of 80 W will occupy an area of 0.75456 m2 less than the area of 1,773 m2 needed for a 150 W photovoltaic panel.
For these reasons, the calculation of the available surface used to place the panels in relation to the energy production desired by the solar source needs to be analyzed during the farm design phase.
The photovoltaic panels must be placed in such a way as to be oriented toward the sun. As a rule, when it is necessary to power in the winter months when solar radiation is low, the tilt angle of the panel should be located toward the vertical position (approximately equal to the latitude plus 15°) to maximize exposure to sunlight.
The photovoltaic systems (PV) contain cells which convert the sun’s energy into electricity. The light intensity determines the amount of electrical power generated by PV module.
3.3 Corrective Maintenance
For the photovoltaic park analyzed based on the results stored by SCADA , maintenance adjustments can be made as shown in the Table 11.1.
In Table 11.1 equipments used for corrective maintenance is described: inverter, SCADA , Diesel generator, air oven.
The following data are presented for equipment: failure of the equipments, repair explanation, failure data, response data, fixed data for repair, total time reparation, spares uses. Based on these technical dates, corrective maintenance is made [6, 8, 18,19,20,21,22,23,24,25].
Based on these data, the proposals for the pursuit of preventive maintenance are made in Table 11.2.
In Table 11.2 (preventive maintenance) the dates are fixed to verify the equipments, task description are set for every equipment, results and observation are also made.
3.3.1 Preventive Maintenance Works
-
1.
Meteorological Stations—Cleaning of pyranometers and etalon PV sensor/weekly;
-
2.
String and Combiner Boxes/monthly:
-
Visual inspections of string and combiner boxes,
-
External enclosure (No broken or scratched envelope),
-
Electrical boxes wear the proof integrity,
-
Checking doors properly opening and closing,
-
No rust on metallic parts,
-
Checking switchgears fuse bases, fuses, circuit-breakers and surge arrestors integrity and operating condition and calibration,
-
No dust, moisture, corrosion, etc.,
-
Checking correct switch opening and closing,
-
Checking correct execution and state of terminal screws,
-
Checking correct box labeling,
-
Verify electrical testing (open circuit voltage, ground continuity, switches, disconnects),
-
Checking tightening torques,
-
Visual inspections for every inside of combiner boxes and check the functionality of electronic modules (string monitoring);
-
-
3.
Inverters General and other Conditions/daily and monthly:
-
Checking for general condition of the inverters (physical appearance),
-
Checking the heating working,
-
Checking proper condition of inverts building/enclosure,
-
Visual inspections of general condition and cleanliness,
-
Checking for adequate temperature,
-
Checking for adequate ventilation,
-
Visual inspection of the electrical/lightning installation of the building,
-
Checking there is no signs of animals (rodents) and installation of traps for rodents,
-
Checking general cleanliness and filters;
-
-
4.
DC & AC Cabling—biannually:
-
Checking physical integrity of cabling. General appearance of grounding cables/connectors,
-
Checking physical integrity/tightness of cable connections, Checking state of the splices,
-
AC and DC cabling properly traced inside trays or buried corrugated conducts,
-
All cabling fastened to structural elements to ensure its stability and no sharp edges which may damage the cabling;
-
-
5.
Civil Infrastructure—monthly, biannually and annually:
-
Terrain condition: Fence and Road;
-
- 6.
-
7.
Diesel Generator—Visual inspection/monthly;
-
8.
Cleaning Building PUNCT CONNECTING PBL and PVST/daily and monthly.
3.4 Estimation of Energy Production for the Photovoltaic Park
For the year 2017, the amount of energy produced by the photovoltaic park is presented in Table 11.3. These estimates of the annual production energy for each month are made in accordance with the capacity of the photovoltaic park and estimated solar radiation for each month of the year.
Table 11.3 shows the energy values to be realized each month, but also the cumulative values from the beginning of the year to the current month [8, 26, 27].
4 Data Collection and Processing System
4.1 Analyzed Solar Park Configuration
The analyzed solar park, as site location, has the following configuration (Fig. 11.7).

The solar park—general plan connecting panels
The characteristics of the photovoltaic park analyzed:
-
Solar potential—7.5 MWh;
-
30646 Modules/14 Inverters—7.5 MW;
-
SUNTECH STP 245—20Wd/Schneider XC540.
4.2 The SCADA System Functions
Functions available to the operator in the control room of the Fire Emblem Heroes (FEH) [5]:
-
(1)
Control Functions—allowing operation through a friendly man-machine graphical interface:
-
View functions of the system setup, carried out by:
-
The Base Station/workstation operator;
-
Additional Equipment in the control room;
-
The Network Connections.
-
The organization of the view through the graphical interface man—machine is based on a hierarchical structure, containing information with different degrees of abstraction and detailing, which will allow the operator to request a comprehensive or detailed analysis of the processes:
-
Level 1: screens with overview of installations and equipment in field (at the level of technological installations)—Fig. 11.8;
Fig. 11.8 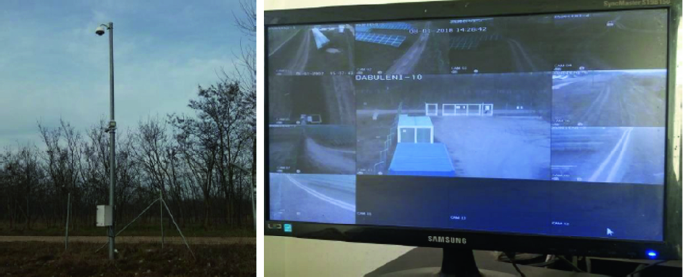
CCTV checks
-
Level 2: screens with overview of the main functions of the facilities and equipment;
-
Level 3: displays images detail regarding the operation of installations, with surveillance information (Figs. 11.9 and 11.10), and allow corrective actions (Table 11.4) and provide diagnoses (Figs. 11.11, 11.12 and 11.13).
Fig. 11.9 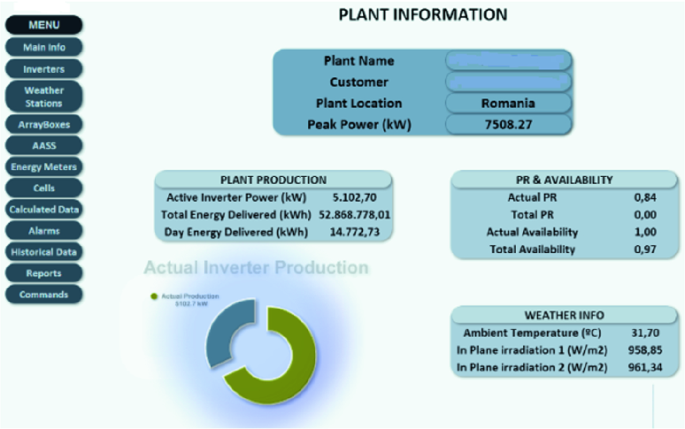
The surveillance information
Fig. 11.10 
Example of the string selection and obtaining information
Table 11.4 Work order table—March 2017 Fig. 11.11 
Diagram and oscillogram from 08.03.2017/10:44
Fig. 11.12 
The variation of yield daily
Fig. 11.13 
Current of string
In Fig. 11.9 is presented the man machine interface, which provides information about energy production (total energy delivered, day energy delivered), ambient temperature, active inverter power, plane irradiation, and total availability [24, 28].
In Fig. 11.10 the power, currents for a certain string (array box 1.1.2); and the diagram of current versus voltage on the same graph are presented.
Table 11.4 presents information obtained when the alarm is triggered. The information is related to: date of the incident, time for stop alarm, periods of stagnation, causes of the alarm, and comments and conditions [20, 29,30,31,32].
Diagram and oscillation of currents on the three phases (Ia, Ib, Ic), leakage current (Ig) and voltage variation (Va, Vb, Vc) are presented in Fig. 11.11. Also the yield daily variation and current variation for the sting number one are presented in Figs. 11.12 and 11.13 [6, 27].
-
Alarm Functions: informs the operator in good time of any abnormal operation or fault in the technological processes.
The organization screens for viewing the alarms will be made taking into account the features:
-
The screen with the overview of all alarms from process;
-
The screen with the latest Alarms Window;
-
The window with the other lists of alarms, sorted by various criteria (pre-program) Fig. 11.14.
Fig. 11.14 
Alarms
An example of alarm functions is presented in Fig. 11.14. It describes the cod of the alarm (example: 437474), the breaker state (TC6/avail.alarm), time and hours (May 10 2018, 11:48 PM).
Monitoring Functions of the variables in the technological processes: display on the screen of the graphs of evolution in time of the magnitudes of the importance of the measured from the process allowing highlighting deviations from the normal values (differentiated colors) Fig. 11.15 [5, 6, 24, 26, 28, 30, 33,34,35,36].
Fig. 11.15 
Availabilities
-
-
(2)
Advanced Functions:
-
Historical data storage features (database—date, year, hour) is presented in Table 11.5, showing the cumulative values for the requested period;
Table 11.5 Historical data storage features -
Successfully archiving of the regular data with the ability to view at any time, the form of graphical trend;
-
Successfully archiving of the events accompanied by the date of the occurrence, with the possibility to view in the form of lists with the chronological Table 11.6;
Table 11.6 Summary list of the dates of occurrence in chronological order—report for PV plant, February 2018 -
Functions for the preparation of the various reports (historical records for a specified period of time of the main variables from process; reports on the maintenance of technological developments; reports on the events, incidents, etc.) Table 11.7 [25, 27, 31, 36].
Table 11.7 Summary of data for the year 2017
-


5 Computer Simulations
Data storage and simulation was performed using the SCADA system, used to track and process on-line data [28, 30, 33, 35, 37].
All problems that occur are automatically signaled by the system to be repaired in a timely manner so that the capture of solar energy is achieved near maximum capacity.
For example, we chose three months of the year—January, February and March—months with a small solar radiation , precisely to show the performance of the photovoltaic park , at a time of year when the solar radiation is low.
Tables 11.5, 11.6 and 11.7 shows differences that occur within the same time frame but in two different years 2017 and 2018. Graphical expression of these dates is made in Tables 11.5, 11.6 and 11.7 [24, 27, 31, 32, 36].
-
Operation and Maintenance Report
-
PV 30646 modules/14 inverters—7.5 MW
A. Operational data—March 2017


B. Operational data—March 2018


Graphical expression of these dates is made in Table 11.8. Comparatively, we can observe the differences that occur during the same period of time from year to year [24, 25, 27, 30, 31, 33, 36].
The legend:

6 Conclusion
In this chapter, the main functional parametres of a photovoltaic power plant are presented using Supervisory Control and Data Acquisition (SCADA) and these parameters are used to obtained information about energy management of PV system.
The dates presented are obtained from a photovoltaic power plant within an area of seventy hecters, located in the south part of Romania, where the solar radiation is over 1450 kWh/m2 year.
With the help of SCADA system, the control, the surveillance , the metering and monitoring of the photovoltaic power plant can be made from distance. Also the energy management can be achieved starting white one day and finishing with one year.
Total energy delivered (kWh), daily energy delivered (kWh), active inverter power (kW), percent of availability for photovoltaic power plant , weather info (ambient temperature, plane radiation etc.), hourly graphs about plant production, alarms, current strings, energy meter (exported active-reactive power, imported active-reactive power), data about weather station, inverters graphs, state of power transformers, breaker state, earthling state, month radiation, and month exported active energy can be achieved using SCADA .
Also, the dates obtained from a certain months of the year are compared with the dates obtained from the same months but for different years in order to establish the efficiency of the photovoltaic power plant .
Based on the resulting dates stored by SCADA , the corrective maintenance can be done.
References
N. Nafi, K. Ahmed, M. Gregory, M. Datta, A survey of smart grid architectures, applications, benefits and standardization. J. Netw. Comput. Appl. 76, 23–36 (2016)
E. Zio, Challenges in the vulnerability and risk analysis of critical infrastructures. Reliab. Eng. Syst. Saf. 152, 137–150 (2016)
A. Nicholson, S. Webber, S. Dyer, T. Patel, H. Janicke, SCADA security in the light of cyber-warfare. Elsevier, Comput. Secur. 31, 418–436 (2012)
B. Genge, C. Siaterlis, Physical process resilience-aware network design for SCADA systems. Comput. Electr. Eng. 40, 142–157 (2014)
F.M. Enescu, N. Bizon, C.M. Moraru, Issues in Securing Critical Infrastructure Networks for Smart Grid Based on SCADA, Other Industrial Control and Communication Systems. pp. 289–324 (Springer, London, 2018)
F.M. Enescu, C.N. Marinescu, V. Ionescu, C. Stirbu, System for monitoring and controlling renewable energy sources, in 9th International Conference on Electronics, Computers and Artificial Intelligence (ECAI 2017), Targoviste, Romania, 29 June–01 July, 2017
F.M. Enescu, N. Bizon, SCADA applications for Electric Power System. in: N. Mahdavi Tabatabaei, A. Jafari Aghbolaghi, N. Bizon, F. Blaabjerg (Editors), Reactive Power Control in AC Power Systems, Fundamentals and Current Issues (Springer, 2017)
R. Billinton, Distribution system reliability performance and evaluation. Electr. Power Energy Syst. 10(3), 190–200 (1998)
K. Pipyros, C. Thraskias, L. Mitrou, D. Gritzalis, T. Apostolopoulus, A new strategy for improving cyber-attacks evaluation in the context of Tallinn manual. Comput. Secur. (2017)
N. Nezamoddini, S. Mousavian, M. Erol Kantarci, A risk optimization model for enhanced power grid resilience against physical attacks. Electr. Power Syst. Res. 143, 329–338 (2017)
L. Hughes, M. de Jong, X.Q. Wang, A generic method for analyzing the risks to energy systems. Appl. Energy 180, 895–908 (2016)
B. Karabacak, S.O. Yildirim, N. Baykal, Regulatory approaches for cyber security of critical infrastructures: the case of Turkey. Comput. Law Secur. Rev. 32, 526–539 (2016)
NIST 2 The Smart Grid Interoperability Panel—Cyber Security Working Group, Guidelines for smart grid cyber security. NISTIR 7628, pp. 1–597 (2010)
T. Liu, Y. Sun, Y. Liu, Y. Gui, Y. Zhao, D. Wang, C. Shen, Abnormal traffic-indexed state estimation: a cyber-physical fusion approach for Smart Grid attack detection. Future Gener. Comput. Syst. 49, 94–103 (2015)
H. Suleiman, I. Alqassem, A. Diabat, E. Arnautovic, D. Svetinovic, Integrated smart grid systems security threat model. Inf. Syst. 53, 147–160 (2015)
C. Pursiainen, Critical infrastructure resilience: a Nordic model in the making? Int. J. Disaster Risk Reduct. (2017)
D.A. Visan, M. Jurian, A.I. Lita, Virtual instrumentation based acquisition and synthesis module for communication signals, in 9th International Conference on Electronics, Computers and Artificial Intelligence (ECAI 2017), Targoviste, Romania, 29, June–01 July, 2017, pp. 1–4
N. Mahdavi Tabatabaei, A. Jafari Aghbolaghi, N. Bizon, F. Blaabjerg (eds.), Fundamentals and Contemporary Issues of Reactive Power Control in AC Power Systems (Springer, London, 2017)
L. Langer, F. Skopik, P. Smith, M. Kammerstetter, From old to new: assessing cybersecurity risks for an evolving smart grid. Comput. Secur. 62 (2016)
K.M. Muttaqi, J. Aghaei, V. Ganapathy, A. Esmaeel Nezhad, Technical challenges for electric power industries with implementation of distribution system automation in smart grids. Renew. Sustain. Energy 129–142 (2015)
N. Moreira, E. Molina, J. Lazaro, E. Jacob, A. Astarloa, Cyber-security in substation automation systems. Renew. Sustain. Energy Rev. 54, 1552–1562 (2016)
Y. Xiang, L. Wang, N. Liu, Coordinated attacks on electric power systems in a cyber-physical environment. Electr. Power Syst. Res. 149, 156–168 (2017)
V.M. Ionescu, The analysis of the performance of RabbitMQ and ActiveMQ, in IEEE 14th RoEduNet International Conference-Networking in Education and Research (RoEduNet NER), Sep 24, 2015, pp. 132–137
M. Emmanuel, R. Rayudu, Communication technologies for smart grid applications: a survey. J. Netw. Comput. Appl. 74, 133–148 (2016)
I.C. Hoarca, F.M. Enescu, N. Bizon, Energy efficiency for renewable energy application. Renewable Energy Sources and Clean Technologies, in 17th International Multidisciplinary Scientific Geo Conference (SGEM 2018), Albena, Bulgaria, Scopus (2018)
A. Baggini, Handbook of Power Quality (Wiley, UK, 2008)
N. Bizon, N. Mahdavi Tabatabaei, H. Shayeghi (eds.), Analysis, Control and Optimal Operations in Hybrid Power Systems—Advanced Techniques and Applications for Linear and Nonlinear Systems (Springer, London, UK, 2013)
S. Massoud Amin, Smart Grid: overview, issues and opportunities—advances and challenges in sensing, modeling, simulation, optimization and control. Eur. J. Control (5–6), 547–567 (2011)
A.V. Gheorghe, M. Masera, M. Wiejnen, L. De Vries, Critical Infrastructures at Risk (Springer, 2006)
C. Alcaraz, S. Zeadally, Critical infrastructure protection: requirements and challenges for the 21st century. Int. J. Crit. Infrastruct. Prot. 8, 53–66 (2015)
N. Bizon, N. Mahdavi Tabatabaei, F. Blaabjerg, E. Kurt (Ed.), Energy Harvesting and Energy Efficiency: Technology, Methods and Applications (Springer, 2017)
R. Billinton, P. Wang, Teaching distribution system reliability evaluation using Monte Carlo simulation. IEEE Trans. Power Syst. 14(2), May 1999
D.P. Varodayan, G.X. Gao, Redundant metering for integrity with information-theoretic confidentiality, in IEEE International Conference on Smart Grid Communications, pp. 345–349 (2010)
F. Birleanu, N. Bizon, Reconfigurable computing in hardware security—a brief review and application. J. Electr. Eng., Electr., Control Comput. Sci. (JEEECCS) 2(1), 1–12 (2016)
M. Ficco, M. Chora, R. Kozik, Simulation platform for cyber-security and vulnerability analysis of critical infrastructures. J. Comput. Sci. (2017)
A.K. Siposs, C. Stirbu, F.M. Enescu, Software application for exploring a virtual solar system. Bull.—Ser.: Electr. Comput. Sci., Pitesti, Romania 16(1), 25–28 (2016)
N. Mahdavi Tabatabaei, S. Najafi Ravadanegh, N. Bizon, Power Systems Resiliency: Modeling, Analysis and Practice (Springer, London, 2018)
Author information
Authors and Affiliations
Corresponding author
Editor information
Editors and Affiliations
Rights and permissions
Copyright information
© 2020 Springer Nature Switzerland AG
About this chapter

Cite this chapter
Enescu, F.M., Bizon, N., Hoarca, I.C. (2020). Energy Management of the Grid-Connected PV Array. In: Mahdavi Tabatabaei, N., Kabalci, E., Bizon, N. (eds) Microgrid Architectures, Control and Protection Methods. Power Systems. Springer, Cham. https://doi.org/10.1007/978-3-030-23723-3_11
Download citation
DOI: https://doi.org/10.1007/978-3-030-23723-3_11
Published:
Publisher Name: Springer, Cham
Print ISBN: 978-3-030-23722-6
Online ISBN: 978-3-030-23723-3
eBook Packages: EnergyEnergy (R0)