
Abstract
The relationship between the water used for energy production, including both electricity and sources of fuel such as oil and natural gas, and the energy consumed to extract, purify, deliver, heat/cool, treat, and dispose of water (and wastewater) is sometimes referred to as energy intensity (EI). The relationship is not truly a closed loop as the water used for energy production need not be the same water that is processed using that energy, but all forms of energy production require some input of water making the relationship inextricable. Industry reforms, increasing demand, and more recently climate change are bringing into sharp focus the links between water and electricity in unprecedented ways. Models for climate change indicate that rainfall could decrease by more than 20% by 2050, which would result in even greater worsening water shortages in different basins of Algeria. The construction of 70 dams planned will provide only small additional volumes. The particular challenge for Algeria in the coming decades will be to adapt to a decrease in renewable water resources. The country will have to carefully manage these resources. Mobilization of non-conventional water resources (desalination and wastewater reuse) will be a strategic component of future water policy. The development of unconventional resources and the management of water demand will increase more the energy consumption of the water sector. This consumption would reach nearly 12% of the country’s consumption and must be integrated dice now in the country’s energy forecasts. More coordinated planning and action will consequently be required between the water and energy sectors if further aggravation of the water deficit is to be avoided. Moreover, the revolution in renewable energy (solar power) in terms of technological development and costs may help reduce the consumption of fossil fuels and ensure reserves for future generations by fostering decentralized renewable energy projects for the energy supply of pumping stations.
The depletion of fossil resources in more or less long term, the soaring prices of oil and gas, and the fight against gas emissions (global warming) make urgent control of consumption and diversification of energy sources, a truth that interpellates louder than ever the development of renewable energy. The present chapter focuses firstly on the desalination means as an adaptation option to climate change whose adoption should not intervene in substitution for other possibilities “sustainable,” such as the rational use of water. It should also favor the production of drinking water for human consumption. Secondly, the chapter also studies the option of using photovoltaics in the desalination plant of El Magtaa (Oran) as a contribution means to achieve the target of 27% of electricity consumption from renewable sources in the country. The third objective is a comparative study (cost of water output) between the use of photovoltaic and the central grid of Sonelgaz.
Access provided by Autonomous University of Puebla. Download chapter PDF
Keywords
1 Introduction
The interdependency between the world’s two most critical resources, water and energy, is receiving more and more attention from the academia as well as the general public. A comprehensive and in-depth understanding of the water-energy nexus is essential to achieve sustainable resource management.
It is also clearly evident from the above discussion that the nexus is multidimensional. The studies also suggest that the dimensions influence each other, quite often antagonistically.
The economic dimension of the water-energy nexus is gaining in prominence, due in part to reforms occurring in both industries. In Algeria, the reforms have brought about changes to the structure, ownership, and regulatory arrangements in both industries. The industries have been functionally unbundled, competition has been introduced in the competitive segments, and monopoly segments have been opened to third-party access. Further, pricing policies have shifted from the support of subsidies to full cost recovery. In the electricity industry, a national electricity market was established across the eligible electricity customers (HT). In the water sector, an urban water market was created (ADE, SEAL, and SEOR) to distribute water users and promote the effectiveness of water (Act of 4 August 2005 on water) [1].
In the electricity sector, the wholesale market and the long-term contract prices have increased significantly through the CREG (Law No.02-01of 5 February 2002).
Water is something of a rare commodity in Algeria. Renewable natural water resources are estimated at approximately 15 billion m3 per year, which is approximately 404 m3 per capita per year, near the threshold of 500 m3 per capita per year, which is widely recognized as the scarcity threshold that indicates developing scarcity and underlying crises.
Nevertheless, the Algerian water sector is facing several limitations and problems which could, if not properly handled, limit the dynamic of economic growth that Algeria is looking for by launching a huge range of large-scale projects. These limitations and problems relate primarily to decreased water resources due to the impact of climate change which has become a reality in Algeria and whose effects on our environment are already visible.
The future development of water resources depends on solutions characterized by high energy consumption, for example, seawater desalination, the reuse of wastewater, and the introduction of drip irrigation. The development of the water sector will therefore be closely tied to the development of the energy sector.
This sector must conduct a large-scale program of studies to understand the current and future impact of climate change, identify and quantify associated costs and its interactions with water and energy, and specify adequate solutions for adaptation.
This chapter provides for Algeria an inventory of water resources, water demands, and energy, presents the strategic development of the sectors of water and energy, and analyzes the interactions between water and energy.
Energy is the basis of all human activity. Today, much of the global demand for energy is provided from the limited supply of fossil fuels. Some developed countries have turned to nuclear energy, while this can pose risks of serious accidents.
The production of electricity using a photovoltaic system connected to the grid is of great interest to developing countries, especially for countries suffering for these last years from the quality of their central grid.
Photovoltaic can have undeniable advantages, particularly for its cleanliness and durability. Also, it can be used in various applications such as agriculture, desalination, etc.
In this context, this study is a contribution to the design and integration of renewable energy sources in the central power grid, particularly in areas of high human concentration.
This study is an initial step in the project to design a photovoltaic plant for desalination station “El Magtaa” of Oran in Algeria.
Such project certainly requires huge investments which will surely influence the cost of m3 of water produced. To reduce this cost, we were interested by:
2 Water in Algeria
2.1 Resources
2.1.1 Non-conventional Water Resources
Non-conventional water resources offer a significant water resource potential in Algeria. They involve reusing wastewater, artificial recharge of groundwater, and freshwater production through the desalination of seawater or demineralization of brackish water. The Algerian National Water Resources Strategy estimates the volume of water that could be exploited from non-conventional water resources at over 2 billion cubic meters.
Wastewater Potential
Document of Algerian Ministry of Water Resources [4]
Park of sewage treatment plants
In operation:
-
Total = 145
-
Total treatment capacity = 12,000,000 EQH
-
Volume = 800 Hm3/year
In progress:
-
Total = 106
-
Total capacity of treatment to the end of 2012 = 7,965,058 EQH
-
At the end of the current program in 2014 = 1.2 billion m3/year
Seawater Desalination
Desalination has overcome technical difficulties and is now a viable, economically competitive, and technologically achievable alternative for drinking water or agriculture and the irrigation of some profitable crops. The reverse osmosis technique now used involves passing seawater at a pressure of 70 bars through a special membrane to produce freshwater. This technique has made a significant contribution to reducing operational costs, such that it has been adopted by a large number of countries as the method of choice.
-
Desalination is now technically feasible. It provides a reliable resource that can be assessed in advance, making it possible to plan investments and construction projects better.
-
Desalination facilities can be built using a BOOT (Build, Own, Operate, and Transfer) system.
-
Desalination facilities can be built quickly (12–24 months including the design stage).
Algeria is only just starting to produce freshwater by desalination or demineralization (2005). Overall production capacity is already around 2,310,000 m3 per day.
Seawater desalination may be the most appropriate solution to the situation faced by many regions in Algeria to plug the gap between water demand and supply (See Table 1).
The national strategy estimates the contribution of seawater desalination at approximately 1,000 Mm3 by 2030 (Presentation of Algerian Ministry of Water Resources in Cairo).
Brackish Water
In Algeria, around a quarter of groundwater is, either in whole or in part, brackish water. This water is mostly situated in the country’s desert and semi-desert regions.
Exploitation of brackish water resources began in 2000.
The volume of brackish water mobilized is estimated at 510,160 hm3/year whose 160 hm3/year are used to satisfy the drinking water supply.
Twelve (12) stations are operating in the provinces of Tlemcen, Oran, Tizi Ouzou, Bejaia, Illizi, Biskra, Ouargla, Medea, and Ain Defla. The production of drinking water is 24.2 hm3/year [8].
Also, 241 hm3/year of brackish water will be demineralized from a mobilized volume of 464 hm3 through 35 stations which are actually under study and work (included in different programs). The overall capacity of stations is 91.5 hm3/year. Overall throughput mobilized in upstream exceeds 428.9 hm3/year.
The situation is as follows [8].
-
In study: 06 stations (Tamanrasset 4, El Oued 2) with 04 stations whose studies were completed (Tamanrasset 2 and El Oued 2)
-
Study and realization: 01 station (Bechar)
-
In works: 12 stations (10 Ouargla, El Oued, and Tamanrasset (ADE))
-
Launching work in progress: 02 stations of ADE (Tindouf and Illizi)
-
Installation of mono-blocks: 15 stations (El Oued) whose 01 station was completed and commissioning (Réguiba C.)
2.2 Current Use of Non-conventional Water Resources
Since the 1990s [1], Algeria has adopted an appropriate policy of water resources development focused on the construction of dams which has provided drinking water supply security for all the towns and cities in the country and made it possible to develop approximately 1,234,985 ha of irrigated land, of which approximately 228,787 ha are part of large irrigated areas [4].
This supply policy means water infrastructure of 84 large dams (19 under construction), a storage capacity of 8.9 billion m3 (96 dams planned for 2016), 10 water transfer structures, and large structures for abstracting groundwater are now available (See Table 2).
This water infrastructure has been designed and built to provide an overall volume in the region of 10 billion m3 in a year with average rainfall year.
This infrastructure provides significant benefits to the Algerian economy. This can be seen in the strategic role of the contribution of the sectors associated with dams to the country’s water and food security, the growth in farmers’ incomes, employment, the opening up of different regions, and access to various public services (drinking water, etc.).
2.2.1 Drinking Water
Over the last three decades, the Algerian government has operated an ambitious policy of securing drinking water supply to all in towns and cities, reaching a coverage rate of 95% in rural environments.
The drinking water production capacity for urban areas multiplied by 2.5 between 1999 and 2012, reaching 3.1 billion m3 per year [5].
Everyone has access to drinking water in urban areas. The urban population served now exceeds 36 million inhabitants, 95% of whom are supplied by individual connections.
The Table 3 summarizes the progress made in the drinking water sector.
2.2.2 Sanitation and Wastewater Treatment
The sanitation sector in Algeria lagged significantly behind until 2000, due to the low priority given to wastewater management issues and operator regulation.
As part of the Millennium Development Goal associated with sanitation, Algeria produced a National Program for Liquid Sanitation and Wastewater Treatment (PNA) in 2005. The result of the investigation into the sewage system at the end of the second half of 2012 reported 43,000 linear network kilometers in service. The national average connection rate calculated on the basis of the average connection rate of 48 provinces is 87%, for a total volume of wastewater discharged of 1.2 billion m3/year [8].
Since its launch, a significant quantitative step has been made in terms of numbers of sanitation and wastewater treatment projects and the volume of investment in this sector. The government’s political will was implemented with increased financial resources allocated to the PNA under the Algerian Finance Acts, and contributing partners showed a keen interest in this program and agreed on funding and significant assistance to get it launched.
The impact of this program can be summarized as follows:
-
Reduced pollution on the Mediterranean and Atlantic coast, since almost all wastewater from towns and cities discharged into the Mediterranean Sea and the Atlantic Ocean will be treated.
-
Almost all wastewater discharged from towns and cities into watercourses will be treated. Treatment of this wastewater and taking into account the environmental aspect of water resource management will lead to an improvement in surface water quality.
-
Increasing the water potential which could be used in the development of irrigation. The National Water Resources Strategy, defined in 2009, estimated this potential at approximately 1.2 billion m3 per year in 2014 to be reused in watering golf courses and green spaces as well as for irrigation of crops that are suited to it.
2.3 Future Water Demand for the Supply of Drinking and Industrial Water
Forecasts for future domestic water use are based on population growth, rural to urban migration, and water demand per capita projections.
Overall, drinking, industrial, and tourist demand forecasts for the whole of Algeria by 2030 are evaluated at 3.5 billion m3 (See Table 4).
2.4 Non-conventional Water Resources Projection
Non-conventional resources primarily consist of artificial groundwater recharge, seawater desalination, and treated wastewater.
The Algerian National Strategy for Development of Water Resources gives a significant place to the exploitation of non-conventional water resources.
This strategy estimated the proportion of this resource at around 1.624 billion m3 per year, of which 824 Mm3 are from seawater desalination and around 800 billion m3 are from wastewater.
The forecasts are levels in 2030 to nearly 3 billion m3. This water potential is intended to be used for watering green spaces and sports fields and developing irrigation around urban areas.
The Table 5 presents the anticipated contribution of desalinated seawater and treated wastewater.
3 Electricity in Algeria
In Algeria, the forecast for electricity demand is established by the system operator (SO) Sonelgaz Subsidiary.
Based on the country’s energy policy, the OS matches supply to demand in two steps:
-
An initial step to study electricity demand
-
A second step to define an equipment program to satisfy that demand at the lowest possible cost
Study of the Demand
In general, the SO conducts a detailed analysis of past consumption trends (at the national level, by sector, by branch, by voltage level, etc.) to shed light on the different factors that determine demand and assess how they affect it.
-
1.
Retrospective analysis of demand
First, a retrospective analysis of the demand is developed. Generally, a 20-year period is considered for the analysis of overall electricity consumption to detect an overall trend and variation in average annual growth. This variation is compared to the average rate of economic growth during the study period and to population growth [9].
The analysis is based on:
-
A calculation of the elasticity of the electricity demand to GDP
-
A comparison of the population trend index, GDP, and electricity consumption over the period studied
-
An analysis of electricity consumption per capita, considered as representing the economic and social dynamics in Algeria
-
An analysis of the characteristics of the electricity demand, overall and by sector
The OS finds that the electricity sector has registered a steady increase in demand over the last decade, due mainly to the increasingly widespread electrification of the country, to government urbanization efforts, to the improvement in household incomes, and to the implementation of large-scale infrastructure projects in various regions of the country.
The relevant OS departments examine the fine detail of changes in demand at peak times and seek to highlight the main reasons for these changes, largely caused by a sharp increase in residential consumption.
The OS’s electricity sales history is broken down automatically and a customer analysis performed, making a distinction between OS direct clients and distributors’ clients (state distribution companies and concession holders). The impact of the different energy saving campaigns and actions is also considered.
Over the last 20 years (1992–2012), overall electricity consumption has more than tripled, far exceeding economic and population growth.
The elasticity of electricity demand to GDP, estimated over this period, is almost two units. Over a period of two decades, the growth rate of electricity consumption has continuously exceeded GDP and population growth rates, and the difference has become more pronounced since 1998 [9].
For the same period, electricity consumption per capita increased from 721.53 kWh per capita in 2001 to around 1,406 kWh per capita in 2012, equivalent to an average annual increase of 6.25%. The graph below traces these developments.
Moreover, between 2002 and 2012, electricity demand increased from 20.53 to 54.09 GWh, reflecting an average annual growth rate of approximately 9.5%. (See Figs. 1, 2 and 3).

Evolution of the power consumption (Twh)
It should be noted that this growth has been uneven, however, as illustrated in the graph below: moderate growth between 2000 and 2005, followed by a period of burgeoning demand for electricity from 2006 to 2012, with an annual average of 10% reflecting the economic and social dynamism experienced by Algeria, in particular in terms of increased access to basic infrastructure.

Distribution of electricity consumption by activity sector in the year 2011
The peak maximum power demand increased from 3,913 MW in 2001 to 8,850 MW in 2011 and 10,464 MW by 2013. This represents an average annual growth rate of 8% over the first 10 years (2001–2008) and 12% for the second period (2009–2013). In 12 years, the peak maximum power demand has thus experienced an average annual growth rate of 9.35%.

Electricity demand growth rate trend
-
2.
Projected electricity demand
Projections of demand are established over long periods and revised for short- and medium-term periods.
For the short term, demand forecasts are automatically revised to reflect the needs expressed by the different client segments, whether direct clients or those of public or private distributors.
For the medium and long term, forecasts of changes in electricity consumption reflect a combination of various types of factors relating to the economic activity, demographics, user behavior, technical progress, development of new uses of electricity, the relative market shares of energy, and energy conservation.
Planning to incorporate these factors into long-term forecasts is based on a detailed breakdown of electricity consumption into segments, performed as follows:
There is an initial distinction between the industrial, service, and residential sectors in total consumption.
Within these areas, further divisions are made, by a branch of economic activity (agriculture, manufacturing, etc.) and by use.
For each branch or use, characteristic technical-economic variables are identified in order to calculate energy consumption (ownership rates, unit consumption of appliances, number of households, neighborhood, etc.).
From this detailed segmentation analysis, the choice of assumptions about changes in characteristic descriptive variables can be used to predict consumption for each branch or use. The consumption forecasts thus obtained for the different segments are then aggregated to arrive at forecasts for each sector.
To guard against the growing uncertainties about changes in the energy and socioeconomic environment, three macroeconomic scenarios are considered, selected on the basis of the report from the Algerian High Commission for Planning, entitled “Economic growth and human development: Elements for strategic planning 2011-2017” [9].
By 2017
The “emergency scenario” was adopted as a baseline for developing the equipment plan. This scenario predicts a 7% increase between 2012 and 2017, leading to a net energy demand of 75.79 TWh by 2017. In this scenario, growth is driven mainly by the development of services and tourism in the service sector and by construction in the secondary sector. Growth in the residential sector is also extremely strong as a result of demographics, urbanization, and, especially, the development of new specific uses.
The “economic efficiency prioritization scenario” involves an 8% growth rate of net energy demand between 2012 and 2017, resulting in net energy demand of 79.4 TWh by 2017.
The “exhaustion scenario” predicts a 6% energy increase between 2012 and 2017, limiting consumption to 72.32 TWh in 2017 [10].
By 2020
A “segmentation” study, through the identification and consideration of different factors explaining the changes in electricity demand, conducted by Sofreco, analyzes the economic and social contexts that prevailed during the past period and plausible future changes for Algeria, in the light of its potential but also regional and international opportunities and constraints.
The study was set in the context of the scenarios mentioned above. Each of these identifies a plausible situation that could describe possible future electricity consumption trends.
These three scenarios were constructed based on the determining factors considered as explanatory of the electricity consumption of the different sectors.
Thus, the emergency scenario is characterized by 6% annual growth between 2017 and 2020; the economic efficiency prioritization scenario would involve an annual growth rate of net energy demand in the region of 7.2%; the exhaustion scenario would see an average annual increase of 5.2%.
By 2030
It is assumed that by 2030 a form of saturation will have occurred in a number of sectors of economic activity, that consumption in the residential sector will have stabilized, and that tangible effects of the energy efficiency policy will be felt throughout the country.
At this point, then, the emergence scenario would be limited to the growth of 4.2% per year and the economic efficiency prioritization scenario, 5.5% per year, and the exhaustion scenario would not exceed an average annual rate of 3.5%.
The growth in consumption at the various dates quoted above is summarized in Table 6.
Study of the Supply
The aim is to develop a production facilities equipment program to meet, at minimum cost and according to predefined quality and continuity of service criteria, changes in demand.
The development of the equipment program takes account of:
-
The continued development of national primary energy resources
-
The diversification of external fuel supply sources
-
The quest for greater energy efficiency
It is determined by minimizing the sum of the following discounted costs:
-
Investment costs
-
Operation and maintenance costs
-
Fuel costs
-
Cost of energy not served
It takes into account a number of constraints and criteria, including:
-
Satisfaction of priority irrigation and drinking water needs
-
Satisfaction of energy demand
-
Monitoring fluctuations in power demand (load curve)
-
Planned and unplanned outages
-
The reserve margin
The Electric Power Supply
In late 2011, the total installed capacity of the generating facilities was estimated at 11,389.8 MW. The park existing at that date is detailed in Table 7.
The installed capacity increased from 1,852 MW in 1980 to 5,600 MW in 2001, peaking at 11,389.8 MW in 2011. This resulted in an average increase in capacity of 178.5 MW per year between 1980 and 2001 and of around 526.35 MW per year between 2001 and 2011. The additional capacity changes in increments that are easier to view in Table 8.
New Electricity Strategy
The Algerian power sector is facing many challenges related to security of supply, diversification of energy sources, organizational and legal aspects, as well as strategic planning.
For this reason and in accordance with the country’s government guidelines, the Ministry of Energy named the electricity sector as one of its major concerns to be addressed as part of a vision for the future. The aim is to set as a priority, the adoption of an electricity policy that will generate action plans designed on the basis of a clear vision for reform. These plans are broken down into concrete measures and feasible projects. The overall aim is to ensure competitive power supply in the service of the national economy at all times.
The Ministry of Energy and Mines has involved a broad range of national and international experts along with all stakeholders, to develop documented, widely shared visions of three elements that constitute the foundations of the national power strategy:
-
Changes in domestic demand and potential major discontinuities
-
The advantages and constraints specific to Algeria
-
The economic and technical characteristics of the available power generation technologies
3.1 New Opportunities
-
Considerable Solar Resources
-
With more than 3,600 h per year of sunshine, equivalent to irradiation of 6 kWh/m2 per year, Algeria has a high solar capacity (average equivalent to Southern Europe).
-
Especially high potential in underserved areas in terms of grid and power production capacity.
-
Particularly attractive cost (9% below the reference cost) (See Fig. 4).
Fig. 4 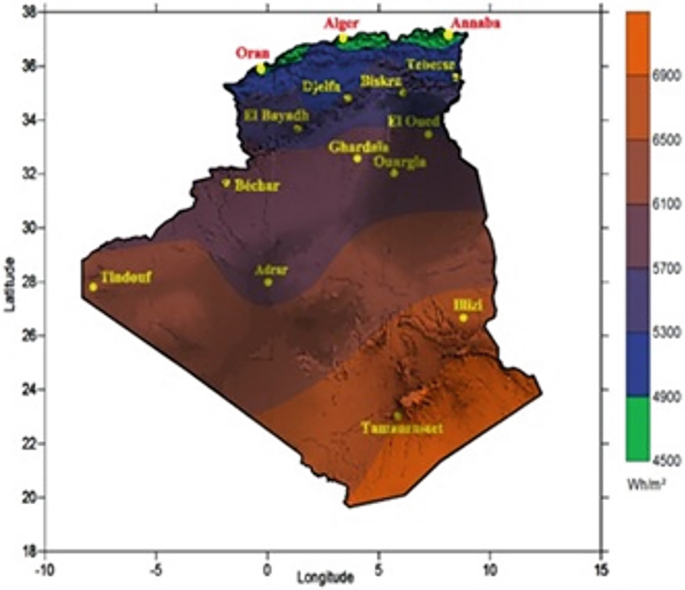
Average annual irradiation in Algeria [28]
-

3.2 Meeting Demand
3.2.1 Meeting Demand for 2013–2017
To meet the demand for electricity, Sonelgaz has programmed an additional power of 8,050 MW by the realization of projects listed in Table 9.
In addition to this power, there are other projects already decided, and their tenders have been launched (See the table below and Fig. 5) [19]:
Site | 2013 | 2014 | 2015 | 2016 |
|---|---|---|---|---|
Labreg (GT) | 1 × 171 MW GT | 2 × 171 MW GT | ||
Ain Djasser 2 (GT) | 2 × 132 MW GT | |||
Boutlelis (TG) | 2 × 258 MW GT | |||
Hassi Messaoud (GT) | 4 × 150 MW GT | |||
Hassi R’Mel (GT) | 2 × 150 MW GT | |||
Ras Djinet 2 (CC) | 3 × 400 MW CC | |||
Ain Arnat (CC) | 3 × 400 MW CC | |||
Total (MW) | 435 | 858 | 900 | 4,400 |

Sites in progress of realization in the South of Algeria
3.2.2 Meeting Demand Beyond 2018 [11]
The additional capacity planned for the period 2013–2023 will amount to 35,505 MW, of which 21,305 MW are decided and 14,200 MW in project idea (conventional type) [11].
The 21,305 MW already decided consist of:
-
5,539 MW of renewable energy
-
14,370 MW of conventional for the Interconnected Grid of North (IGN)
-
50 MW of the gas turbine to In Salah – Adrar – Timimoun
-
421 MW of gas and diesel turbines for the Isolated Grid of South (IGS)
-
925 MW for strategic mobile reserve
The total development program for the production of electricity 2013–2023 will amount to more than 4,791,391 million dinars (more than 2,664,878 million dinars for renewable).
14,370 MW of additional capacity are under construction on the 2013–2017 period, of which 1,140 MW are of Koudiet Eddraouech site (SKD).
Additive to a conventional park, it is expected the realization by SKTM (Shariket Kahraba wa Taket Moutadjadida, subsidiary of Sonelgaz group) of a renewable energy park of 5,539 MW distributed as follows:
Interconnected Grid of North (IGN): 5,084 MW of renewable energy planned from 2013 to 2023 which can be carried out in collaboration with the SSB (Sahara Solar Breeding) project, for example
Isolated Grid of South (IGS): 167 MW of renewable energy planned from 2013 to 2023
In Salah – Adrar – Timimoun: 288 MW of renewable energy planned from 2013 to 2023
Beyond 2023, the various types of electricity generation will be investigated, and the necessary decisions will be taken at the appropriate time, wind farms, solar farms, natural gas power plants, or even the hydroelectric sites.
For Renewable Energy [12]
Until 2030, it is planned to install a capacity of nearly 12,000 MW with 10,000 MW of export opportunity.
The development of renewable energy is a major component of Algeria’s New Energy Strategy, aimed at securing supply, ensuring availability, and reducing the nation’s energy dependence.
Algeria has great renewable energy potential. Exploiting it will cover a substantial part of its growing energy needs and help protect the environment by replacing fossil fuels.
As the technologies mature and their production cost becomes more competitive, the contribution of renewable to the energy mix will expand gradually.
3.2.3 International Trend
A favorable world market:
-
An environment conducive to the development of renewable energy.
-
Technologies in continual development, tending to reduce investment and operating costs and produce competitive kWh or Btu.
-
Uncertainty and extreme volatility of fossil fuels.
-
Environmental awareness and the fight against global warming.
-
A competitive cost per MW for some renewable (including wind) and a downward trend in the medium and long term for others.
-
A high-potential market for wind, solar thermal, and photovoltaic.
-
More than US$ 60 billion invested in 2007 in renewable energy projects worldwide 5.
-
A CO2 emissions market of approximately US$ 233 billion in 2050 (compared to US$ 60 billion in 2007).
-
The total installed capacity in late 2007, all segments combined, was estimated at around 240 GW, excluding large-scale hydropower, equivalent to nearly 6% of global electricity capacity.
-
Wind farms in 2007 totaled almost 100 GW, with the average annual growth of 25%.
-
50 million households worldwide have solar water heating systems, 65% of which are in China. The annual growth in this market is between 15% and 20%.
-
2 million geothermal heat pumps installed.
-
Grid-connected solar photovoltaic is growing constantly.
-
Biodiesel generation is under development.
The annual flows of investment in “renewable energy” technology per period in billions of USD are shown in the Table 10.
-
1.
Constraints to developing renewable energy
Current Situation
-
Capacities for developing renewable energy projects extremely limited compared to the identified potential
-
Marginal contribution of foreign funds
-
Limited government incentives
Constraints
-
Lack of legislative and regulatory framework concerning the development of renewable energy
-
Renewable energy low on the priority lists of national infrastructure development programs
-
Competition from subsidized energy sources: e.g., butane and fuel oil
-
Low level of information and awareness among the general public
-
Lack of research and development that could lead to innovation and technological adaptations
-
“Project” approach not creating visibility for potential investors or deployment of suitable financial mechanisms
-
Budget allocations and financial incentives insufficient for real development of the economic, social, and environmental added value of renewable energy
-
2.
Renewable energy development strategy
The new energy vision is structured around the following points:
-
Renewable energy: a major aim of the New Energy Strategy
-
A diversified national energy mix aimed at developing renewable energy on a market basis using four strategies:
-
Progressive development of power purchase agreements (PPA)
-
Promotion and development of large-scale projects for exporting green power
-
Development of self-production
-
Strengthening the capacity of the grid
-
-
Contribution to reducing energy dependence
-
Controlled expansion of energy resources to support economic development
-
Positioning Morocco in regional and international renewable energy and energy efficiency markets
-
Development of renewable energy equipment and facilities industry
-
-
3.
The objectives of the new strategy
-
Contribution to diversifying and securing supplies
-
Sustainable human development: widespread access to energy and creation of income-generating activities
-
Control of energy costs to ensure the competitiveness of domestic production
-
Optimization of the electric load curve
-
Environmental protection: control of growth in greenhouse gas emissions, 60% of which is from energy production
-
Conservation of natural resources: water, forest cover, biodiversity, combating desertification
-
Economic development and investments
-
The industrial rise of a new sector, regional positioning to win
-
Increased mobilization of international cooperation and strengthening regional partnerships (Euro-Mediterranean, African, Arab)
-
4 Energy Needs for Water
Electrical energy is used mainly for the operation of pump and injection stations for drinking, industrial and irrigation water, drinking water treatment plants, and activated sludge wastewater treatment plants. It is also used for lighting and for pumping in marine outfalls (See Fig. 6).

The evolution of consumption in GWh (International Symposium of the 9th edition SIEE-Pollutec 2013)
Overall, the water sector in 2011 consumed around 4,983 GWh. This consumption is set to rise to 16,090 GWh by 2030 (0.7–0.8 kWh/m3), more than three times the consumption of 2011. This predicted increase is mainly due to:
-
The use of energy-intensive solutions – e.g., seawater desalination and the water transfer project.
-
Use of conventional, high energy-consuming resources to meet water demand. This is the case of water pipes for drinking water supplying the cities.
-
Development of sanitation and wastewater treatment activities (See Table 11).
Table 11 Evolution of energy consumption in the water sector
4.1 Current Need
These needs, collected from water users, seem to be in the region of 4,983 GWh, or 0.44 kWh/m3.
4.2 Energy Needs by 2030
These energy requirements were evaluated on the basis of current needs and the provisions adopted regarding usage of conventional and unconventional water resources, water saving programs, drinking water generation programs, sanitation and wastewater reuse programs, and programs aimed at water conservation and expansion of irrigation.
4.2.1 Drinking Water
Energy requirements were estimated on the basis of current needs and drinking water supply projects adopted in connection with planning studies. These energy needs are estimated at around 2,606 GWh, or 0.90 kWh/m3:
-
Seawater desalination, These needs are estimated at approximately 1,642 GWh, or 3.7 kWh/m3.
-
Use of energy-consuming drinking water supply systems.
4.2.2 Sanitation
Electrical energy is used mainly for the operation of activated sludge wastewater treatment plants (in lagoon-based wastewater treatment plants (WWTPs), it is used for pumping and sometimes for treatment), for network pumping, and for lighting. It is also used for pumping in marine outfalls.
The electrical energy estimate is based on the following assumptions:
-
The activated sludge purification process was adopted for WWTPs serving more than 100,000 inhabitants. The power consumption for these WWTPs was calculated on the basis of 1 kWh/kg BOD5 eliminated.
-
The lagoon-based purification process was adopted for all other towns and cities. The power consumption for these WWTPs is negligible. The National Sanitation Plan has estimated this consumption at around 10% of the consumption of WWTPs that use activated sludge.
On this basis, the National Water Plan estimated the energy requirements for sanitation and wastewater treatment at 397 Gwh by 2030.
This data does not take into account energy needed for wastewater reuse (additional treatment, pumping water to the place of use, etc.).
4.2.3 Irrigation
Overall, the water needs of the agricultural sector are estimated at around 9,193 GWh per year. The assumptions used in estimating these water needs can be summarized as follows:
-
Current (2011) energy needs of agricultural areas are estimated at 1,513 GWh per year [31].
-
The energy requirements of extensions to agricultural areas.
4.2.4 Wastewater Reuse
Overall, the energy requirements of wastewater reuse projects are estimated at around 800 GWh, or 0.7kWh/m3.
The assumption used to estimate this need is:
-
Reusing a volume of treated wastewater in the region of 1,200 Mm3 per year for watering golf courses and green spaces as well as for irrigation of those crops that are suited to it
5 Desalination Station of El Magtaa (TMM) of Oran as a Case Study of Photovoltaic Power Plant
TMM which stands for “Tahlyat Myah Magtaa” is a project of stock company established for the desalination of seawater by reverse osmosis on the site of Marsat El Hadjadj plant in Oran [25] (See Table 12).
The principal shareholders of TMM are Hyflux Singaporean Society with 49% of the social capital and AEC Algerian Energy Company with 51% of the capital.
Funding for the project was carried according to the “Project Financing” principle, whereby the debt repayment is made from income from the sale of produced water.
The choice of El Magtaa Oran station was made for his large consumption of electric power and its strategic location, next to one of the largest industrial areas in Algeria (Arzew), which is itself a major consumer of water and electricity, in addition to current disturbance of the electrical grid in this region.
6 Photovoltaic Generator
Photovoltaic conversion occurs by submitting the photovoltaic cell to sunlight. The energy received causes a chaotic motion of electrons within the material of the cell. The latter are connected in series and encapsulated in modules and watertight panels which protect them from moisture, shock, and nuisances [13].
The installation for TMM Oran consists mainly of photovoltaic generators placed on metal supports and a connection to the MV grid (30 KV) of Sonelgaz. The source selection is made such that the system can continuously provide the energy needed by the station (See Fig. 7).

7 Simulation and Results
Our application is made on one module of 21,000 m3 from the 25 identical of the station of TMM.
Each module has a connection to the grid of Sonelgaz (30 KV).
A feasibility study was conducted and allowed to provide all the technical and financial elements to the project owner and the person who commissions (a funding agency, bank, credit company, etc.) allowing the realization of the plant.
This study has:
-
1.
Estimated the expected production is taking into account environmental constraints
-
2.
Evaluated the possible constraints of the connection to the grid due to the location of the site (end of the line, bad grid, etc.)
This has led to the following results.
-
The geographical coordinates of the site are [14]:
-
Latitude: 35° 47.2 min North
-
Longitude: 0° 9 min West
-
-
The minimum irradiance at 45° of the site of TMM according to data from NASA was that of December, it was 2.40 kWh/m2/day (RETSCREEN [15]).
-
Energy consumed per month for each module (Sonelgaz billing during the test period) (Billing of Sonelgaz) was Ec = 67,423,479 kWh/day
7.1 Sizing
The dimensioning calculations [16] led for each module of TMM to a generator with the following features [17]:
Pc = 46,824 MW
-
Number of panel = 164,295
-
Type of connection
-
Parallel branches = 1,217
-
Serial panel = 135
-
Panel selected
Condor CEM285P-72 type poly-crystalline 30,010.50 DA:
-
UPS chosen: Condor 50 KW Solar Inverter.
-
Total area of the panels is 25 × 31.8724 = 796.81 hectares.
-
Total approximate investment cost is 25 × 140.76 € = 3519M€ [32, 33].
Storage:
After a metrological study, the storage should be provided for at least one-half day by large tanks of water of 250,000 m3 while the station currently has only 40,000 m3.
7.2 Results and Interpretation
The simulation was carried out under MATLAB/Simulink shown in Appendix 2.
As our study is composed of two parts, the first supports the photovoltaic generator; the second supports the cost of m3 of water produced.
The analysis begins with a presentation of the results of our photovoltaic generator outputs and voltages delivered to the load to ensure the smooth functioning of our PVG (photovoltaic generator).
On the results of Fig. 8, we see the effectiveness of our generator. The time of responses of the transitional regimes is very acceptable especially for the application for which we are interested (desalination of El Magtaa) because the maximum of power is reached in 0.4 s (Fig. 9).

Simulation results of (PVG) with MPPT for the irradiance of 1,000 w/m2
To validate our model, we tested our generator for various irradiance values.

Simulation results for different irradiance values
Simulation results obtained show again the effectiveness of our generator to produce the maximum power and that it follows the command regardless of the irradiance changes, 46.55 × 10³ kWh for the irradiance of 1,000 w/m2 and 36.88 × 10³ kWh for 800 w/m2 of irradiance. These results are acceptable from the standpoint of system stability. The form of the signals delivered by the PVG confirms the effectiveness.
The AC (Alternative) simulation results are given by the curves of Fig. 10.
Figure 10 presents the results of the injection of power to Alternative bus (AC bus), and they are very acceptable especially at steady state (permanent) where the frequency of 50 Hz is respected and the rms values of the voltage and current are 6 KV and 5.16 KA, respectively, with the perfect sinusoidal waveforms realized with the adjustment of the filter of connection.

Simulation results of the injection to the Alternative bus (AC bus)
8 Cost of Desalination
The estimation of the cost of desalination to this day and for the future is very important to know the feasibility of solution of desalination compared to other solution of augmentation of drinking water like surface water, groundwater, transfer, recycling of wastewater, and water conservation (See Fig. 11).

Decomposition of the production cost per item of expenditure
It should be noted that the contractual price of m3 of water of the project with the connection to the grid of Sonelgaz is 45 DA/m3 the equivalent of 0.43 €/m3 [18].
The decomposition of the production cost per item of expenditure is shown in the following figure [7].
8.1 Estimation of the Cost of Water with the PV Generator
So the new cost of m3 is estimated at 374 DA.
From the results, we note that the investment is colossal 3.5 billion euros, and the price of m3 of water is very expensive, making the subvention a compulsory thing (See Table 13).
Finally another aspect that intrigues me is that all the arguments are based on the cost of kWh or Wc provided by a photovoltaic cell.
Is this the correct variable to consider?
Of course the “money” is an encompassing variable to take into account the hidden settings and often indistinguishable, whereas if we imagine that the unrestrained race for superfluous is deadly, it is necessary to take time to equip a part of our country by solar panels.
It is also essential to use which is the better at each stage and not which is less expensive. The installations will have a greater lifespan and maintenance costs will be reduced. The gradual installation lets also to size the production plants at reasonable size: they will provide only the replacement of old equipment when the PV array is finished.
9 Conclusion
To cope with population growth and economic development, energy and electricity demand in Algeria will increase substantially between now and 2030.
In the absence of a rigorous energy efficiency policy, the energy sector’s water requirements will be also envisaged in terms of electricity generation in hydroelectric plants (dams), as make-up water for cooling in classic thermal power stations, and cleaning for the hybrids stations (solar-stream) particularly for those located in the country’s interior (Sahara).
Solar photovoltaic is used very widely and since a long time for pumping water. For example, the site of El Hamrawin in Egypt commissioned in 1981. This station used the mechanical energy of a thermodynamic solar pump (SOFRETES), now replaced by a photovoltaic generator.
On the other hand, for desalination, there are quite of few realizations in photovoltaic, probably due to high costs. However, we can mention in our country the unit of Hassi Khebi with reverse osmosis associated with a PV generator.
Solar thermal energy is economically more competitive; there are already a significant number of achievements. In the Mediterranean, there are solar stills particularly hothouse type in Greece and Spain. Tunisia provides for the use of solar energy in 45 new desalination plants in areas of the South whose Medenine, Tataouine, Kébili, and Ksar Ghilane.
Finally, Tahlyat Myah Magtaa Spa is in front of a very promising project of technology watch which can be combined with other projects such as the SSB (Sahara Solar Breeding) project in order to optimize the investment and its damping as quickly as possible.
References
Document of Algerian Ministry of Water Resources (2012) Surface water resources mobilization
Document of Algerian Ministry of Water Resources (2012) Underground water resources mobilization
Algerian Desalination Program (2012) Large and small stations; DAEP
Document of Algerian Ministry of Water Resources (2012) The action plan 2010–2014; Mobilization and demineralization of brackish
Document of Algerian Ministry of Water Resources (2013) Indicators in drinking water
ABHS (2013) Retrieved from www.abhs.dz/php/fr/contacts.php
Ait Mimoune H, Stambouli A (2014) The desalination in Algeria
Document of Algerian Ministry of Water Resources (2012) Updating the inventory of national sewerage network
DOCPLAYER (2015) Retrieved from docplayer.net/12680630-Adaptation-of-the-water-energy-system-to-climate-c
SCIENCEDIRECT (2014) A review of the water-energy nexus. Renew Sust Energy Rev 65:319–331. www.sciencedirect.com/science/article/pii/S1364032116303471
SONELGAZ (2013) Copyright © SONELGAZ 2013 www.sonelgaz.dz/?page=article&id=13
Document of Algerian Ministry of Energy and Mines (2011) Program of renewable energy and energy efficiency, Design and realization by SATINFO (Sonelgaz)
CONDOR (2013). Retrieved from www.condor.dz28
MAPS.GOOGLE (2013). Retrieved from maps.google.dz/maps?hl=fr&tab=wl
RETSCREEN (2013) Retrieved from www.retscreen.net/fr/news_20130711_nasa_near_real_time_weather_data.php
Jean-Marc Cottier, André Mermoud (1996) Photovoltaic power plants. Guide for the design and implementation of projects for the use of engineering firms, edition PACER
Chikh M (1994) Conceptual analytical study of photovoltaic power systems suitable for isolated sites in Algeria, Magister thesis, CDER
DJAZAIRESS (2013) Retrieved from www.djazairess.com/fr/elwatan/90856
Accounts Consolidated of Sonelgaz (2012) Activities report and management
Document of Algerian Ministry of Water Resources (2012) Agricultural water
Hespul (2014) Photovoltaic publications. http://www.hespul.org
Moine G (1991) The solar photovoltaic electricity. UNESCO, Paris, France
Attar M, Hammat M (2011) The hydrocarbon potential of Algeria, document of CHLUMBERGE-SONATRACH-, cument of Algerian Ministry of Water Resources (September 2012), “Note on the work of agricultural hydraulics”
Benblidia M, Antipolis S (2011) The efficiency of water use and economic approach National Study Algeria, in Technical Union of Electricity (2002). NF C13-200: High Voltage Electrical
National Energy Balance (2012) Algerian Ministry of Energy and Mines, 2013 edn
Kasbadji Merzouk N, Merzouk MR (2011) Prospect of wind pumping. CDER Bouzaréah Algeria, Algiers
PHOTOVOLTAIQUE (2013) Retrieved from http://www.photovoltaique.info (Last update: 18 Feb 2014)
Portail.cder (2015) Retrieved from portail.cder.dz/spip.php?article1155
Presentation of the National Agency for the Promotion and Rational Use of Energy (2013) Energy efficiency in the use of hydraulic systems. International symposium of the 9th edition SIEE-Pollutec, May 2013
Fourrager P, Nedjraoui D (2001) (USTHB)
Document of the Ministry of Water Resources (2012) State details of irrigated operating perimeters, p 10
Presentation of Algerian Ministry of Water Resources in Cairo (2012) Strategy and indicators of water sector in Algeria
Cherfi S (2011) Energy future of Algeria. Faculty of Economics and Commercial Sciences and Management Sciences, University of MohamedKhider-Biskra, Biskra, Algeria
Author information
Authors and Affiliations
Corresponding author
Editor information
Editors and Affiliations

Rights and permissions
Copyright information
© 2020 Springer Nature Switzerland AG
About this chapter

Cite this chapter
Hamiche, A.M., Stambouli, A.B., Flazi, S., Tayeb, A. (2020). Desalination in Algeria: Photovoltaic Power Plant for TMM (Tahlyat Myah Magtaa) of Oran as a Case Study. In: Negm, A.M., Bouderbala, A., Chenchouni, H., Barceló, D. (eds) Water Resources in Algeria - Part II. The Handbook of Environmental Chemistry, vol 98. Springer, Cham. https://doi.org/10.1007/698_2020_538
Download citation
DOI: https://doi.org/10.1007/698_2020_538
Published:
Publisher Name: Springer, Cham
Print ISBN: 978-3-030-57886-2
Online ISBN: 978-3-030-57887-9
eBook Packages: Chemistry and Materials ScienceChemistry and Material Science (R0)