
Abstract
The study of a reliable series of sunspot observations has allowed formulation of a scenario for the sustainable development of solar cyclicity over the past ~190 years. This scenario predicts a change in the level of sunspot activity in epochs of increased or lowered solar activity with selected transition periods, which gives three different modes of the total magnetic field generation of the Sun with a duration of approximately five cycles. Since January 2020, the 25th solar cycle has begun with the expected average magnitude according to the development of the first 3 years and the Gnevyshev-Ol’ rule. Therefore, an attempt has been made to study the observational characteristics of a family of average solar cycles in different epochs of solar activity, i.e., the 13th, 15th, and 25th epochs of lowered solar activity, the 10th and 20th epochs of increased solar activity, and the 17th and 23rd transitional periods between the epochs.
1 INTRODUCTION
Cycles of solar activity (SA), the most remarkable feature of the Sun, are regular, almost periodic, changes in all known solar indices. They characterize the entire complex of phenomena on the Sun. The study of the characteristics, the course of development, the distinctive properties of individual solar cycles (SCs), and the rules of their alternation will allow one to approach the construction of a model of solar cyclicity and identify the main physical SA patterns over time, thus approaching the long-term prediction of subsequent solar cycles. The correct solution of these problems requires reliable observational material and knowledge of the conditions and limits of applicability of the reconstructed series of observations. Regular observations of sunspots began to be performed by several observatories in Europe since 1849, when the 11-year periodicity of SA was finally revealed. These studies determined a reliable series of sunspot numbers (1849–2023) from the middle of the 9th to the 25th SC. In addition, R. Wolf restored the average monthly values of this index up to 1749 (numbered series) and the average annual values up to 1700 according to fragmentary data from individual European observers. The authors (Ishkov and Shibaev, 2006; Shibaev and Ishkov, 2012) compared the reliable and reconstructed series and verified their consistency. The spectral characteristics of the reliable and restored series, as well as the corresponding parts of the entire numbered series of relative sunspots, differ significantly and almost all artifacts and differences are concentrated in the restored part of the numbered series. This conclusion shows that for the practical study of the influence of SA on various natural and technological processes and the identification of real patterns of solar cycling, it is possible to use only the reliable series, whose basic structure is stable over the entire range of action. At the same time, the statistics of reliable SCs can conditionally include cycles 8 and 9, which are adjacent to reliable cycles and do not contradict the main SC characteristics of the reliable series (Shibaev and Ishkov, 2012), thereby increasing the statistics to 18 cycles of SA (~190 years).
The main result of studying the reliable series of the relative numbers of sunspots is the identified scenario of the sustainable development of solar cyclicity. This scenario provides three consecutive intervals of changes in the level of sunspot-forming activity and includes epochs of increased and lowered SA with clearly distinguished transition periods. The models of sunspot-forming activity in this scenario require three different modes of generation of a total magnetic field (MF), which can be determined by the minimum background values of the poloidal component in the phase of the minimum SC according to observations of the general MF of the Wilcox Solar Observatory (WSO) in Stanford, United States [http://wso.stanford.edu]. The duration of each epoch (about five cycles) is 130–140 years, which include a full cycle of implementation of all three modes and two transitional SCs (before the beginning of the epoch of lowered SA and between epochs).
The smoothed areas of sunspot groups (averaged for the corresponding epoch) clearly show the fundamental difference in the sunspot formation processes in different epochs of the solar system (Fig. 1). The curve for SC 24 is constructed separately and clearly attributes this cycle to the epoch of lowered SA. The mode of lowered SA leads to the formation of a sequence of low and medium SCs, whereas the mode of increased SA contributes to the appearance of a sequence of high and medium SCs. Within the epochs, all observational patterns and rules of the sequence of SC development are preserved. The development of the past SC 24 and the initial stage of SC 25 confirm that the solar activity has entered the second reliable epoch of lowered SA, i.e., the next five SCs should be of low and medium magnitude. The current SC 25 began in January 2020 and, in the course of development for three years, falls into the family of medium-sized SCs according to the Gnevyshev-Ol’ rule. This rule for reliable SCs was violated only during the transition from the epoch of increased to the epoch of lowered SA when the even SC 22 of increased SA became higher than the odd transitional SC 23 (Ishkov, 2012). Therefore, it becomes relevant to study the characteristics of the entire observational set of average SCs of various epochs of SA, i.e., lowered (13, 15, and 25), increased (10 and 20), and transitional (17 and 23) solar cycles.

The epochs of increased and lowered SA in the areas of sunspots smoothed over epochs (ordinate axis). The upper bold line is for the epochs of increased SA (SCs 18‒22) with the addition of two transition cycles (SCs 17 and 23). The lower bold line is for the epoch of lowered SA (SCs 12–16). The bold gray line is for past SC 24. The dotted lines reflect the spread of values for the corresponding epochs. The abscissa axis shows the months after the minimum point. The drawing was adapted from http://users.telenet.be/j.janssens/SC24web/SC24.html.
2 THE GENERAL CHARACTERISTICS OF MEDIUM-SIZED SOLAR CYCLES
The solar cycles that are characterized by the maximum values of the monthly smoothed relative numbers of sunspots in the range of \({\text{W}}_{{{\text{max}}}}^{*}\) = (80‒140) ± 5 in the classical V1 system and \({\text{W}}_{{{\text{max}}}}^{*}\) = (140‒200) ± 10 in the V2 system introduced since July 2015 (Clette and Lefèvre, 2016) are considered as the cycles with average values (Fig. 2). In this work, the classical version V1 is used. Table 1 presents the main characteristics of all reliable SCs of the average value for the SA epochs with two cycles for each epoch. Since the statistical data of the reliable number of solar cycles are still very small, we can only talk about the trend in the observed changes in the data. Whether this trend will turn into a true scenario of solar cycling, will depend on the further accumulation of observation statistics of SC. However, at the moment, its use has allowed us to give a correct forecast for the development and characteristics of SC 24, the initial stage of development of SC 25, and subsequent SCs of the 21st century.

Solar cycles of average magnitude. Thin lines are the average monthly values of the relative numbers of sunspots; thick lines are smoothed over the year. The upper row is for the epoch of lowered solar activity; the middle row is for the epoch of increased solar activity; the lower row is for the cycles of transition periods. The step of 0.5 years after the minimum point is on the abscissa axis. The drawing was adapted from http://www.solen.info/solar/cycles1_to_present.html.
The features of the development of SCs according to duration were considered in (Ishkov, 2020). The author has shown that all reliable SCs are divided into two classes. The first class is SCs, the duration of which exceeds 11.25 years (135 months) and, from the sample of the medium-sized cycles, includes cycles 10 and 13 of the 19th century, 15 and 20 of the 20th century, and 23 and 25 (with a high probability) of the 21st century. The family of medium-sized SCs according to belonging to the SA epochs was distributed as follows:
— SC 13 and, most likely, 25 to the epochs of lowered SA;
— SCs 10 and 20 to the epochs of increased SA;
— SC 23 of the transition period to the epoch of lowered SA.
The second class with a duration of ≤11 years from the family of cycles of average magnitude includes:
— SC 15, whose duration was 10.1 years of the first epoch of lowered SA;
— transitional SC 17 from the epoch of lowered to the epoch of increased SA with a duration of 10.5 years.
It should be noted that the durations of all cycles of the 20th century, excluding SC 20, were 10.5 years or less. The reason for this phenomenon is still unknown but this fact must be taken into account when constructing a model of solar cyclicity.
The main feature of SCs 20 and 10, which fell into the epochs of increased SA of the first class, is a prolonged descending phase of decline and a short corresponding phase of the minimum (19 and 20 months). The minimum phase here refers to the time interval when the smoothed values of the relative numbers of sunspots remain within W* ≤ 30. The minimum phase is common for the current SC and subsequent SC; however, we refer the minimum point to the completed SC. In this paper, we distinguish and specify the time intervals of the minimum phase from the beginning of the cycle to the point W* = 30 (the phase of the minimum of the growth branch) and the subsequent phase of the minimum after the maximum of the cycle from the point W* = 30 and to the end of the cycle (the phase of the minimum of the decline branch).
A comparison of the evolutionary changes in various cycles in the phases of the minimum (Fig. 3) allowed us to distinguish two groups of SCs according to the rate of decline with characteristic times of (13 + 10/‒3) and (39 + 0/‒5) months. The first group from our sample included SCs 10, 17, 20, and 23. The second group included SCs 13 and 15 from the first epoch of the lowered SA. The main feature of SCs 20 and 10 is the prolonged phase of decline before the beginning of the minimum phase and the short phase of the minimum (19 and 20 months). The rule of the short phase of the minimum of the decline branch remains even for long-duration SC 20. The transitional SCs to the epochs of lowered SA and strictly cycles of lowered SA belong to the long-duration cycles precisely because of the prolonged phase of the minimum of the decline branch. The average interval of the minimum phase duration for these cycles is 41–47 months, but SC 13 was extremely prolonged (57 months).

The distribution of the duration of the phases of the minimum of reliable SCs. The left bold curve is for cycles of the epochs of increased SA, two transitional (SCs 11 and 23) and SC 16 from the first epoch of lowered SA. The right bold curve for the cycles of the epochs of lowered SA. The bold gray curve is for SC 24. The months after the minimum point is on the abscissa axis. The drawing was adapted from http://users.telenet.be/j.janssens/SC24web/SC24.html#SC2425minimum.
In comparison with the other reliable data, the medium-sized SC values of the epochs of lowered SA have the following general qualitative and quantitative characteristics (Ishkov, 2013):
— lower average initial values of \({\text{W}}_{{{\text{min}}}}^{*}\) (2.9 years) but various duration (12.7 years for SC 23 and 10.1 years for SC 15); the longest of them (SCs 20 and 23) started with the large values of \({\text{W}}_{{{\text{min}}}}^{*}\);
— the duration of cycles on average is 11.4 ± 1.3 years;
— the duration of the growth branches on average is approximately the same (4 + 0.5/–0.4 years);
— the duration of the decline branches on average is also about the same (7.1 + 1.2/–1.0 years);
— the duration of the minimum phase of the growth branch on average is also quite close (4.0 ± 0.9 years);
— the duration of the minimum phase of the decline branch on average has a larger spread (4.6 ± 1.8 years);
— the number of spotless days around the minimum phase of the decline branch is 429 + 508/–160 days; especially the large spread is for the transitional SCs 17 and 23, i.e., the number of spotless days before the epoch of the increased SA is three times less than that before the epoch of lowered SA.
In SCs 13 and 15 of the epoch of lowered SA, the almost equal number of sunspot groups with areas of Sp ≥ 1000 mph (52 and 50) and giant sunspot groups with areas of Sp ≥ 2500 mph (4 and 3) were observed. There were 75 and 3 these sunspot groups, respectively, in SC 20 of the epoch of increased SA. These sunspot groups appeared more often (80 and 8, respectively) in the cycles of the transition period of SC 17 (from the lower to increased SA) but dropped significantly (30 and 1, respectively) in SC 23 (from the increased to lowered SA).
The prolonged minimum phases are those between cycles (56–60 months) and, especially, before low cycles, and in two cases out of three (23–24 and 14–15 months).
3 DEVELOPMENT OF CURRENT CYCLE 25 OF SA
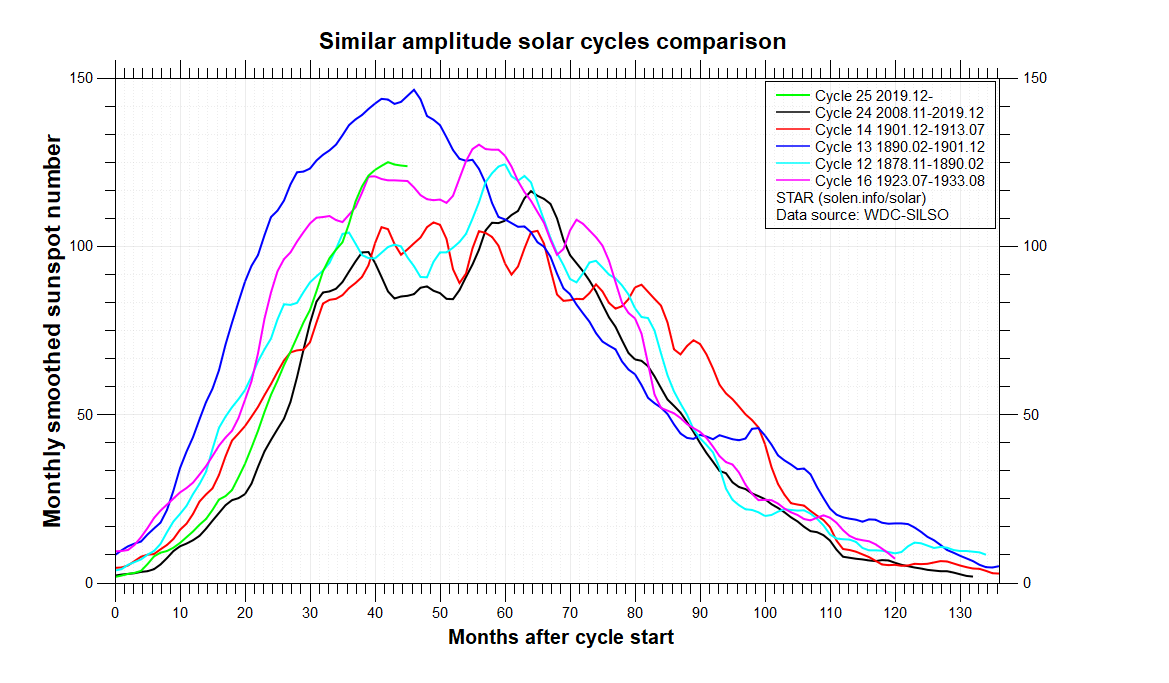
The second cycle of the modern epoch of lowered SA, current SC 25, began in January 2020 with the lowest values of the Wolf number in the entire history of reliable SCs, thereby limiting the duration of the past SC 24 to 11 years (132 months). The pace of its development on March 2023 (38 months) is more consistent with the initial period of the development of the medium-sized SCs (Fig. 4). According to the statistics of reliable SCs (10–24) within the SA epochs, the observational rules and patterns of the SC development were steadily fulfilled. This also applies to the Gnevyshev-Ol’ rule, which predicts that the current SC must be higher than the past low SC 24. Since the beginning of the current cycle, we have been able to use modern methods to study various characteristics of SCs of the epochs of lowered SA (SCs 13, 15, and 25) and compare them with the similar cycles in the epochs of both increased SA (SCs 10 and 20) and transition periods (SC 17 and 23), thus obtaining a complete set of reliable medium-sized SCs with different background values of the total magnetic field of the Sun. This makes it possible to have a sound basis for a deeper study of their development and characteristics for a complete forecast of the characteristics of the SA epochs in the future. During the period under review of the current cycle, SA passed the semi-phase of the minimum (almost 2 years), which is a record for a medium-sized SC and is slightly inferior only to the past low SC 24; SA now entered the growth phase. There was practically no asymmetry of sunspot-forming activity after the appearance of the first sunspot groups with the order of polarity of the current SC (August 2017) until the formal beginning of the cycle. However, with the beginning of significant sunspot-forming activity (October 2020), the active regions of the southern hemisphere began to prevail (17 vs. 3 on December 20, 2020). More sunspot groups have appeared in the northern hemisphere since November 2022 (see [https://sidc.be/images/wnosuf.png]).

The development of the current SC 25 in the SC family of the first epoch of lowered SA. The months after the minimum point is on the abscissa axis. The drawing was adapted from http://www.solen.info/solar/images/comparison_similar_cycles.png.
The first large sunspot groups (Sp max ~1000 mph) appeared on the visible disk of the Sun in the southern hemisphere a year after the start of the current SC at the end of November 2020. The first signs of its appearance and localization on the back side of the Sun came from the GONG helioseismological service network on November 14, which made it possible to predict its exit to the visible disk of the Sun on November 23. The sunspot group was a simple bipolar magnetic configuration with low flare activity (only 10 X-ray flares of class C). By the end of February 2023, more than 500 sunspot groups had already been observed on the visible disk of the Sun.
At the end of February 2023, there were10 X-ray flares of class X (X2.2); 15 flares of class M ≥ 5; and 106 of class M1‒M4.9, which is 115% of flares in SC 24. One proton event caused an increase in ground-based neutron monitors (November 28, 2021) and at least 60 solar filament ejections. Thus, all indicators of the solar activity indicate that the current SC exceeds the past low SC 24 but is significantly inferior to the cycles of the average value of the epochs of increased CA and the transitional cycles 17 and 23 between the epochs. Figure 5 shows the number of solar flare events of X-ray C and M + X classes, which indicates that the flare activity in the first 3 years of the current 25th cycle even exceeds the corresponding values of transitional SC 23. The smoothed daily coronal mass ejection values are slightly lower than those in SC 24 (2.76 vs 3.16). The absolute values during the last few months are comparable to the maximum of the previous SC (about six/day).

The number of X-ray solar flares (the left ordinate axis) of class C (gray) and class M + X (black) in SCs 23‒25 and the Wolf numbers (the right ordinate axis). The drawing was adapted from https://www.spaceweatherlive.com/en/solar-activity/ solar-cycle.html.
Regular observations of solar cosmic rays, solar proton events (SPE), for all the time (since 1969) to date allowed us to study only two full solar cycles of average magnitude, i.e., SC 20 of the epoch of increased SA and SC 23 in the transition between the epochs of increased to lowered SA, and the initial period of SC 25 of the epoch of lowered SA. We compared the initial periods of the development of all three medium magnitude cycles under conditions of elevated (SC 20), lower (SC 25), and variable (SC 23) background values of the total magnetic field of the Sun, which affect the appearance of active regions, i.e., generators of powerful flare events and SPE. This study showed that the generation of solar cosmic rays in current SC 25 sets a record for the number of minor SPEs. At least 19 SPEs occurred on August 2022, with particle fluxes at a maximum of ≥1 cm–2 с–1 ср–1 (G0). The first SPE of the current SC occurred on November 29, 2020 (6.5 pfu), and the first and so far the only GLE event occurred on October 28, 2021 (1.8 years after the minimum). Thus, the current SC 25 sets a record for the number of minor SPEs in the entire history of SPE observations, which indicated the preservation of the facilitated proton yield in small flare events, as was observed in low SC 24, which is the first SC of the second epoch of lowered SA (Bazillevska et al., 2020).
Twenty-five magnetic storms were registered in the geomagnetic field, two of which were large (G3) and one was moderate (G2). The number of geoeffective (with an area of 1% of the visible disk or more and |B| ≥ 1 Gs) coronal holes remains lower.
4 CONCLUSIONS
The working SC scenario for a reliable series of observations of the Sun gives reason to believe that the epochs of lowered and increased SA (∆T ~ 50–55 years, 5 SCs) are interspersed with transition periods (∆T ~ 17 years, ~1.5 SCs), when the total magnetic field of the Sun changes the mode of sunspot-forming activity. This indicates that the solar dynamo operates in two modes, which is reflected in the power and manifestations of all active phenomena in the Sun.
No fundamental differences were found in the physical and statistical characteristics of the average SCs depending on the epochs of SA. The level of the background values of the total MF determines the height of the SC and the average cycles of the epochs of lowered SA, which is a possible analog of high cycles of epochs of increased SA when no low cycles are observed in a significant number of observations of sunspots.
The development of the current SC 25 confirms the observed continuing shortage of solar active phenomena compared to the SC of epochs of increased SA, which results in a significant decrease in the number of large solar proton events and strong sporadic and recurrent geomagnetic and ionospheric disturbances because in the last case, the geoefficiency of reliable coronal holes has not been restored.
REFERENCES
Bazilevskaya, G.A., Daibog, E.I., Logachev, Yu.I., et al., Characteristic features of solar cosmic rays in the 21st–24th solar-activity cycles according to data from catalogs of solar proton events, Geomagn. Aeron. (Engl. Transl.), 2021, vol. 61, no. 1, pp. 6–13. https://doi.org/10.1134/S0016793221010023
Clette, F. and Lefèvre, L., The new sunspot number: Assembling all corrections, Sol. Phys., 2016, vol. 291, pp. 2629–2651. https://doi.org/10.1007-016-1014-v.
Ishkov, V.N., Reduced and extended periods of solar activity: monitoring features and key facts, in Solnechnaya i solnechno-zemnaya fizika-2013 (Solar and Solar–Terrestrial Physics-2013), Pulkovo, St. Petersburg: VVM, 2013, pp. 111–114. http://www.gao.spb.ru/russian/ publ-s/conf_2013/conf_2013.pdf.
Ishkov, V.N., Solar sunspot-forming activity and its development on the reliable Wolf numbers series, in Variability of the Sun and Sun-like Stars: From Asteroseismology to Space Weather, Rozelot, J.-P. and Babaev, E.S., Eds., Les Ulis: EDP Sciences Proceedings, 2018, pp. 109–118. https://international.scholarvox.com/catalog/book/ 88855582?_locale=en.
Ishkov, V.N., The current 24th cycle of solar activity in the minimum phase: Preliminary results and features of development, Cosmic Res., 2020, vol. 58, no. 6, pp. 436–443. https://doi.org/10.1134/S0010952520060064
Ishkov, V.N. and Shibaev, I.G., Solar activity cycles: General characteristics and current limits of forecasting, Izv. Ross. Akad. Nauk, Ser. Fiz., 2006, vol. 70, no. 10, pp. 1439–1442.
Shibaev, I. and Ishkov, V., Investigation of the statistical characteristics of Wolf numbers reliable series: Signs of solar cycles likelihood, in Proceedings of the 7th Scientific Conf. “Space, Ecology, Safety-2011”, Sofia, 2011.
Funding
This work was supported by ongoing institutional funding. No additional grants to carry out or direct thisparticular research were obtained.
Author information
Authors and Affiliations
Corresponding author
Ethics declarations
The author of this work declares that he has no conflicts of interest.
Additional information
Publisher’s Note.
Pleiades Publishing remains neutral with regard to jurisdictional claims in published maps and institutional affiliations.
Rights and permissions
About this article

Cite this article
Ishkov, V.N. Medium-Sized Solar Cycles in Different Epochs of Solar Activity. Geomagn. Aeron. 63, 1024–1030 (2023). https://doi.org/10.1134/S0016793223070101
Received:
Revised:
Accepted:
Published:
Issue Date:
DOI: https://doi.org/10.1134/S0016793223070101