
Abstract
According to the cyclicity pattern of a reliable series of the relative sunspot number, cycle 24 opens the second epoch of lowered solar activity (SA). The main specific feature of this epoch (five cycles) is the inhibition of high solar cycles and the strict fulfillment of basic observational rules in the development of individual cycles. The more than two-fold decrease in the background values of the solar general magnetic field by the end of cycle 23 led to a complete rearrangement of physical conditions, both on the Sun and in the inner heliosphere, and affected the state of the near-Earth space (NES). After 9.2 years of development, the current solar cycle, 24, became a cycle of low magnitude (W* = 81.9) with reduced flare activity, lower geoeffectiveness of active solar phenomena, and a near absence of the most powerful flare events, solar proton events, geomagnetic activity manifestations, and ionospheric disturbances.
1 INTRODUCTION
1.1. The near-Earth space (NES) is a region that starts at altitudes of 50–60 km above the Earth and spans the distance of tens of Earth radii. Its constituent matter is more closely associated with our planet than with the Sun or another astronomical body. Ever since the first human entered space, researchers have paid close attention to the NES. Obviously, in this region, we mainly deal with natural plasma, and the interest in the estimation of its actual state has moved to a practical plane. To understand the influence of space factors on ground-based technological systems, orbital objects, and life itself, including human health, it has become necessary to study the geoeffective phenomena on the Sun that dynamically affect the NES state. To take all of these factors and their effects into account, the notion of “space weather” was formed in the last decade of the 20th century. Space weather is understood as the state of all NES layers at any given time interval, which, along with the background electromagnetic and corpuscular radiation (constantly acting at long intervals of time), is determined solely by the active phenomena on the Sun, namely, geoeffective flare events and coronal holes. The class of flare events includes solar flare events with the entire range of dynamic manifestations of the motion of matter and radiation in all bands of the electromagnetic spectrum and the emissions of solar filaments with all of the accompanying dynamic phenomena.
Coronal holes are regions in the solar atmosphere with a magnetic field that opens into the interplanetary space; coronal holes are visible in separate lines (predominantly in the ultraviolet range) as regions in the solar corona that are opaque to the radiation of the underlying layers.
1.2. Solar activity is conventionally understood as the whole array of observable phenomena in the solar atmosphere that cause variations in the solar radiation at various electromagnetic wavelengths and particle fluxes of various energies. In the optical range, these variations are manifested only in the number of solar structures and are nearly invisible in the radiation: the variation in the solar constant is ≤0.1%. However, these variations in the soft X-ray range are manifested both in the number of structures and in the radiation: the difference between the “background” radiation level in the standard range of 0.1–0.8 nm (1–12.5 keV) during the maximum and minimum SA exceeds two orders of magnitude.
The SA level is characterized by observational indices, of which the relative sunspot number (W) has the longest series. This index was first introduced by R. Wolf and has been determined since 1849 (reliable series W1), when several observatories in Europe began regular sunspot observations. In addition to that, Wolf recovered the mean monthly values of this index to 1749 and numbered them, thus obtaining the numbered series W2. The mean annual values were recovered to 1700 from fragmented data obtained from individual European observers. Contemporary researchers qualitatively extended this series to 1610 based on the literature data. The W1 and W2 series were compared, and their agreement was examined (Ishkov and Shibaev, 2006). It was concluded that only the reliable series W1 (1849–2017) from the middle of cycle 9 to cycle 24 can be used to study the SA influence on various long-term processes. At the same time, cycles 8 and 9, which are adjacent to the reliable cycles and do not contradict their characteristics (Shibaev and Ishkov, 2012), can be arbitrarily added to the statistics of the reliable solar cycles, thus expanding the statistics to 17 SA cycles.
The reliable Wolf number series demonstrates a surprising consistency in the main manifestations of the development of separate 11- and 22-year solar cycles. The structure of its cyclicity implies a periodic alternation between the epochs of increased (cycles 6, 7, 8–10; 18–22) and lowered (cycles 12–16; 24 and the four subsequent cycles) solar activity (Fig. 1), in which each epoch contains five cycles (Ishkov, 2013). The principal differences in the characteristics and main properties of solar cycles of various SA epochs are determined by the different ranges of variations in the mean values of the general magnetic field of the Sun, which is manifested in the character of sunspot-forming activity and determines the general characteristics of cycles within the epochs. Studies of the characteristic features and laws of the development of solar cycles in different epochs made it possible to draw the following conclusions: for the entire set of reliable cycles, regardless of the epoch, the laws associated with the magnetic properties of the Sun, such as the 22-year cycle of the magnetic field polarity reversal during the maximum phase of the 11-year cycle, are strictly fulfilled. Hence follows Hale’s law: the magnetic polarities of leading and trailing sunspots in each hemisphere change to the opposite sign upon the transition from one cycle to another. The same is true for Joy’s law: a tilt in the bipolar structures from the leading to the trailing spot grows with their heliolatitude (the leading sunspots are closer to the equator). For the Waldmeier rule, the higher the growth rate of the cycle is, the stronger is the cycle. The Gnevyshev–Ohl rule is also invariably fulfilled in the epochs: an odd 11-year cycle is stronger than the preceding even cycle. In the available statistics, there were no low cycles during the epochs of elevated SA and no high cycles during the epoch of reduced SA. The strongest (for a given cycle) flare events within the epochs generally occur in the decline phase of the cycle, in the initial stage of the minimum phase, and, more rarely, in the rise phase.

Complete series of observations of smoothed (W*) relative sunspot numbers. Reliable series (W1) from 1849 (black color) with the boundaries of the structural epochs of lowered (1) and increased (2) SA with transition cycles between them. The first increased SA period (2*) includes solar cycles 10–6. Solar cycles 6 and 7 are included arbitrarily. The probable development of cycle 25 is on the far right. The recovered series (W2) is marked with gray color; the assumed series is marked with crosses. A transformed image from the Wikipedia is used: http://en.wikipedia.org/wiki/Sunspot.
The epochs are divided by transition periods (cycles 11, 17, and 23), i.e., the transition processes that encompass part of the adjacent (preceding or following) solar cycle. During these periods, the character of the sunspot-forming activity, i.e., the patterns of magnetic field generation in the sunspot-formation zone, changes over ~15 years. This causes variations in the general magnetic field of the Sun. During the transition periods, some observational rules of cycle development can be broken: this happened to the Gnevyshev–Ohl rule in cycles 22 and 23; the even cycle 22, for the only time in the history of reliable series, exceeded the odd cycle 23. These solar cycles were quite unusual in their characteristics and, to a certain degree, disrupted the established picture of solar cycle development; however, this can be explained by the conditions of the transition from the epoch of the increased SA to the epoch of the lowered SA (Ishkov, 2013).
The current solar cycle develops as a low-magnitude cycle, the flare activity of which is significantly lower than that of all previous solar cycles of the space era, and it opens the second epoch of lowered SA. So far, our knowledge of such an epoch is limited to the observational data on the first lowered SA epoch that lasted from 1878 to 1933 (five cycles). At that time, the solar observational data were limited to the Wolf numbers, sunspot group areas, times of interplanetary shockwave arrivals, i.e., sudden impulses (SI and SSC), and the magnitude of the geomagnetic field disturbance (Aa index). Table 1 lists the main characteristics of the cycles of the lowered SA epochs, from which it follows that all low cycles were even. In comparison with the rest of the reliable cycles, the solar cycles of the reduced SA epochs have the following qualitative and quantitative characteristics (on average) (Ishkov, 2013):
—lower initial \({\text{W}}_{{{\text{min}}}}^{*}\) values (3.38) and longer cycle duration (10.9 years);
—longer rise phases (4.5 years) and shorter decline phases (6.5 years);
—multipeaked maximum phase for low cycles (the highest peak becomes \({\text{W}}_{{{\text{max}}}}^{*}\));
—narrower sunspot-formation zone at a latitude of ±35°;
—higher number of spotless days around the minimum phase (763 days);
—significantly lower number of sunspot groups with areas ≥1000 mvh (147 in all cycles of the epoch): http://users.telenet.be/j.janssens/Archives/gsr2.pdf (p. 8);
—lower value of the mean sunspot group area smoothed over the epoch (~1200 mvh): http://users. telenet.be/j.janssens/SC24web/SC24.html#Area;
—prolonged minimum phases between the cycles (56–60 months) and especially before the low cycles; the longest minimum phases in two cases out of three (23–24 and 14–15);
—lower maximum value of the polar magnetic field, ±100 µT (by cycle 24): http://www.leif.org/ research/Solar%20Mean%20Field%202003-now.png.
2 MAIN CHARACTERISTICS AND EVOLUTION OF SOLAR CYCLE 24
2.1. The evolution of the current solar cycle shows that, after 9.2 years of development, it is presently undergoing the minimum SA phase (from April 2016). The first peak occurred as early as February 2012 and was followed by a slight but prolonged (15 months) decline in the Wolf numbers. Starting from April 2013, the current solar cycle began to steadily grow, and it reached its maximum (W* = 81.9) by April 2014. Thus, the duration of the rise phase amounted to 5.32 years, which became an absolute record for the reliable solar cycles (Table 1). Figure 2 shows the evolution of the current cycle after 104 months of development in the family of low and medium solar cycles. Table 2 shows the main evolutionary and flare characteristics of large sunspot groups of the current cycle.

Evolution of current solar cycle 24 after 102 months of development in comparison with low (12, 14, 16) and moderate (13, 10) solar cycles in smoothed relative sunspot numbers (W*).
Let us consider the main characteristics of the current cycle after 9.2 years of its development.
—The cycle formally began in January 2009, with a value of W* = 1.7.
—The first sunspot group appeared in the northern hemisphere in January 2009 and in the southern hemisphere only in May 2009. This is the second case (the first was in cycle 23) in which the first sunspot group occurs at the beginning of the cycle (the usual time is 1–1.5 years before the minimum point).
—The growth phase began in April 2011 (W = 54.4, F10.7 = 112.6).
—The growth phase was the longest (5.3 years); the previous record was held by cycle 12 (5.0 years), which was the initial cycle of the first reduced SA epoch.
—The cycle maximum was detected in April 2014: W* = 81.9 (116.2 by the new system introduced by the Sunspot Index and Long-term Solar Observations Center in Brussels on July 1, 1915, http://sidc.be/ silso/newdataset).
—The first large (Sp ≥ 500 mvh) sunspot group appeared in February 2011; the first very large (Sp ≥ 1500 mvh) group appeared in November 2011; and the only giant sunspot group (Sp ≥ 2500 mvh) appeared in October 2014.
—By March 2018, only 16 sunspot groups with an area of Sp ≥ 1000 mvh had occurred on the visible disk of the Sun. Of these, five had values of Sp ≥ 1500 mvh and one had a value of Sp ≥ 2500 mvh (Table 2).
—The current cycle has the lowest relative number of large sunspot groups (Sp ≥ 1000 mvh) of all cycles of the space era and the lowest lifetime of sunspot groups (Otkidychev and Skorbezh, 2013).
—The average sunspot number in the group, the average size of an individual group, and the average number of detectable individual sunspots and sunspot groups are the lowest. This cycle has also the highest number of 1-day groups and single sunspots (Otkidychev and Skorbezh, 2013).
—An excess of the occurrence of sunspot groups over the solar hemispheres was formed in the following way. Until mid-2013, the sunspot-formation activity in the northern solar hemisphere predominated. Its first maximum occurred in October 2011 (\({\text{Rn}}_{{{\text{max}}}}^{*}\) = 45.5); the situation then rapidly changed, and the sunspot groups began to appear more often in the southern hemisphere (\({\text{Rs}}_{{{\text{max}}}}^{*}\) = 59.0) with the maximum in April 2014. However, from the very beginning of 2016, there was a steady predominance of the sunspot groups in the northern solar hemisphere (http://users.telenet.be/ j.janssens/SC24web/SC24.html#Hemarea).
—The smoothed radio flux values at a 10-cm wavelength (2695 MHz) in July 2008 to February 2009 remained at a level of F10.7 = 68 × 10–22 W/(m2 Hz). This is the largest time interval of the lowest values over the entire history of solar radio observations, and the F10.7 value in the cycle maximum became the lowest since the beginning of radio observations (since 1947): 145 × 10–22 W/(m2 Hz) (http://www.spaceweather.gc.ca/solarflux/sx-6-mavg-en.php).
The processes of readjustment of the general magnetic field to the level of the reduced SA epoch that began in the middle of cycle 22 and lasted through all of cycle 23 led to a significant decrease in the general magnetic field of the Sun (http://www.leif.org/ research/Solar%20Mean%20Field%202003-now.png) with the following consequences.
—The magnetic field in the sunspot umbrae significantly decreased (by ~700 G from the level of 1998) and stabilized at a level of ~2050 G (http://www. leif.org/research/Livingston%20and%20Penn.png).
—The magnetic field of coronal holes noticeably decreased: 0.2–8.7 G with an average value of 3.0 ± 1.6 G (Hofmeister, 2017). As a comparison, the values for the previous solar cycles were in the interval of 3–36 G (Harvey et al., 1982) with an average of ~20 G (Wang, 2009) in the maximum phases and 1–7 G with an average of ~5 G in the minimums. There is a high probability that this weakened the geoeffectiveness of coronal hole high-velocity fluxes (Hofmeister, 2017). During the cycle 24 minimum, the area of coronal holes was maximal, while the magnetic field strength and flux turned out to be minimal over the entire period of coronal hole observations (Vasil’eva and Tlatov, 2015).
—The pattern of variations in the polar magnetic fields shifted: the magnitude of the polar magnetic field was approximately 7–8 G in the minimum phases of the previous three cycles and only 4–5 G during the last minimum of the current cycle (2008–2009) (http://www.leif.org/ research/Solar%20Mean%20Field%202003-now.png).
—There is a complex pattern of the polarity reversal of the Sun’s general magnetic field during the maximum phase of the cycle: in the northern solar hemisphere, the process of polarity reversal took ~3 years (May 2012 to June 2015); the polarity reversal in the southern hemisphere proceeded within a shorter interval, from mid-2013 to March 2014. Thus, the entire period of the polarity reversal took more than 3 years, which sets the record for the longest duration for the solar cycles of the space era (http://www.leif.org/ research/WSO-Polar-Fields-since-2003.png).
—All average parameters of the solar wind in comparison with the average characteristics considerably decreased during the elevated SA epoch: the solar-wind velocity and ratio of the thermal to magnetic pressure (β) (~11%); temperature (~40%); thermal pressure (~55%); mass flux (~34%); momentum flux or dynamic pressure (~41%); energy flux (~48%); and the magnitude of the interplanetary magnetic field (~31%) and its radial component (~38%). The proton dynamic pressure remains near its lowest values observed in the space era: ~1.4 nPa in comparison with the period between the mid-1970s and mid-1990s (~2.4 nPa) (McComas et al., 2013).
—The number of coronal mass ejections reduced insignificantly; however, their angular width noticeably increased as compared to the events with identical propagation velocity in solar cycle 23 (Selvakumaran et al., 2016).
—A decrease in the magnitude of the interplanetary magnetic field led to significant growth (20%, according to Elbert et al., 2009) of the background values of galactic cosmic rays, which is clearly reflected in the neutron monitor data (http://users.telenet.be/ j.janssens/SC24web/SC24.html#CosmicRays).
—The development rate and level of flare activity in the current cycle is considerably lower than in the previous five solar cycles; there were only 58 flare events with a class Х ≥ 1.0 (four with a class Х > 5), while severe and extreme flares were absent completely.
It is important to note that the time between the first signs of the occurrence of a significant new magnetic flux and the beginning of the flare energy release decreased (10–20 h) in current cycle 24, although the period itself remained the same (~55 h) (Ishkov, 1998). This led to the emergence of active regions in which significant flare events occurred immediately on the day of the emergence of a new magnetic flux (e.g., active regions AR11121, AR11158, and AR11598). This fact somewhat complicates the possibility of the timely prediction of the period of the development of large solar flares. In past cycles of the space era, this time interval comprised at least 24 h (Ishkov, 1999).
—The number of solar proton events (Epr > 10 MeV) significantly decreased: 96 in comparison with 149 in cycle 23, 127 in cycle 22, 146 in cycle 21, and 144 in cycle 20. This is especially true for strong (8) and severe (5) events, as well as the number of rises (2) on neutron monitors (cosmic ray flares).
—The number of magnetic storms decreased catastrophically, especially moderate (40%) and strong (80%) magnetic storms, as compared with the solar cycles of the space era.
—The Ap index reached its minimum in October 2009, which is 10 months after the Wolf number minimum. The maximum mean monthly values of the Ap index were reached in September 2017 (18.1), with previous peaks in March 2015 (16.3), March 2012 (16.1), and September 2015 (15.8). In June 2015, the smoothed Ap* index exceeded 10 for the first time in the cycle (http://legacy-www.swpc.noaa.gov/ftpdir/ weekly/Ap.gif).
2.2. Let us briefly turn our attention to the characteristics and features of the development of the most flare-active sunspot groups of the current SA cycle (selected by the author). In the present study, a sunspot group is characterized by its number (AR) in the system of the Solar Data Services of the US NOAA (National Oceanic and Atmospheric Administration); its heliographic coordinates; the central meridian passage (CMP); the maximum area of the group (Sp) in millionths of the visible hemisphere (mvh); and the flare potential of the active region. The latter includes the number of solar flares by X-ray classes in which the superscript shows the class of the largest flare by its intensity in the standard soft X-ray range (0.1–0.8 nm, 12.5–1 keV), as well as the X-ray flare index of the sunspot group (XRI) introduced by P. McIntosh. The XRI is calculated as the sum of X flares and M flares, where the X flares contribute units (X5.3 adds 5.3), and M flares contribute decimals (M8.3 adds 0.83). It should be noted that strong solar flares are the flares of an X-ray class that equals or exceeds M5, i.e., the X‑ray flux in the flare’s maximum reaches or exceeds 5 × 10⁻⁵ W/m2. For X flares, the flux equals or exceeds 10–4 W/m2.
The first large flare events began as early as February 2010. The first occurred in AR11045 (N24L253; CMP 17, 9.02.2010; Sp = 420 mvh; XRI = 1.52; \({\text{M}}_{{\text{8}}}^{{{\text{6}}.{\text{4}}}}\) + C24) in the central part of the Sun on February 6 and immediately began to produce moderate flares in the process of emergence. Seven moderate flares and one large flare (M6.4) occurred on February 6–8, 2010, over 48 h. From February 10, the magnetic configuration of the sunspot group AR11046 (N24L186; CMP 13, 10.02.2010; Sp = 190 mvh; XRI = 0.83; \({\text{M}}_{{\text{1}}}^{{{\text{8}}.{\text{3}}}}\) + C4) began to complicate rapidly; on February 12, it produced the only large flare of a M8.3 class.
The flare activity pattern changed cardinally from February 2011. AR11158 (S19L034; СМР 13, 8.02.2011; Sp = 620 mvh; XRI = 3.59; \({\text{X}}_{{\text{1}}}^{{{\text{2}}.{\text{2}}}}\) + \({\text{M}}_{{\text{6}}}^{{{\text{6}}.{\text{6}}}}\)) formed on the visible solar disk on February 11. The emergence rate of the subsequent magnetic fluxes was so high that, as early as February 15, the area of the sunspot group became large (Sp ≥ 500 mvh), and the magnetic configuration of the central part became extremely complex. Such a rapid development resulted in the period of occurrence of large flares in this sunspot group: the first such flare (M6.6) occurred on February 13, and the first strong X flare (X2.2) in the current cycle occurred on February 15. In total, 2 large and 5 moderate flares occurred in the active region over 69 h on February 13–16. The last large flare (M6.6) occurred on February 18.
AR11261 (N16L330; СМР 01, 4.08.2011; Sp = 390 mvh; XRI = 2.71; \({\text{M}}_{{\text{5}}}^{{{\text{9}}.{\text{3}}}}\) + C36) appeared on the visible disk on July 25 as a group of a medium area. Only the emergence of a new magnetic flux on August 2 led to a period of strong flares on August 3–4, when two large flares М6.0/2В and М9.3/2В occurred in this active region over 23 h. Their disturbances caused a solar proton event (S1) in the NES on August 4–6 and a strong magnetic storm (G4) on August 5–7. The second sunspot group AR11263 (N17L301; СМР 03, 5.08.2011; Sp = 720 mvh; XRI = 7.67; \({\text{X}}_{{\text{1}}}^{{{\text{6}}.{\text{9}}}}\) + M3 + C33) grew by August 7 to the category of large and on August 8–9 over 13 h produced one of the strongest flare events in the current SA cycle, an Х6.9/2В flare, which caused a minor proton event (S1) in the NES, and two moderate flares.
In September 2011, the period of large solar flares was associated with AR11283 (N12L224; СМР 05, 7.09.2011; Sp = 230 mvh; XRI = 5.60; \({\text{X}}_{{\text{2}}}^{{{\text{2}}.{\text{1}}}}\) + M5 + С13). The new emerging magnetic flux on September 4 led to the occurrence of four significant flares on September 6–8 over 61 h, including two X flares – Х2.1 on September 6) and Х1.8 on September 7. The disturbances from these solar flares caused a moderate magnetic storm in the NES on September 9–10, which started with the arrival of a double interplanetary shockwave that manifested itself as two sequential sudden impulses of the geomagnetic field on September 9: SI/1243UT and SI/1250 UT. On September 21, the first very large sunspot group in the current cycle appeared on the visible disk: AR11302 (N13L280; СМР 28, 7.09.2011; Sp = 1300 mvh; XRI = 8.73; \({\text{X}}_{{\text{2}}}^{{{\text{1}}.{\text{9}}}}\) + \({\text{M}}_{{{\text{17}}}}^{{{\text{7}}.{\text{4}}}}\) + С32). As early as September 22, large flares began to occur on the eastern limb. Five flares were detected over 66 h on September 22–25: Х1.4 (September 22), Х1.9, М7.1, М5.4 (September 24), and М7.4 (September 25). Although the flares are not in a convenient location to affect the Earth’s surroundings, the conditions of the propagation of disturbances allowed them to cause moderate (September 26–27) and minor (September 28–29) magnetic storms.
On January 13, 2012, a longitudinal complex of active regions formed by two sunspot groups appeared from the eastern limb: AR11401 (N15L212; СМР 21, 0.01.2012; Sp = 540 mvh; XRI = 0.37; \({\text{M}}_{{\text{3}}}^{{{\text{1}}.{\text{7}}}}\) + С19) and AR11402 (N28L211; СМР 21, 2.01.2012; Sp = 630 mvh; XRI = 2.89; \({\text{X}}_{{\text{1}}}^{{{\text{1}}.{\text{7}}}}\) + \({\text{M}}_{{\text{2}}}^{{{\text{8}}.{\text{7}}}}\) + С9). The very long (>6 h) М3.2 flare that appeared on January 19 led to a moderate magnetic storm in the NES on January 22. The М8.7 flare on January 23 and Х1.7 flare on January 27 became sources of solar proton events with S3 and S2 proton flux intensities at the maximum. It is necessary to note that the vast majority of the proton events of S3 and S4 intensity take place during the flares that occur in complex of active regions (Ishkov, 2013) in which the general magnetic field configuration apparently facilitates an abundant release of solar protons into the interplanetary space.
The next period of very high flare activity in March 2012 is associated with the complex of active regions comprised by AR11429 (N18L301; СМР 09, 1.03.2012; Sp = 1270 mvh; XRI = 11.92; \({\text{X}}_{{\text{2}}}^{{{\text{5}}.{\text{4}}}}\) + \({\text{M}}_{{{\text{14}}}}^{{{\text{8}}.{\text{4}}}}\) + С32) and AR11430 (N19L319; СМР 08, 0.03.2012; Sp = 200 mvh; XRI = 1.3; \({\text{X}}_{{\text{1}}}^{{{\text{1}}.{\text{3}}}}\) + С3). The first sunspot group produced two strong X flares and 10 M flares over 46 h on March 5. The last was a double Х5.4 + Х1.3 flare, which encompassed both complex components and became the source of the strongest in intensity (S3) proton event of the current cycle. In addition, a rapid coronal mass ejection from this flare event on March 8–9 caused a severe prolonged magnetic storm in the NES (Dst = 139 nT). On March 9–10, two large flares (М6.3 and М8.4) occurred in the main component of the complex over 38 h. Finally, a large proton М7.9 flare (S2) occurred on March 13 at W59. In July 2012, in the sunspot group AR11515 (S16L205; СМР 3, 2.07.2012; Sp = 900 mvh; XRI = 8.5; \({\text{X}}_{{\text{1}}}^{{{\text{1}}.{\text{1}}}}\) + \({\text{M}}_{{{\text{3}}0}}^{{{\text{6}}.{\text{9}}}}\) + С72), a period of five large flares, which lasted for 73 h, began on July 2. This series of flares caused two minor (S1) proton events in the NES on July 7 and 9 and two minor magnetic storms on July 9 and 10. At the same time, the first sunspots of AR11520 (S16L084; СМР 12, 2.07.2012; Sp = 1460 mvh; XRI = 2.93; \({\text{X}}_{{\text{1}}}^{{{\text{1}}.{\text{4}}}}\) + \({\text{M}}_{{\text{5}}}^{{{\text{7}}.{\text{7}}}}\) + С26) appeared on July 7. As early as on the second day, its area exceeded 1000 mvh and reached its maximum on July 12. It produced two large proton flares on July 12 (Х1.4) and July 19 (M7.7). The last series of large flares in 2012 (М9.0, М5.0, Х1.8) occurred over 57 h on October 20–23, 2012, during the emergence of sunspot group AR11598 (S10L113; СМР 27, 1.10.12; Sp = 420 mvh; XRI = 3.33; \({\text{X}}_{{\text{1}}}^{{{\text{1}}.{\text{8}}}}\) + \({\text{M}}_{{\text{3}}}^{{{\text{9}}.0}}\) + С25) on the visible disk.
In May 2013, in the sunspot group AR11748 (N12L294; CMP 20, 0.05.2013; Sp = 310 mvh; XRI = 9.96; \({\text{X}}_{4}^{{{\text{3}}.{\text{2}}}}\) + \({\text{M}}_{{\text{5}}}^{{{\text{3}}.{\text{2}}}}\) + С19), a series of four strong X flares (Х1.7, Х2.8, Х3.2, and Х1.2) occurred in the eastern limb over 57 h on May 13–15. Such a concentration of X flare events is a rather rare event, but, unfortunately, a detailed analysis of the situation is impossible in this case, since the entire preparation of these events occurred behind the eastern limb. The highest concentration of large flares in 2013 was observed during the last third of October to the first third of November and is associated with three sunspot groups:
– AR11875 (N07L027; CMP 23, 1.10.2013; Sp = 790 mvh; XRI = 6.53; \({\text{X}}_{{\text{2}}}^{{{\text{2}}.{\text{3}}}}\) + \({\text{M}}_{{{\text{12}}}}^{{{\text{5}}.{\text{1}}}}\) + С57): the emergence of a significant new magnetic flux began on October 22 and led to the first period of flares on October 22–24 (8 moderate flares), followed by the next emergence on October 26, which led to the occurrence of two strong flares (Х1 and Х2.3) on October 28–29;
– AR11882 (S09L291; CMP 30, 5.10.2013; Sp = 390 mvh; XRI = 9.96; \({\text{X}}_{{\text{2}}}^{{{\text{2}}.{\text{1}}}}\) + \({\text{M}}_{{{\text{11}}}}^{{{\text{4}}.{\text{4}}}}\) + С9): both strong flares (Х1.7 and Х2.1) occurred on October 28, when the active region was present on the visible disk for only two days; thus, their influence on the NES was limited to radiation only;
– AR11890 (S10L113; CMP 8, 8.11.2013; Sp = 950 mvh; XRI = 7.38; \({\text{X}}_{{\text{3}}}^{{{\text{3}}.{\text{3}}}}\) + \({\text{M}}_{{\text{5}}}^{{{\text{3}}.{\text{8}}}}\) + С46): two flare periods took place in the central zone. The first (Х3.3) came at the peak of the development of the sunspot group on November 5, while the main period (two flare events, both Х1.1) occurred on November 8–10.
The large and relatively quiet sunspot group AR11944 (S09L100; CMP 7, 8.01.2014; Sp = 1560 mvh; XRI = 3.08; \({\text{X}}_{{\text{1}}}^{{{\text{1}}.{\text{2}}}}\) + \({\text{M}}_{{\text{7}}}^{{{\text{7}}.{\text{2}}}}\) + C44) occurred on the solar disk on January 1; before January 7, it produced five moderate flares. However, a significant new magnetic flux emerged to the northeast of the leading sunspot in the second half of January 5, and two strong solar flares occurred over 8 h on January 7. The first flare (М7.2) occurred in the inner space of the sunspot group and produced a minor proton event (S1); the second flare (Х1.2) took place to the southwest of the large leading sunspot and caused a strong proton event (S3) in the NES, which became the third in magnitude in the current solar cycle. An Х4.9 flare that was fourth in terms of soft X-ray intensity occurred almost at the eastern limb on March 25 in the emerging sunspot group AR11990 (S13L110; CMP 02, 6.03.14; Sp = 250 mvh; XRI = 5.13; \({\text{X}}_{{\text{1}}}^{{{\text{4}}.{\text{9}}}}\) + \({\text{M}}_{{\text{2}}}^{{{\text{1}}.{\text{2}}}}\) + С6). It became the source of a moderate (S2) prolonged proton event that lasted until April 5. High flare activity was detected on June 19–11, when three strong flares (Х2.2, X1.5, and X1.0) occurred over 22 h in the small sunspot group AR12087 (S18L156; CMP 16, 2.06.2014; Sp = 220 mvh; XRI = 6.76; \({\text{X}}_{{\text{3}}}^{{{\text{2}}.{\text{2}}}}\) + \({\text{M}}_{{\text{8}}}^{{{\text{3}}.{\text{9}}}}\) + С29).
The most significant event in current cycle 24 was the passage of a giant sunspot group, the largest in the last 20 years, over the visible disk in October 2014 (Fig. 3): AR12192 (S13L248; CMP 23, 5.10.14; Sp = 2750 mvh; XRI = 20.45; \({\text{X}}_{{\text{6}}}^{{{\text{3}}.{\text{1}}}}\) + \({\text{M}}_{{{\text{35}}}}^{{{\text{8}}.{\text{9}}}}\) + С73). The first large flare (Х1.1) occurred as early as the third day (November 17) of the group’s appearance on the visible solar disk; the next flare (Х1.6) occurred on November 22. From November 26 to 28, six strong flares occurred over 38 h: Х2.0 and Х1.0 on November 26; М7.1, М6.7, and Х2.0 on November 27; and М6.6 on November 28. The main feature of these large flare events is the complete absence of coronal mass ejections, due to which this active region produced almost no disturbances in the corpuscular radiation or the geomagnetic field. This suggests that the large-scale magnetic fields of this giant sunspot group were very strong; the large-scale magnetic configuration of the region was closed and represented a simple bipolar structure, within which large flare events occurred along the polarity division line. However, the energy released in the flares was not sufficient for coronal mass ejections to leave the boundaries of the structure. The studies of this active region clarified the situation in the rise phase of solar cycle 18, when the flare activity of these sunspot groups of extremely large areas (for example, 6140 mvh in March 1948) caused no strong magnetic disturbances in the NES.

View of the giant sunspot group of October 19–24, 2014. The line of the polarity division passes through the central part of the group diagonally from left to right. North is at the top.
New magnetic fluxes emerged sequentially, starting from September 3, 1.5 years after the beginning of the minimum phase (April 2016) in the third rotation in the quiet small sunspot group AR12673 (S08L117; CMP 03, 8.09.2017; Sp = 1060 mvh, XRI = 18.97; \({\text{X}}_{{\text{5}}}^{{{\text{9}}.{\text{3}}}}\) + \({\text{M}}_{{{\text{27}}}}^{{{\text{8}}.{\text{1}}}}\) + C54). By September 4, this had increased the area of the sunspot group by nearly four times; by September 8, the area reached the maximum value. As happened repeatedly in the current cycle, less than a day after the beginning of the process, the first strong flare (М5.5) occurred on September 4. Four strong X flares (Х2.2, Х9.3, and Х1.7 on September 6 and Х1.3 on September 7) and six large M flares occurred (Fig. 4) in the process of the interaction of the new magnetic fluxes with the intrinsic magnetic field of the active region (September 6–8). The emergence of the next magnetic flux (September 9–10) led to another strong flare (Х8.2 on September 10). Thus, the two most powerful solar flare events of the current solar cycle (Х9.3 and Х8.2) occurred in this active region. This period of high flare activity caused solar proton events of minor and moderate intensity (S1 and S2) in the NES that lasted from September 4 to 15. The disturbances from these events also caused one severe and two minor magnetic storms.

View of the sunspot group and strong Х9.2/3N flare of September 6, 2017, according to SDO white-light observations with the superposed magnetic field (a) and in the strongest hydrogen line На (6563 Ǻ) (b) from http://spaceweather.com.
It should be noted that the occurrence of regions with such extreme flare activity in the minimum phase of a solar cycle is a rather frequent phenomenon. In the previous cycle, such highly active sunspot groups were detected in September 2005 (3 years before the minimum) and in December 2006 (2 years before the minimum). However, this was a specific transitive cycle between the epochs of increased and lowered SA, and it could be the property of a transition period. However, such sunspot groups in cycle 21 (increased SA epoch) were observed in April and May 1984 (2 years before the minimum). Statistics for the lowered SA epoch are not available yet, since cycle 24 is the first cycle of the present epoch, but it can be seen that this pattern is fulfilled.
3 SPACE WEATHER OF SOLAR CYCLE 24
3.1. With the development of studies on solar–terrestrial physics, it became clear that the main influence on the NES is exerted by the Sun itself and active phenomena in its atmosphere. In turn, the number and strength of such phenomena depend on the SA epoch and the characteristics of the specific cycle in which they occur.
The electromagnetic, corpuscular, and plasma disturbances from solar geoeffective phenomena are propagated through the heliosphere by the solar wind; they affect the magnetospheres of the planets, their satellites, and comets, and cause significant deviations from the quiet background state in almost all atmospheric layers of the objects under study. These disturbances are caused by the following:
—coronal mass ejections as a consequence of active explosive and evolutionary processes during flare events; their observations and characteristics make it possible to refine the direction of motion of the disturbance in the interplanetary space, the possibility of its arrival to the NES, and the degree of its geoeffectiveness;
—high-velocity solar plasma fluxes that follow the shockwave from flare events or emerge from regions with an open configuration of the magnetic field (coronal holes).
A complete chain of disturbances from a single large flare event can be represented as three separate stages of influence that sequentially take place in the NES and are estimated on a five-level scale of intensity (https://www.swpc.noaa.gov/noaa-scales-explanation). First, at the moment of the development of the geoeffective flare event, the NES was irradiated with the electromagnetic flux (R1–5: electromagnetic shock). Further, within a time interval between several minutes and 10 h (depending on the energy), charged solar particle fluxes reach the NES (S1–5: corpuscular shock–solar proton event). Finally, after 17–96 h, plasma fluxes of increased velocity, density, and temperature arrived in the NES (G1–5: plasma shock), causing disturbances in the geomagnetic field, i.e., magnetic storms. It is worth noting that the disturbances from solar filament emissions and high-velocity fluxes from coronal holes cause only magnetic disturbances in the NES. It should be taken into account that this scale of disturbances in the NES was introduced at the end of the last century, and, therefore, took into account the number of events of each level of disturbance for the solar cycles of the increased SA epoch (20–22). In recent years, it became clear that cycle 23 was a transition cycle between the epochs of the increased and lowered SA, and cycle 24 is the first cycle of the lowered SA epoch. For this reason, the epoch of the lowered SA is something of a “terra incognita” for solar researchers with its own background values of physical processes on the Sun, in the interplanetary medium, and in the NES.
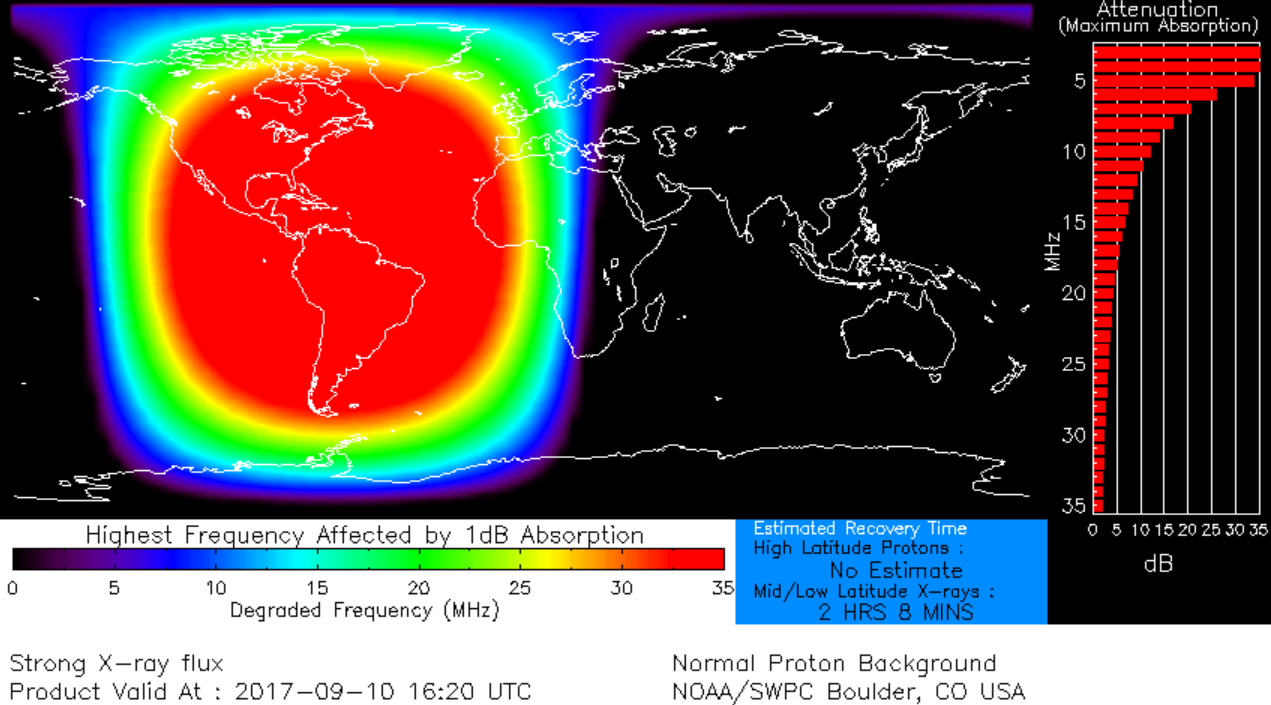
3.2.The electromagnetic influence (R) of the solar activity events on the NES begins immediately on the sunlit side of the Earth at the moment a flare develops (the characteristic time of the beginning of development of the disturbance is minutes after the beginning of a flare). Sudden ionospheric disturbances develop in response, which cause a complete radio blackout in the high-frequency range with a duration of up to several hours (for the Х8.2 flare of September 10, 2017 at 1606 UT, see, e.g., http://www.spaceweather.com/images2017/10sep17/blackoutmap.png?PHPSESSID= l39tpf9vue7sbo5t4e49l9uhd1). In the low-frequency range, this leads to a sharp increase and prolonged accumulation of errors in the navigational GPS systems of positioning ground-based objects and satellites. The magnitude of such an influence in the current SA cycle is conditioned by a significant decrease in the general magnetic field of the Sun, which led to an increase in the number of small, short-lived regions that are not flare-active and to a sharp decrease in the sunspot groups capable of producing geoeffective solar flares. This changed the rate and intensity of the flare activity and, therefore, the background values of the soft X-ray (Fig. 5) and ultraviolet radiation. These values in the current solar cycle are at the lowest level in the last 70 years (SA cycles 18–23).

Smoothed background solar radiation in the wavelength range of 1–8 Ǻ (12.5–1 keV) for cycles 23 and 24 from https://sidstation.loudet.org/solar-activity-en.xhtml.
A total of 813 solar flares have occurred on the Sun over the last 10 years, up to March 2018. Of these, there were 643 moderate flares (М1–4.9); 170 large and strong flares (М > 5); 58 strong flares of Х ≥ 1.0 (27 of them in the southern hemisphere); and 4 flares of Х > 5. Table 3 lists the largest flare events, which caused the strongest disturbances in the ionosphere. The effect of the flare electromagnetic radiation on the ionosphere in the current cycle turned out to be significantly weaker, which led to reduced values of the total electron content (Hao et al., 2014), a decrease in the critical frequency of the foF2 layer (Fig. 6), and changes in other general characteristics of the ionosphere, magnetosphere, and, possibly, the troposphere. The sporadic heating of the Earth’s atmosphere significantly decreased, which led to increased pollution of the NES (unfavorable conditions for clearing space debris from the low orbits), and an increase in the lifetime of space vehicles. A good example of this is the fall of the Chinese orbital station that launched in September 2011. In March 2016, the station’s telemetry failed, and the calculations based on the average (over the cycles of the increase SA epoch) atmospheric parameters showed that it would enter the dense layers of the atmosphere and fall to the Earth at the end of 2017. However, the low flare activity extended this time to April 2018.

(a) Values of the foF2 layer critical frequency for cycles 19–23 (gray curve) and cycle 24 (black curve); (b) total electron content (global average) for cycle 23 (gray curve) and cycle 24 (black curve) from the ionosonde measurements at Kokubunji observatory (35.7 N, 139.5 E) (Hao et al., 2014).

Solar energetic proton flux in September 2017 from strong solar flares in AR12673 from the data of the geostationary satellite GOES-11. (http//:www.swpc.noaa.gov).

Severe magnetic storm (G4) of September 7–8, 2017, from the data of the Moscow geomagnetic observatory (IZMIRAN).
Table 4 allows a comparison of the number of significant flares influencing the ionosphere in the solar cycles of various epochs (for the current cycle, the values are given as of March 2018, i.e., the beginning of the third year of the minimum phase). Table 4 shows that there were no severe or extreme flares in the current cycle, and, in the author’s opinion, their probability is low for all subsequent (four) cycles of the lowered SA epoch.
3.3. The number of solar proton events (Еpr > 10 MeV) and their influence on the NES (corpuscular shock, solar proton event (S)) noticeably decreased. The invasions of solar protons increase the radiation hazard for cosmonauts and the crews and passengers of high-altitude airplanes at high latitudes, damage the scientific and navigational equipment on space vehicles, disrupt shortwave communication in circumpolar regions, and cause a sharp increase in the errors in the navigational systems. The characteristic time of the beginning of a solar proton event in the NES relative to the beginning of a proton flare is hours, although the particles with GeV energies arrive at the Earth several minutes after they were injected into the flares. The aforementioned features of the current cycle undoubtedly influenced the generation and escape of energetic solar particles into the inner heliosphere and radiation conditions in open space and the NES. A decrease in the value of the magnetic field in the inner heliosphere led to a decrease in the modulation zone of galactic cosmic rays, significant growth in their intensity in the interplanetary space, and an increase in the radiation background over the whole current cycle, not only the minimum phase. The dynamics of the variations in the intensity (as a neutron monitor count) of the galactic cosmic rays in comparison with the solar cycles of the space era can be seen in the Moscow neutron monitor data (http://users.telenet.be/j.janssens/SC24web/SC24.html#CosmicRays). An increase in the radiation hazard is caused by an increase in the GCR background, which reached its minimum by the middle of 2015 and started growing steadily approaching the record values of 2009, which, given the reduced level of flare activity, became the reason for an increase in the radiation background in the stratosphere by 13% (outer radiation belt); at the same time, the background at altitudes of civil aviation flights remained almost unchanged (http://www.spaceweather.com for March 1, 2018;
http://www.spaceweather.com/cosmicrays/everything_11sep16.png?PHPSESSID=7o13vkbq5g3gdrp6r6i3io19l0).
In the current cycle, the energetic particle background in the quiet time varied from 7 × 10⁻⁴ cm–2 s–1 sr–1 MeV–1 near the cycle’s minimum (2009–2010) to 3.5 × 10⁻⁴ cm–2 s–1 sr–1 MeV–1 at the end of 2013 close to the cycle’s maximum. In cycle 23, these values ranged from 5 × 10⁻⁴ cm–2 s–1 sr–1 MeV–1 near the minimum (1996–1997) to 3 × 10⁻⁴ cm–2 s–1 sr–1 MeV–1 in 2001–2003 near the cycle’s maximum (Paassilta et al., 2017).
Over the time of the development of the current cycle, 96 solar proton events are detected in the NES (Epr > 10 MeV; Jpr ≥ 1 pfu), of which 39 have a particle flux of <100 pfu, 8 events have a value of 100–1000 pfu, and 5 events are ≥1000 pfu. Of these, there were two reliable (May 17, 2012, and September 6, 2017, http://gle.oulu.fi/#/) increases on neutron monitors (a ground level event (GLE), i.e., flares in the cosmic rays), and more than seven flares in solar neutrons. Table 5 lists the most intensive (S3–S2) solar proton events (Е > 10 MeV) of current solar cycle 24. The total fluence of protons with Е >10 MeV over the course of the first 2100 days in cycle 23 is 4.4 times higher than over the same period in cycle 24 (Mewaldt et al., 2015). Figure 4 illustrates a solar proton event from the strong flares of September 2017.
Table 6 gives a comparison of the number of solar proton events in the cycles of various epochs (for current cycle 24, the values are given as of March 2018). As can be seen from the table, the number of proton events in the current cycle is significantly lower than in all categories of similar events of the elevated SA epoch and transition cycle 23, with the exception of the smallest events, the number of which remained at the same level.
3.4. Interplanetary shockwaves and subsequent solar plasma fluxes of increased density and velocity (interplanetary coronal mass ejections, high-velocity solar wind fluxes) cause magnetic and ionospheric disturbances in the NES (plasma shock (G)). It should be taken into account that the levels of the geomagnetic disturbance scale estimate only the intensity of the disturbance. It is possible to have a situation in which the geomagnetic disturbance has a G1 or G2 level (Kp = 4–5), but the magnetic storm is, in fact, absent, and the daily average geomagnetic Ар index is significantly below the magnetic storm threshold. This is a case of a geomagnetic substorm. Of course, it is a matter of defining the notion of “magnetic storm”: a magnetic disturbance with a duration of at least 12 h and average Ар index of disturbance ≥27 (7 values of Kp = 4). In western countries, the threshold value of a minor magnetic storm is Ар ≥ 30.
A significant decrease in the number of flare events led to a decrease in the number of normally stronger sporadic geomagnetic disturbances, which can be explained by the significant decline in the geoeffectiveness of coronal mass ejections; their number reduced insignificantly, but the angular width in comparison with the events of equal propagation velocity in solar cycle 23 noticeably increased (Selvakumaran et al., 2017). In 2009–2018, 273 magnetic storms were detected, including 178 minor, 74 moderate, 15 strong, and 6 severe storms. A significant decrease in the number of recurrent minor magnetic storms associated with coronal holes can be explained; first, by a significant decrease in the magnitude of the magnetic field in the coronal holes, which affected the characteristics of the related high-velocity fluxes, and, second, by a change in almost all parameters of the solar wind and interplanetary magnetic field and, as a consequence, the magnetosphere characteristics. As a result, the number of periods of quite geomagnetic conditions increased greatly.
Table 7 lists the information on moderate (41 < Ар < 69), strong (70 < Ар < 99), and severe (Ар > 100) magnetic storms by the Ар index, the corresponding geomagnetic indices Аа and Dst, the active events on the Sun, and the sources of the magnetic storms. On the whole, the geoeffectiveness of solar flare events and coronal holes remains anomalously low: by the geomagnetic Ар index, only two severe magnetic storms and seven strong magnetic storms (Ар ≥ 70) were detected over 9.2 years.
Table 8 illustrates the cycle-averaged number of the magnetic storms of various intensity in the solar cycles of elevated and reduced (for cycle 24) SA and in transition cycle 23.
4 CONCLUSIONS
Thus, the current cycle evolves according to a typical scenario for reliable solar cycles. According to this scenario, the strongest flare events usually occur in the decline phase of the cycle and more rarely at the rise phase. Some features of the development of the last three SA cycles and the pattern of the development of the active regions that are typical for the current cycle confirm the shift in the pattern of magnetic field generation in the convective zone of the Sun. As a result, the Sun entered the period of small and medium solar cycles, or the epoch of the lowered SA, which should last for five cycles (~55 years). The consequence of the observed deficiency in flare-active regions will be a decrease in the number of strong sporadic geomagnetic disturbances and strong proton events; severe and extreme flare events are unlikely.
The geoeffectiveness of high-velocity solar wind fluxes from coronal holes dropped significantly; in the NES, they only caused a relative rise in the number of recurrent, small geomagnetic disturbances (minor magnetic storms with an S0 intensity and substorms), as well as periods of weakly disturbed geomagnetic conditions. The weakening of the removal of the solar magnetic fields led to a decrease in the modulation zone of galactic cosmic rays, significant growth of their background intensity in the interplanetary space and NES (outer radiation belt) and, consequently, to a significant growth of the radiation background of galactic cosmic rays over the entire cycle, not only in the minimum phase. This circumstance closes the possibility of prolonged flights in open space and the presence of manned stations on the surface of the Moon with long-term stays by a single crew. The sporadic heating of the Earth’s atmosphere significantly decreased, which led to increased pollution of the NES (unfavorable conditions for cleaning space debris from low orbits), and other, probably unfavorable, consequences.
Since the Gnevyshev–Ohl rule was followed within the SA epochs with no exceptions, the next solar cycle, 25, should be average—higher than current value (W* ~ 100–120) but by no means high or low. The probable duration of the decline phase of the current cycle is ~6 years; the duration of the entire cycle is ~12 years. The minimum is expected to be reached in the middle of 2020.
Based on observational characteristics of the solar cycles of the reduced SA epoch (Table 1) and the stability of the scenario of the development of solar cyclicity, we can predict with a high degree of certainty that the following four solar cycles will alternate between medium and low.
REFERENCES
Ebert, R., McComas, D., Elliott, H., Forsyth, R., and Gosling, J., Bulk properties of the slow and fast solar wind and interplanetary coronal mass ejections measured by Ulysses: Three polar orbits of observations, J. Geophys. Res., 2009, vol. 114, no. A1. doi 10.1029/2008JA013631
Gibson, S.E., Kozyra, J.U., Kozyra, G., de Toma, G., Emery, B., Onsager, T., and Thompson, B., If the Sun is so quiet, why is the Earth ringing? A comparison of two solar minimum intervals, J. Geophys. Res., 2009, vol. 114, A09105. doi 10.1029/2009JA014342
Gopalswamy, N., Akiyama, S., Yashiro, S., Xie, H., Maekelae, P., and Michalek, G., The mild space weather in solar cycle 24, in Proceedings of the 14th International Ionospheric Effects Symposium “Bridging the Gap Between Applications and Research Involving Ionospheric and Space Weather Disciplines”, Alexandria, Virginia, 12‒15 May 2015, 2015. https://arxiv.org/ftp/arxiv/papers/1508/1508.01603.pdf.
Hao, Y., Shi, H., Xiao, Z., and Zhang, D., Weak ionization of the global ionosphere in solar cycle 24, Ann. Geophys., 2014, vol. 32, pp. 809–816. http://www.ann-geophys.net/32/809/2014. doi 10.5194/angeo-32-809-2014
Harvey, K., Harvey, J., and Sheeley, N., Magnetic measurements of coronal holes during 1975–1980, Sol. Phys., 1982, vol. 79, pp. 149–160.
Hofmeister, S.J., Veronig, A., Reiss, M.A., Temmer, M., Vennerstrom, S., Vršnak, B., and Heber, B., Characteristics of low-latitude coronal holes near the maximum of solar cycle 24, Astrophys. J., 2017, vol. 835, no. 2, id 268. doi 10.3847/1538-4357/835/2/268
Ishkov, V.N., Emerging magnetic fluxes as a key to prediction of large solar flares, Izv. Akad. Nauk, Ser. Fiz., 1998, vol. 62, no. 9, pp. 1835–1839.
Ishkov, V.N., Forecast of geoeffective solar flares: Resources and limitations, Izv. Akad. Nauk, Ser. Fiz., 1999, vol. 63, no. 11, pp. 2148–2151.
Ishkov, V.N., Characteristics of solar activity of the extended epoch of the minimum of solar cycles 23–24, in Tsikly Aktivnosti na Solntse i zvezdakh (Solar and Stellar Activity Cycles), St. Petersburg: VVM, 2009, pp. 57–62.
Ishkov, V.N., Properties and surprises of solar activity XXIII cycle, Sun Geosphere, 2010, vol. 5, no. 2, pp. 43–46.
Ishkov, V.N., Reduced and extended periods of solar activity: Monitoring features and key facts, in Trudy Pulkovskoi konferentsii “Solnechnaya i solnechno–zemnaya fizika-2013” (Proceedings of the Pulkovo Conference “Solar and Solar–Terrestrial Physics-2013”), Nagovitsin, Yu.A., Ed., St. Petersburg: VVM, 2013a, pp. 111–114. http://www.gao.spb.ru/russian/publ-s/conf_2013/conf_2013.pdf.
Ishkov, V.N., Complex active regions as the main source of extreme and large solar proton events, Geomagn. Aeron. (Engl. Transl.), 2013b, vol. 53, no. 8, pp. 971–976. doi 10.1134/S0016793213080070
Ishkov, V.N. and Shibaev, I.G., Solar activity cycles: General characteristics and modern forecasting boundaries, Bull. Russ. Acad. Sci.: Phys., 2006, vol. 70, no. 10, pp. 1643–1647.
McComas, D.J., Angold, N., Elliott, H.A., Livadiotis, G., Schwadron, N.A., Skoug, R.M., and Smith, C.W., Weakest solar wind of the space age and the current “mini” solar maximum, Astrophys. J., 2013, vol. 779, no. 1, id 2. doi 10.1088/0004-637X/779/1/2
Mewaldt, R., Cohen, C., Mason, C., von Rosenvinge, T., Vourlidas, A., A 360° survey of solar energetic particle events and one extreme event, in The 34th International Cosmic Ray Conference, The Hague, Netherlands: 30 July–6 August, 2015. https://pos.sissa.it/236/139/pdf.
Otkidychev, P.A. and Skorbezh, N.N., Specific features of solar activity cycle 24 and their correlation with general regularities of cycles 19–23, in Trudy Pulkovskoi konferentsii “Solnechnaya i solnechno–zemnaya fizika-2013” (Proceedings of the Pulkovo Conference “Solar and Solar–Terrestrial Physics-2013”), Nagovitsin, Yu.A., Ed., St. Petersburg: VVM, 2013, pp. 187–190.
Paassilta, M., Raukunen, O., Vainio, R., et al., Catalogue of 55–80 MeV solar proton events extending through solar cycles 23 and 24, J. Space Weather Space Clim., 2017, vol. 7, id A14. doi 10.1051/swsc/2017013
Selvakumaran, R., Veenadhari, B., Akiyama, S., Pandya, M., Gopalswamy, N., Yashiro, S., Kumar, S., Mäkelä, P., and Xie, H., On the reduced geoeffectiveness of solar cycle 24: A moderate storm perspective, J. Geophys. Res.: Space Phys., 2016, vol. 121, no. 9, pp. 8188–8202. do 10.1002/2016JA022885
Shibaev, I. and Ishkov, V., Investigation of the statistical characteristics of Wolf numbers reliable series: Signs of solar cycles likelihood, Proc. 7th Scientific Conf. “Space, Ecology, Safety-2011”, Sofia, Bulgaria, Nov. 29–Dec. 1, 2011, 2012, pp. 297–301. http://www.space.bas.bg/BG/magasin/SES/PROCEEDING/20SES/202011.pdf.
Vasil’eva, V.V. and Tlatov, A.G., Comparative analysis of the properties of coronal holes in cycle 24 of solar activity, in Trudy Pul’kovskoi konferentsii po fizike Solntsa. Solnechnaya i solnechno–zemnaya fizika-2015 (Proceedings of the Pulkovo Conference on Solar Physics: Solar and Solar–Terrestrial Physics-2015), Stepanov, A.V. and Nagovitsin, Yu.A., Eds., St. Petersburg: VVM, 2015, pp. 39–42.
Wang, Y., Coronal holes and open magnetic flux, Space Sci. Rev., 2009, vol. 144, nos. 1–4, pp. 383–399.
Author information
Authors and Affiliations
Corresponding author
Additional information
Translated by M. Chubarova
Rights and permissions
About this article

Cite this article
Ishkov, V.N. Space Weather and Specific Features of the Development of Current Solar Cycle. Geomagn. Aeron. 58, 753–767 (2018). https://doi.org/10.1134/S0016793218060051
Received:
Published:
Issue Date:
DOI: https://doi.org/10.1134/S0016793218060051