
Abstract
The Search for Hidden Particles (SHiP) experiment is a new general-purpose fixed target facility proposed at the CERN Super Proton Synchrotron (SPS) accelerator to search for long-lived exotic particles associated with Hidden Sectors and Dark Matter. This paper reports on the structural design of SHiP’s decay volume, a > 2000 m3 conical vessel under vacuum that should host several large particle physics detector systems. In the field of structural and seismic engineering, the design study in a very multidisciplinary international collaboration has represented a stimulating research challenge. The goal of the design of the decay is to produce a structure as light and as slim as possible to stay within the geometrical envelop determined in the physics simulations. A complete study has been performed with all the steps from the conceptual design, including the interaction with other components and the plant systems, to the assembly procedures for the decay volume realization. The complexity of the case study has been driven by the need of finding the appropriate compromise between the physics performance, the structural aspects, the executive, constructive and operational issues, and the economical constraints. The assembly strategy, the welding techniques, and the expected construction time are discussed in view of the extremely complex installation phase. Building Integrated Model (BIM) methodology is also proposed as an essential tool to coordinate the entire process of designing and managing not only the decay volume but the entire project.
1 Introduction
The Search for Hidden Particles (SHiP) experiment is a new general-purpose fixed target facility proposed at the CERN Super Proton Synchrotron (SPS) accelerator to search for long-lived exotic particles associated with Hidden Sectors and Dark Matter, initially proposed in 2013 [1] and progressively reviewed [2]. A comprehensive design study report presents in detail the SHiP project [3]. The facility is designed to maximise the production and detector acceptance while providing a detection volume with extremely low background from ordinary particles [4].
This paper reports on the preliminary structural design of SHiP’s decay volume, a > 2000 m3 conical vessel under vacuum that should host several large particle physics detector systems. Figure 1 shows an overview of the entire SHiP apparatus with the decay volume in grey. In the field of structural and seismic engineering, the design study in a very multidisciplinary international collaboration has represented an important and stimulating research challenge. It is to note that the complexity and the unicity of the case study are represented by the need of finding the appropriate compromise between the physics performance, [e.g. 5] the structural aspects, the executive, constructive and operational issues, and the economical constraints [6]. While the project requires a strategy similar to what is applied in civil engineering, the type of structure, the loads, the constraints from surrounding systems, and the safety requirements are very different from the ones related to normal civil structures. Then, the structural design of the decay volume is a really interesting and helpful case study to go deep inside issues never found in the normal civil infrastructures/buildings. The choice and design of the decay volume structure have been based on an evaluation of several options with the goal of producing a structure as light and as slim as possible to stay within the geometrical envelop given by the deflected flux of background muons from the proton beam target whilst maintaining the required acceptance for the particles targeted with the experiment [3]. After investigating different options reported on below, a structure based on S355JO (J2/K2)W Corten steel has been chosen, as it provides the most suitable solution to minimise the mass, given the geometry. Moreover, the necessity of producing a vessel wall structure with a hollow section between an internal and external plate for the integration of a detector system covering the entire volume has added another point in the approval of steel as the optimal solution. This hollow section, which, together with the structural skeleton of the decay volume, is split into compartments, should be filled with a “liquid scintillator” to detect particles penetrating the volume from outside. The two conditions of having these compartments for containing the liquid scintillator and reducing as much as is it possible the thickness of the plates has driven the design towards the use of closure plates as a second external steel skin contributing to the stiffness and strength of the section. The final design of the decay volume can be classified as a steel structure in a welded composition. In detail, the optimisation has led to a wall structure composed of an internal 20/30 mm thick continuous steel sheet acting as a vacuum liner reinforced by 10 mm thick transversal (azimuthal) strengthening members that are spaced by 800 mm. The structure is further reinforced by longitudinal stiffening profiles between the transversal beams. This allows maintaining a height of the stiffening members varying from 300 mm upstream to 390 mm downstream. Another shell is welded to the stiffening members to form the compartments for the liquid scintillator. In addition, the conical shape of the vacuum volume gives rise to a resultant compressive force in the axial direction. The outer shell should provide channelling of this compressive force to propagate it to the decay spectrometer vacuum section. The force is finally taken by the spectrometer magnet (in blue in the Decay Spectrometer in Fig. 1) which is defined as the fixed point for the entire train of vacuum vessel sections. The current model has been implemented with the structural software Robot Structural Analysis Professional [7]. The model also includes the support structure. The fixation system is designed to prevent vertical and transversal displacements of the decay volume while allowing longitudinal displacement with the spectrometer magnet as the fixed point. The design has been verified based on Eurocodes [8,9,10] recommendations in terms of stresses and deformations in three different scenarios of loads, ultimate condition combination, exercise condition combination, and seismic combination. The actions from the end-caps of the decay volume have also been considered in the model. The preliminary design work has been reviewed by the CERN safety engineers from the Occupational Health & Safety and Environmental Protection (HSE) unit to ensure that the design accounts for the structural safety norms allowing access to the underground hall while under vacuum, and the earthquake loads in the region.

Overview of the SHiP experiment
The complexity, the multidisciplinary nature, and size of the SHiP project severely challenges design information management. An appropriate approach to BIM integration is fundamental for the organisation of the whole project. As part of the design study for SHiP’s decay volume, a novel methodology is being developed to coordinate the entire process of design and integration, and managing the various levels of information related to the characteristics of each component, timelines, procedures, safety and cost.
2 General overview of the SHIP project
The SHiP research facility is composed of large infrastructure with a dual detector system (Fig. 1). The upstream system is specialised in the direct detection of Dark Matter and in performing measurements on neutrinos. The second detector system is dedicated to searching for decays of so-called Hidden Particles and allows probing a large variety of physics models with light long-lived exotic particles. It is based on a 50 m long decay volume followed by a spectrometer with an aperture of 5 m × 10 m and by detectors for particle identification A critical component of SHiP is the muon shield [3]. It consists of a chain of magnets that deflect away from the detector the high flux of muons produced in the beam target that would otherwise represent a very serious background for hidden particle searches. The deflected flux of muons defines a conical region in which the decay volume and the detector systems may be placed. To suppress the background from neutrinos interacting in the fiducial volume, the decay volume must be maintained at a pressure of < 10–3 bar by means of a vacuum vessel. The downstream spectrometer is designed to accurately reconstruct the decay of the particles of interest and reject residual background particles.
SHiP's vacuum vessel has a total volume of ~ 2040 m3 and logically consists of two parts, the volume in which a decay vertex is accepted, and the spectrometer section [3]. The spectrometer section runs through the spectrometer magnet and lodges four tracker stations, which are symmetrically located with two stations upstream and two downstream of a large spectrometer magnet. An upstream and a downstream end-cap close off the ends of the vacuum vessel. The end-cap material budget is equivalent to ~ 0.8 radiation lengths to minimise the risk of neutrino and muon interactions in the upstream end-cap and not spoil the performance of the detectors downstream. To further ensure that signal candidates are not produced by neutrino or muon interactions in the upstream detector system or the decay volume walls, the decay volume is completely covered by a high-efficiency background tagger system which is capable of detecting the charged particles produced in the interactions with the surrounding structure. The current baseline for the background tagger system is based on a “Liquid Scintillator detector” which fills the compartments in the wall structure of the decay volume. The liquid scintillator is based on the solvent Linear Alkyl-Benzene (LAB) adding 2 g/l Di-Phenyl-Oxazole (PPO) as fluorophore [3]. The detection of particles crossing the liquid scintillator is performed by means of two photodetectors mounted to the outer wall of each compartment through holes of very small diameter. In addition, the compartments will need hydraulic fittings for the circulation of the liquid scintillator. The exact layout of this system is still under study together with the need for a coating of the inner wall of all compartments to ensure adequate reflection of the scintillating light and chemical compatibility between the liquid scintillator and the steel. The upstream end-cap is covered on the outside by a Multi-gap Resistive Plate Chamber (MRPC detector) mounted on the face of the cover.
3 Structural design of the decay volume
The structural design of the decay volume starts from the specific features outline above. Three different options have been investigated for the structural typology of the decay volume:
-
1.
RC (Reinforced Concrete) structure;
-
2.
Composite structure with concrete and steel;
-
3.
Steel structure.
3.1 RC structure
The initial idea of using an RC structure was based on the considerations that the use of the formworks for the concrete could easily support the complex shape. Moreover, the economic aspect and the ease of execution were advantages of this solution. However, the risk of developing cracks for low-stress levels due to the limited tension strength of concrete and the need for having walls with a significant thickness (and hence significant mass) made this hypothesis incompatible with the requirements.
3.2 Composite structure with concrete and steel
The second solution has been a composite structure with concrete and steel. This solution allowed a reduction of the mass with respect to the previous solution, However, this solution led to a difficult integration of the liquid scintillator, requiring an additional independent structure with specific and independent boxes. Moreover, in this solution, there were also executive and functional difficulties, mainly related to the huge variation of strength and stiffness in the different zones of the decay volume. In particular, the negative bending moment (tensile stresses) forced to have nodal zones with very large dimensions. The possibility of only using concrete in the central compressed zones has also been investigated, but this option was highly problematic at the level of execution.
3.3 Final solution: advantages with respect to the previous solutions
Finally, among the different possibilities, considering the goal of minimising the masses and the constraints on the geometry, the steel structure has been chosen. The steel has a mechanical efficiency (relationship between strength and specific weight) significantly higher than the other options. Moreover, the lightness, ductility and energy dissipation capacity make steel structures a recommended solution in seismic areas. Other advantages of steel construction systems concern the speed and accuracy of assembly on site, the possibility of transformations and repairs due to reversibility of the connections between the structural elements, and the environmental sustainability for its characteristics of recyclability and reuse.
The following design iteration has been done in the choice of the most appropriate steel section. The main conditions to consider in the design process were:
-
1.
the necessity to allocate space for the liquid scintillator inside specific compartments around the entire decay volume;
-
2.
the necessity of reducing the thickness of the steel plates as much as possible.
Based on these guidelines, a box section based on S355JO(J2/K2)W Corten steel elements has been selected. A 3D view of the decay volume is presented in Fig. 2.

3D view of the decay volume as implemented in the structural analysis
The box section is made up by the following members:
-
Inner and outer steel sheets with a thickness of 20 mm, with the exception of the last 16.4 m along which the thickness is 30 mm (see Fig. 3a);
-
transversal stiffening members spaced by 800 mm, with a thickness of 10 mm and a height of about 400 mm (see Fig. 3b). In particular, the height is equal to 300 mm in the first 14.4 m, due to a specific requirement of remaining inside the envelope defined by the deflected muons background, while it is 410 mm for the following 19.2 m, and 390 mm for the last 16.4 m;
-
longitudinal stiffening elements, with a thickness of 10 mm and with an interspacing varying from 804 to 1702 mm (see Fig. 3c).
Fig. 3 
a Inner steel sheet; b transversal stiffening members; c longitudinal stiffening members

The design of the structure leads to a total of 1848 compartments for the liquid scintillator detector. Studies with a prototype compartment in test beam [11] have verified that the dimensions given by the vessel skeleton of about 800 mm × 1200 mm are acceptable. The total weight of structure and plates forming the decay volume is about 550 tons. The resisting structure is mainly constituted by the internal steel plate reinforced with the welded transversal stiffening members in the two perpendicular directions. This structural choice is typical in bridges and in boats constructions. Hence, the decay volume can be classified as a steel structure with a cross section in a welded composition. Moreover, there are longitudinal stiffening elements to reduce the height of the compartments and there is an external steel plate needed to contain the liquid scintillator, that form the box section. Conceptually, there are two steel plates kept together by the stiffening members. This helps in increasing the strength of the sections. In the transversal plane, their behaviour is that of a box. The internal and external steel sheets work together, sharing similar stress levels in the transversal direction. This is due to the condition that the transversal stiffening members are spaced by only 800 mm. In the longitudinal direction, the internal and the external sheets show less collaboration in sharing the action as the distance between the longitudinal stiffening members go from about 800–1700 mm. As previously said, the dimensions of the double-wall structure change along the 50 m length of the decay volume (see Fig. 2). Figure 4a shows the initial cross-section of the decay volume. The transverse dimensions of the internal steel sheet are about 2 m × 4.5 m and the external steel sheet about 3 m × 5.5 m. Figure 4b shows the final cross-section. The transverse dimensions of the internal steel sheet are 5 m × 11 m and the external sheet about 6 m × 12 m.

a Initial section of the decay volume (z = 0 m); b final section of the decay volume (z = 50 m)
Moreover, there are two other characteristic sections along the longitudinal direction:
-
A reduced height of the transversal stiffening members is considered for the first 14.4 m. Up to this section, the height of the transversal stiffening members is 300 mm; while from the section of the decay volume at z = 15.2 m, the height of the transversal stiffening members is 410 mm. The slope is constant for the internal steel sheet, while it changes for the external steel sheet.
-
From the section at z = 33.6 m, the spacing between the longitudinal plates is reduced (effectively halved at that point) to avoid excessive length of the plates and then the possibility of the buckling phenomenon. The internal and external sheets’ thickness is also changed from 20 to 30 mm.
The upstream end of the decay volume is closed with an aluminium wall bolted to the decay volume, while the downstream end is interfaced with the vacuum chamber of the spectrometer section through a bolted flange.
The support elements below the decay volume are spaced by about 4.3 m and is built from HE steel profiles together with tube-shaped profiles (see Fig. 5a and b). The fixation system is designed to avoid vertical and transversal displacements while allowing for a limited longitudinal displacement to accommodate the compressive action. The downstream section is connected through the spectrometer section to the spectrometer magnet that represents the fixed point of the entire system.

a The HE steel profiles and the tube shaped profiles forming the support structure and b the whole structure including also the support system
3.3.1 Load combinations
With respect to the structure of the decay volume, the verifications in terms of stresses and deformations have been done based on three different combinations of loads (i.e., Ultimate condition combination, Serviceability combination and Seismic combination), according to Eurocode 0 [8]. The actions from the end caps of the decay volume have also been considered in the model. Herein, the three combinations are presented in details:
-
Ultimate combination (UC) in this combination, the loads are considered as follows:
where G1 represents the structural loads (the weight of the steel plates); G2−1 represents the atmospheric radial pressure (10−3 bar = 10.6 ton/m). The pressure is also active on the end caps. G2−2 = scintillator liquid load on the longitudinal stiffening elements (γliquid = 900 kg/m3).
An additional configuration of the ultimate condition has been considered in the design project, in which the atmospheric radial pressure has been increased by a factor of 1.5 to be more conservative to consider possible variable effects of non-constant overpressures in the phase of application and or malfunctioning. The envelope of the two combinations has been used to configure the ultimate state condition.
-
Seismic combination (SC) in this combination, the effect of the seismic actions is considered though the following formulation:
where G1, G2−1 and G2−2 are defined as above, while: Ex is the seismic action in the longitudinal direction, considering an elastic spectrum; Ey is the seismic action in the transversal direction, considering an elastic spectrum;
For the horizontal components of the seismic action, the elastic response spectrum Se(T) is defined using the expressions provided in Eurocode 8 part 1 [9] and the values of the parameters describing the recommended Type 1 elastic response spectra, presented in the same Eurocode 8 part 1 [9]. For the anchorage acceleration at the bedrock, a value of 0.11 g has been used. It corresponds to a return period of 475 years [12]. As a ground type, soil B is considered. However, in the next step of the design, a detailed geological study has been requested. Finally, a more in depth discussion is needed to define the coefficient of importance to be applied to the spectrum. Figure 6 shows the elastic spectrum used in the calculations.

Elastic spectrum Type A from Eurocode 8 Part 1 for the site of the experiment
-
Serviceability combination (SEC) with this combination, the serviceability condition is checked:
where G1, G2−1 and G2−2 are defined as above. Temperature variation effect is neglected since the maximum temperature variation during the year is expected to remain within 2–3 °C.
3.3.2 Structural analysis
The structural calculations have been performed with the software Robot Structural Analysis Professional [7]. In addition, a simplified model has been developed using SAP 2000 [13] and manual calculations have been done to validate the models. Robot [7] is a finite element software. The steel plates have been modelled as two-dimensional shell members incorporating all the properties of the plate behaviour. The plates have the two main stresses in the plane of the plate and there are axial load, shear and flexure in the thickness of the plate. A very fine mesh has been used in the calculations. Since the structural elements are metallic plates modelled by shell elements, the stresses are represented in the following figures by the colour mapped contour plots of the stresses. These plots do not necessarily show concentrated stress points. These zones are not significant since they are products of the analytical model, and not the real stresses in the strict sense. Connections between shell elements can exhibit similar issues. Instead, the active stress of the shell element should be read at the edge of the section of the element. As a result, the peak stresses shown in the following figures are related to very concentrated zones, while the average tensional state present in the plates is significantly less.
The rest of this section separately evaluates firstly the stress configuration related to the actions applied to the structure based on the conditions UC and SC, and secondly the displacement configuration based on the SEC, including the safety verifications. Finally, it is to note that the fundamental vibration period of the structure is 0.14 s.
3.3.2.1 Stress paths and safety checks
With respect to the global behaviour of the decay volume, the structural performance in the transversal direction is that of a box. In particular, the internal and external steel sheets collaborate quite equally sharing the stresses (the stresses paths are similar). This stems from the condition that the transversal stiffening members are spaced by only 800 mm. In the longitudinal direction, the two plates show less collaboration in the sharing of the actions. This is due to the larger distance between the longitudinal stiffening members that ranges from 800 mm up to 1700 mm.
Figures 7, 8, 9, and 10 present the stress paths on the internal and the external steel sheet, and on the transversal and longitudinal steel stiffening members, respectively. The different load combinations and the different stress directions are shown. With respect to the local axes shown, x is represented with cyan colour, y with green colour and z with red colour.

Stresses path on the internal steel sheet: a UC σx; b UC σy; c SC σx; d SC σy

Stresses path on the external steel sheet: a UC σx; b UC σy; c SC σx; d SC σy

Stresses path on the transversal stiffening members: a UC σx; b UC σy; c SC σx; d SC σy

Stresses path on the longitudinal stiffening members: a UC σx; b UC σy; c SC σx; d SC σy
Two typologies of stress verification have been performed for the steel plates. For a thin plate, the phenomenon of instability is a function of a high number of variables, such as dimensions, geometry, constraints and types of loads, making the phenomenon more complex than in a mono-dimensional member. For the study of the instability, the plates of the decay volume have been considered as thin rectangular plates, resting on all four sides and being subject to a compression load. This configuration is the simplest constraining condition load for the study of instability and is similar to the behaviour of a Euler beam. When the load exceeds the critical threshold, instability is reached, resulting in a deformation in the central area. This deformation is greater in the central zone and tends to be negligible near the boundaries. An energy approach has been used to determine the critical load starting from the definitions of potential energy and deformation of the plate with the hypothesis of small displacements with respect to the thickness. In this case, the critical tension, for a uniform rectangular plate, with various constraints and loaded by a force in the plan or a shear force, is given by the following expression (Eurocode 3, [10]):
where σc is the active compressive stress, while σcr,p is the critical stress defined as:
where the value of the instability constant \(k_{{{{\sigma,{\rm p}}}}}\) is a function of the geometry, the type of load applied and the constraints placed and:
where E is the Young modulus; t is the thickness of the plate; ν is the Poisson modulus; b is the geometrical dimension of the plate in the direction of the applied load;
With respect to the verification of the global tension resultant, the equivalent stress of Von Mises is used instead to characterise the active tension. Eurocode 3 [10] also treats the stress resultants and stresses in shells. In each plate of the structure the design value of the equivalent Von Mises stress is taken based on the stresses determined in a structural analysis that considers the laws of equilibrium between the imposed design load and the internal forces and moments. In particular, a linear elastic shell analysis is done. The linearity of the theory results from the assumptions of a linear elastic material law and the linear small deflection theory. Small deflection theory implies that the assumed geometry remains that of the undeformed structure. The safety check is done using the six stress resultants in the shell wall, i.e., the three components of the normal stresses and the three components of the tangential stresses. Then, the Von Mises equivalent stress verification is as follows Eurocode 3 [10]:
where σequiv is the Von Mises equivalent stress, while fyd is the yielding design tension in the steel since no excursion in the plastic field are admitted for the structure. Equation 8 gives the calculation of σequiv:
where \(\sigma_{i}\) and \(\tau_{ij}\) are the normal and the tangential stresses in the different directions of the plate.
Table 1 presents a summary of the stress verifications for the conditions UC and SC. For all the different typologies of plates, the maximum ratio between the active stress and the critical stress (called demand over capacity ratio) over the entire section of each plate (e.g., among all the sub-plates, defined by the intersections with other members, that form the entire section of the plate) is reported for both buckling and Von Mises equivalent stress verifications. Moreover, the longitudinal position of the plate is reported in the table, using the position of the barycentre of the plate in the global reference system. Due to the symmetry along with the x and y directions, the values for all the plates at a given longitudinal position are very similar.
The general trend in the stress verifications for the conditions UC and SC shows a condition of global safety for all the steel plates. The maximum ratio between the active stress and the critical stress for the plates varies generally between 0.3 and 0.7 for both the buckling verifications and Von Mises equivalent stress verifications. However, there are some concentrations of stress in specific zones of the plates, such as at the boundary and at the corners, for which the ratio arrives at a maximum of 0.95. This is due to modelling issues and/or executive level details, that will be addressed in the following steps of the design. The structural behaviour of these zones will be studied in detail in the future with specific and more accurate modelling of these areas. For example, with reference to the transversal stiffening members in the current design some overstresses (von Mises stress for the condition UC) are present in the corners. The overstress in these zones can be mitigated with different techniques, for example by rounding the corners or using a bigger thickness in the corners. Another point is related to the zone of overstress in the longitudinal stiffening members in the most downstream section. This issue can be evaluated only when the connection between the decay volume and the spectrometer section has been defined. Currently, it is assumed that the interface will consist of two flanges bolted together. The number and position of the bolts and the structural configuration of the connecting plate can strongly influence the stress configuration in the last section of the decay volume. The resulting safety margins leave room for a possible need to increase the importance factor in the calculation of the seismic actions. Nevertheless, the current structural design is complete and reliable, the main uncertainty comes from the ongoing physics optimisation of the overall geometrical envelop which can affect the structure and dimensions of the decay volume. The next stage of the design will be the definitive executive level and it will be finalized when all the information about the connection with the spectrometer section and the magnet will be available. At this level, specific attention will be put also on the study of the EN-13-445 [14], that treats the verifications of the vacuum containment.
3.3.2.2 Displacement paths and safety checks
Figure 11 presents the displacement paths with respect to the SEC of the loads. The higher values of the displacements are in the transversal direction of the decay volume (axis X in Fig. 11), while the displacements are negligible in the other directions.

a Displacement paths on the plates of the decay volume along the global axis X for the serviceability condition
The maximum displacement is about 13 mm in the most critical section (Fig. 12). Currently, the safety checks for the plates are satisfied based on a value of H/250 as the maximum allowed displacement, where H is the plate’s height. This value could also be relaxed in the next stages of the project.

Serviceability verification for the maximum displacements
4 Welding techniques and assembly procedures
The choice of the most appropriate and modern metal forming techniques is recommended for the realization of the decay volume (also consider the high number of holes to be realized inside the plates to let the LS passing through), such as for all the other components of the project [15,16,17,18]. In addition, the welding techniques are of critical importance in this project. In view of the vacuum and the containment of the liquid scintillator, all the welds must be full penetration welds with high tightness, based on the EN 1090 [19, 20] recommendations. To minimise the duration of the works at the experimental area and reduce costs, the weld works should be executed in factory as much as possible, respecting the constraints from the transportation. In total, there are 6416 and 2754 linear meters of welds in the factory and in situ, respectively. The weight of these welds is around 15 tons.
The EN 1090‐2 [20] for steel propose a recommended procedure for determining the class of execution is in 3 steps:
-
(a)
Selection of the class according to the potential impact in terms of predictable human, economic or environmental consequences of a collapse of the component. Considering that the project is based on public funding and consists of a large international collaboration, consequence class CC3 has been chosen.
-
(b)
Selection of the service category: Considering the medium risk of seismic activity, service category SC2 has been chosen.
-
(c)
Selection of the production category: The structural requirement for a welded system with yield strength higher than S355 translates into production category PC2.
-
(d)
Determination of the execution class based on the result of the operations referred to in points a), b) and c).
EN 1090-2 presents different schemes for the functional manufacturing tolerances to be respected for the stiffened plates. Following this procedure with the tolerances required for the decay volume, the execution class EXC4 has been selected.
Another important issue is represented by the welding sequence and by the assembly procedure of the decay volume. Figure 13a shows a scheme of the weld works for the transversal section. Figure 13b shows a scheme of the weld works for the horizontal section, while Fig. 13c presents all the typological details of the weldings.

a Scheme of the weldings for the transversal section; b the typological details of the weldings; c scheme of the weldings for the horizontal section of the lateral wall and for the vertical section of the roof/floor
To adapt to normal transportation, the chain production for the assembly of the decay volume foresees producing modules of fully assembled double-wall panels with a width of 2.4 m and full height, as shown in Fig. 14.

Basic component consisting of double-wall panels welded in the factory
The production chain in the factory is based on the two following operations:
-
Figure 15a: The first operation is to assembly the basic components by welding the transversal and longitudinal stiffening members on the internal steel sheet;
-
Figure 15b: The second operation is to weld the external steel sheets on the pre-assembled basic component, with the exception of the ending half modules, which are left open for the welding to the adjacent modulus in situ.
Fig. 15 
Welding operations in factory

The following procedure has been proposed for the assembly at the location of the experiment:
-
Figure 16a: the first operation is to weld the different basic components from the factory in correspondence of the section of 40 cm from the transversal stiffening members;
-
Figure 16b: the second operation is to weld the external steel sheet in the corner compartments;
-
Figure 16c: the third operation is to weld the external steel sheet in the vertical compartments where the different steel components have been welded together in situ.
Fig. 16 
Welding operations for the final assembly at the location of the experiment

Figure 17 illustrates the final steps of the assembly procedure with the civil infrastructure, the assembly hall and the underground hall. This operation is fundamental to optimise the timeline and to avoid conflicts with the assembly of the other detector components. The goal is to minimise the welding operations and the space required underground to avoid conflicts with other operations.

Scheme of the in situ infrastructures
Figure 18 presents a scheme of the principal phases of the in situ assembly of the decay volume. The most challenging point is to reduce as much as possible the welding activity in the underground experimental hall. A big effort has been put on simulating all the construction phases, considering also the in situ area (available spaces, plant system etc.). Consequently, as shown in Fig. 18, four blocks of about 12 m (lateral walls, upper and lower walls) will be pre-assembled as previously described and then lowered by the cranes. Then, the final weldings among these blocks will be made underground to complete the assembly of the whole decay volume.

Scheme of the principal phases of the in situ assembly underground (units in mm)
Finally, Fig. 19 shows a 3D artistic view that summarises the in situ assembly operations described. In particular, Fig. 19a and b show the assembly respectively of lateral walls and upper wall to form the 12 m-block. Figure 19c shows the operations of lower the pieces underground by the permanent 40 tonne cranes for final installation in the experiment, while Fig. 19d proposes a global plan view of the experimental hall.

3D artistic view of the assembly procedures
The estimated time for the complete work is 15 months, based on a partial overlap of the different sub-activities. Three different phases are expected:
-
3 months for materials provision;
-
7 months for prefabrication;
-
7 months for the realization of the object in situ.
In particular, the second and the third phases can be partially overlapped to reduce the total time of production and assembly from 17 to 15 months.
5 BIM integration
A preliminary study has been made regarding the integration of all the sub-components involved in the decay volume project by means of the Building Information Modeling (BIM) methodology. The plan is to extend this methodology to the entire SHiP project. The need of storing and managing design data gathered form different design teams emerges as a critical issue. The project is characterised by a high degree of complexity, the involvement of several design disciplines, and the high level of detailed information required about all components to prepare the construction. BIM represents an essential strategy for coordinating all the sub-components involved in the project and managing the progress of all the planned activities in an optimised manner. With this methodology, the management of the project is associated with the following objectives:
-
1.
Development of high precision construction details;
-
2.
Coordination between the different project disciplines;
-
3.
Monitoring and control of project time and costs;
-
4.
Management of the project construction phases and procedures.
As the research facility will be operated by the same teams that are involved in the development, this strategy can also be extended to managing the operational phase, in terms of procedures for access and interventions, and safety.
In particular, in the BIM process, through the use of Revit [21] software, the decay volume has been modeled and imported into Robot [7] to carry out the structural analysis and the safety checks (Sect. 5.1). Once the model has been verified, it has been re-imported into Revit [21] for the export of geometric data and the input for the constructive model. Subsequently, the model of the decay volume made with Revit [9], the models of the other sub-components and the model of the experimental area and the model of the terrain and infrastructure surrounding the experimental area (also called assembly hall) will be federated into Navisworks [22], as described in detail in Sect. 5.2. The described procedure is summarized in the flowchart presented in Fig. 20.

Flowchart of the BIM process
5.1 Development of high precision construction details
The strategy proposed here is based on the development of a BIM model using the Autodesk Revit software [21], starting from the available CAD documentation and any additional information available from the SHiP research and design teams (Fig. 21a). The Revit model is very useful also because it is very easy to import it in the Robot [7], used for the structural calculations (Fig. 21b). Initially, the BIM model will be structured according to a Level of Development (LOD) 350, in accordance with the AIA USA referred to BIM Forum LOD Spec. 2015, corresponding to a detailed design level. Then, an improvement of the design process will be carried out through the 3D coordination of the disciplines and through a clash detection process, which aims at identifying possible geometric interferences between the design disciplines. The check is performed using the Autodesk Navisworks software [22] through multiple tests aimed at detecting clashes between objects within the same sub-component (e.g. Systems vs Systems) and between different sub-components of the project (e.g. Systems vs Structure). As soon as the BIM model of a sub-component has been cleared of any interference with the other project components, the development of the construction level will follow, bringing the model to a higher detailed level (LOD 400), corresponding to a construction level. From this model, it will be possible to directly export the construction tables in .dwg format in order to support manufacturing, assembly and construction activities.

5.2 BIM coordination, monitoring and control of the project time and costs
The main objectives of the 3D integration activity through BIM concern the depository of all the important information regarding the project, the catch of the possible mismatches between simulation software models and CAD drawings and the assessment of the interferences between the various components of the design project and the development of a detailed forecast for the project construction time and costs. Based on this, the proposal regards the use of a Model Checker software, such as Navisworks, that integrates in a unique 3D model all the individual models of each design component. The Naviswork software is capable of supporting the Project Management for the integrated project revision. It allows coordinating and synchronizing the work from the different design teams, to ensure efficient collaboration among project stakeholders, thus preventing design issues due to potential miscommunication. Ultimately, it has the aim of encouraging the appropriateness of design project solutions with a focus on the verification of the feasibility and the safety of the design phase.
The proposed Navisworks software offers advanced integration capabilities that can be summarized in the following points:
-
Storage of information for each sub-component (material, origin, history, owner, version, etc.)
-
visualization and navigation of the 3D models imported from the various 3D modelling softwares (see Fig. 22);
Fig. 22 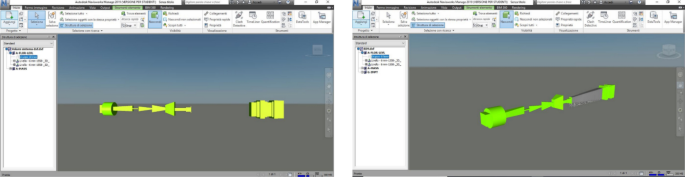
Visualization of the 3D coordination model in Navisworks [22]
-
identification of potential interferences between the modelled components (Clash Detection analysis);
-
integration between 3D models and the construction schedule, in order to visually simulate all the tasks involved before the project execution;
-
detailed analysis of the costs directly associated to the individual elements present in the model.

A visualization and navigation of the model (Model Walkthrough), shared between the design team members, allow identifying and correcting in a timely manner potential conflicts between the various phases regarding the construction process. Thus, the proposed tool intends to limit the impact of these potential conflicts in the implementation phase with the aim of preventing time and cost overruns. In addition, this process is essential to facilitate the planning and the management of the site logistics, such as the temporary storage of materials and space required for certain operations. As discussed below, another critical aspect is the management of the site safety. The visualization of the model enables the construction safety coordinator to perform accurate considerations on the risks deriving from the interference between the different operations.
Table 2 proposes an example of the matrix of BIM integration areas and SHiP challenges. At this stage, this table is to be intended as a milestone to be reached in the following phase of the project (technical design phase), when the information from all sub-components will be available. It is to note that the interaction among the different components can be of two levels:
-
High-level interference (Hard Clash HC): Interferences deriving from geometric interpenetrations between two or more elements.
-
Low-level interference (Soft Clash SC): Interference deriving from non-compliance with distances between elements for reasons of maintenance, installation or regulatory distances.
The complexity of the SHiP project and the many stakeholders involved require detailed modelling of the procedural steps together with the design of the components, so called 4D modelling. The preparation of the schedule of the activities is done through a dedicated function called Timeliner. It dedicates a big attention to the design project temporal phases of the works. The Timeliner provides the Project Manager with an advanced activity planning tool integrated with the models developed by the different design teams. The individual elements of the project are uniquely associated with the activities of the time schedule, previously defined using Project Management softwares. In this way, Navisworks, through the Timeliner, plots the simulation of the progress of the works to support the possible planning/coordination/managing process in the execution phase.
As an international research facility, SHiPs funding scheme relies on large number of national funding agencies and other independent sources, each with its own funding cycles. Maintaining an up-to-date and detailed view of the costs of all components and the common infrastructure throughout every step of the project is a critical aspect. 5D modelling with an integrated approach to assessing costs allows efficiently extracting relevant cost breakdowns and cost profiles for any portion of the works. Impacts of changes within the model can be evaluated and planned for immediately. Safety is yet another dimension of the project. The intention is to integrate safety coordination into the BIM model by adding safety-related information to the components during the design phase. This allows interrogating the model for an inventory of hazardous material and procedures involving certain risks during the different phases of the project. Information about risks will be used to prepare countermeasures and to provide guidelines to the planning of the construction phase.
6 Conclusions
This paper reports on the preliminary structural design of a key component of the research infrastructure for the SHiP experiment, which is a new proposal to be operated at the SPS accelerator at CERN. The optimisation and the design of the ~ 2000 m3 vacuum vessel acting as the particle decay volume, together with the integration of several critical detector system, constitute a novel challenge in structural engineering. The type of structure, the geometry, the loads, the constraints and in general several requirements are completely different from the ones related to normal civil buildings. The design criteria for the decay volume structure is driven by the interplay between the physics performance, and the structural, executive, and operational aspect. The primary requirements consist of producing a structure as light and as slim as possible to minimise unwanted particle interactions in the vessel walls and to restrict the shape and dimensions to the geometric envelop defined by the flux of background particles. The choice of the structural scheme and of the shape/dimensions of the sections is provided in the best way to optimize the exercise condition of the experimentation. All the steps from the conceptual design to the assembly procedures for the realization of the decay volume are outlined in this paper. The complexity of the case study is mainly in finding a right equilibrium/compromise among the physic experimentation, the structural aspects, the executive, constructive and operational issues and the timeline boundaries. The complexity and the multi-functional role of the decay volume demands an extensive finite element analysis of the load conditions in several iterations and in several scenarios. A procedure has been developed and the first verifications of the stresses and the displacements for the ultimate and for the seismic combinations show a condition of global safety for the entire structure. All the faces of the chain production and the assembly of the decay volume has been investigated in detail. In the current design, the tolerance management during the final assembly is identified as one of the main construction challenges. All weld typologies have been specified based on execution class 4. The resulting design and the timeline for the implementation and the construction respects well the overall requirements from the project. Finally, an extended BIM methodology to coordinate the entire process of designing and managing the decay volume project is under development to extend the same detail level of the decay volume to all components of the SHIP experiment. The plan is to generalise this new approach to the entire SHiP project as an extreme use case of complexity and multi-disciplinary design. In addition to this aspect, the intention is to extend the application of the BIM Methodology to Augmented Reality applications to achieve maximum precision in the assembly sequences of the experiment.
Data availability statement
Some or all data, models, or code that support the findings of this study are available from the corresponding author upon reasonable request.
References
Bonivento W, et al. Proposal to search for heavy neutral leptons at the SPS. arXiv:http://arxiv.org/abs/1310.1762 (2013).
SHiP Collaboration, Anelli M, et al. A facility to Search for Hidden Particles (SHiP) at the CERN SPS. arXiv:http://arxiv.org/abs/1504.04956 (2015).
SHiP collaboration, Ahdida C, et al. SHiP Experiment|Progress Report. CERN-SPSC-2019-010, 2019.
SHiP Collaboration, Ahdida C, et al. The experimental facility for the Search for Hidden Particles at the CERN SPS. arXiv:http://arxiv.org/abs/1810.06880 (2018).
SHiP collaboration, Ahdida C et al. Fast simulation of muons produced at the SHiP experiment using Generative Adversarial Networks. J Instrument. 2019;14(11):P11028
Salzano A, Miano A, Porfidia G, Fiorillo A, Prota A, Jacobsson R. The BIM-based integrated design of the SHiP project decay volume. In: 6th International Conference on Architecture, Materials and Construction 2020 (ICAMC, 2020), Lisbon; 2020. In publication in IOP Conference Series: Materials Science and Engineering.
Robot: Autodesk Robot Structural Analysis Professional Software, Autodesk, 2019.
EN 1990: Eurocode 0: basis of structural design, European Committee for Standardizations, Brussels, Belgium; 2002.
EN 1998-1: Eurocode 8: design of structures for earthquake resistance—part 1: general rules, seismic actions and rules for buildings, European Committee for Standardizations, Brussels, Belgium; 2004.
EN 1993-1-3: Eurocode 3: design of steel structures—part 1–3: general rules—Supplementary rules for cold-formed members and sheeting, European Committee for Standardizations, Brussels, Belgium; 2006.
Ehlert M, et al. Proof-of-principle measurements with a liquid-scintillator detector using wavelength-shifting optical modules. J Instrument. 2019;14(03):P03021.
Andreini: SHiP Decay Vessel: Structural Design Aspects, EDMS no: 1869201/1, Personal Communication 2018.
SAP2000: Integrated software for structural analysis and design, computers and Structures, Inc, 2019.
EN-13-445: Unfired pressure vessels—part 3: Design, Brussels, Belgium; 2014.
Cui J, Li B, Jiang H, Li G. Numerical and experimental study on high-speed nailing process for aluminum/steel structures induced by electromagnetic impact. Arch Civ Mech Eng. 2020;20:55.
Gronostajski Z, et al. Recent development trends in metal forming. Arch Civ Mech Eng. 2019;19(3):898–941.
Hassan M, Hussain G, Ilyas M, Ali A. Delamination analysis in single-point incremental forming of steel/steel bi-layer sheet metal. Arch Civ Mech Eng. 2020;20(2):1–14.
Na DH, Cho SH, Lee Y. Experimental and numerical studies for the forming groove and separating groove design in slit rolling process. J Mech Sci Technol. 2011;25(9):2439–46.
EN 1090-1: Execution of steel structures and aluminium structures—part 1: requirements for conformity assessment of structural components, European Committee for Standardizations, Brussels, Belgium; 2012.
EN 1090-2: Execution of steel structures and aluminium structures—part 2: technical requirements for steel structures, European Committee for Standardizations, Brussels, Belgium; 2018.
Revit: Autodesk Revit Architecture, Software, Autodesk; 2019.
Navisworks: Autodesk Navisworks, Software, Autodesk; 2019.
Acknowledgements
The authors would like to thank CASTALDO SpA for the valuable inputs on the welding techniques and the assembly procedures. The authors would also like to acknowledge Eng. Domenico Maiello who has contributed to the development of presented work.
Funding
Open access funding provided by Università degli Studi di Napoli Federico II within the CRUI-CARE Agreement..
Author information
Authors and Affiliations
Corresponding author
Ethics declarations
Conflict of interest
The authors declare that they have no conflict of interest.
Additional information
Publisher's Note
Springer Nature remains neutral with regard to jurisdictional claims in published maps and institutional affiliations.
Rights and permissions
Open Access This article is licensed under a Creative Commons Attribution 4.0 International License, which permits use, sharing, adaptation, distribution and reproduction in any medium or format, as long as you give appropriate credit to the original author(s) and the source, provide a link to the Creative Commons licence, and indicate if changes were made. The images or other third party material in this article are included in the article's Creative Commons licence, unless indicated otherwise in a credit line to the material. If material is not included in the article's Creative Commons licence and your intended use is not permitted by statutory regulation or exceeds the permitted use, you will need to obtain permission directly from the copyright holder. To view a copy of this licence, visit http://creativecommons.org/licenses/by/4.0/.
About this article

Cite this article
Miano, A., Fiorillo, A., Salzano, A. et al. The structural design of the decay volume for the Search for Hidden Particles (SHIP) project. Archiv.Civ.Mech.Eng 21, 3 (2021). https://doi.org/10.1007/s43452-020-00152-9
Received:
Revised:
Accepted:
Published:
DOI: https://doi.org/10.1007/s43452-020-00152-9