
Abstract
For more than 20 years, Human Development Index (HDI) is most popular composite measures of well-being. To review economic and social performance across sub-state (i.e. district), most of the states in India have published State Human Development Report. The government has a constant need to estimate levels of well-being across various dimensions to inform resource allocation and to formulate appropriate development programmes. HDI is widely known measure of well-being which synthesizes three dimensions in a linear scale ranging in between 0 and 1. The limitations of such exercise are often overlooked in rush for unidimensional quantitative indicators of well-being. This present paper highlights the methodological drawback of the West Bengal Human Development Report, 2004 and proposes an alternative standard variant of HDI at sub-state (i.e. district) level of West Bengal.
Introduction
Human development is defined as the process of enlarging a person’s ‘functionings and capabilities to function, the range of things that a person could do and be in her life’, expressed in the HDRs as expanding ‘choices’ (Sen 1989). The first Human Development Report launched by Mahbub ul Haq in 1990 had an explicit purpose: ‘to shift the focus of development economics from national income accounting to people centred policies’ (Mahbub ul Haq 1995). It is important to note that the human development approach contains two central theses about people and development—‘evaluative aspect’ and the ‘agency aspect’ (Sen 2002). The first is concerned with evaluating improvements in human lives as an explicit development objective and using human achievements as key indicators of progress. The second is concerned with what human beings can do to achieve such improvements, i.e. people are not simply beneficiaries of economic and social progress in a society, but are active agents of change. The human development approach is commonly associated with the evaluative aspect. The agency aspect is less widely appreciated.
The Initial Human Development Report was based on Sen’ s idea of capability and have used two criteria in deciding which capabilities are most important: first, they must be universally valued by people across the world, and second, they must be basic ‘basic’ (i.e. capabilities on which many choices in life depended), reflected in the three HDI capabilities: to be knowledgeable, to survive and to enjoy a decent standard of living and command over resources, meaning their lack would foreclose many other capabilities. But the human development approach has deliberately remained open-ended in the choice of capabilities, letting them vary over time and place depending upon the context. The relative importance of capabilities may vary depending upon the socio-economic context.
For more than 20 years, HDI is the most popular composite measures of human well-being. Ever since its inception in 1990s, many variants of it have devised (GDI, HPI, GEM and creative one like Happy Planet Index). HDI is a composite index of four indicators. The Human Development Index, or HDI, embodies Amartya Sen’s ‘capabilities’ approach to understanding human well-being, which emphasizes the importance of ends (like a decent standard of living) over means (like income per capita) (Sen 1989). Key capabilities are instrumentalized in HDI by the inclusion of proxies for three important ends of development: access to health, education and goods. Empowered by these, and other, capabilities, individuals can achieve their desired state of being. HDI is a composite index of four indicators. Its components are to reflect three major dimensions of human life: longevity, knowledge and access to resources. These are to represent three of the essential choices ‘for people to lead a long and healthy life, to acquire knowledge and to have access to resources needed for a decent standard of living’ (HDR 1990). The dimension of longevity is directly measured by life expectancy at birth. Knowledge is presented by a measure of educational achievement based on a weighted sum of adult literacy rate (2/3) and the combined primary, secondary and tertiary level gross enrolment ratio (1/3).
HDI is criticized on many grounds, for its arbitrariness in choice of capabilities (Alkire 2002), poor representative indicators (Dasgupta 1993), arbitrariness and unjustifiable formula used to calculate the HDI (Chowdhury 1991), methods of unweighted mean—a method which has been likened to ‘adding apples and oranges’ (Hopkins 1991). Above all, it is a serious limitation to capture the whole complexities of well-being and its inability to measure the well-being at individual level (Desai 1993). HDI is synthetic measures of well-being, and the limitations of this index are sometimes overlooked in this rush for aggregate measures of well-being and social progress. HDI is a composite index, and the aggregation of it has its own cost and benefits (UNDP 1990, 1995, 2000, 2004). The cost and the benefits of such aggregation have to be contextualized in order to judge the real worth of such exercises. In spite of these limitations, HDI has never lost its importance as a comprehensive tool for measuring the well-being for its simplicity and its ability to aggregate and represent the separable facets well-being in a linear scale ranging between 0 and 1. 0 represents the bottom and 1 is the top position (in terms of the concerned indicator), on a linear scale. It tells us where a particular district stands, between the ‘top’ and ‘bottom’ for instance, a value of 0.5 means that the districts has crossed ‘half way towards the desired end’. The desired end set whereby no children should left out of school, all born child should survive, all the households live with decent standard of living.
Human development reports are considered as a major source of social statistics at present. UNDP is encouraging all counties of the world to devise human development reports at national and sub-national level (UNDP 1990, 1995, 2000, 2004). India is one of the pioneer countries to adopt UNDPs proposal, and subsequently all the states and union territories have devised their own at district and sub-district level. State-level human development reports intend to measure the disparities in levels of achievements across sub-states. In India, the sub-states essentially mean districts. Majority of the state human development reports published so far have observed straightforward application of UNDPs methods without or with very minor modification in the representative indicators and methodology. Of all state human development reports that have been published so far in India, first human development report published by Govt. of West Bengal in 2004 is considered somewhat different from others. WBHDR (2004) have given more emphasis on two important determining agency of human development: land reform and decentralization of governance rather than the evaluative aspects. Followed by the success of the first HDR the second is on the way of preparation. This research paper attempts to address: emerging pattern of human development and its disparity across regions and districts? What explains the differential estimates of HDI for West Bengal by various agencies? What are the factors constraining human development in the state at present? What are the serious loopholes in the methodology and finally how to develop a standard human development index for the state?
Unless stated otherwise, all the indicators presented in this paper refer to rural and urban areas combined. For the same reason, the reference period (unless otherwise specified) is 2001, or the closest subsequent year for which the relevant data are available.
The study area
West Bengal is the fourth most populous state with a population of about 82 million in 2001, and with the highest population density of 904 persons per square kilometre (nearly 3 times the national average). High density of population inevitably puts more pressure on basic physical and social infrastructure as well as on the provision of health and education services. The extremely high population density affects per capita resource allocation. About 72% of the people live in rural areas. The percentages of scheduled caste and scheduled tribe populations are 28.6 and 5.8, respectively, in the rural areas and 19.9 and 1.5, respectively, in the urban areas. Muslims accounts accounting for 33.3% of the urban and 11.8% of the rural population. SC, ST, and minority groups together account for more than half the population of the state and are also the poorest groups in rural West Bengal.
Description of the methodology and data
An attempt here is to identify the district-level disparities in well-being in West Bengal with the help of HDI and further to examine the methodological loopholes in the calculation of the HDI. It also attempts to develop a standard variant of HDI to examine the inter-district variations in well-being. At present, West Bengal has 23 districts; however, 18 districts are taken into account and the districts are merged accordingly to bring comparability with the State Human Development Report, 2004.
Data source
This study is based on secondary data obtained from relevant sources as mentioned in the data source of various tables.
Variable used in the study
A number of variables can be used to build sub-indices for well-being. In order to bring consistency, the study has included only those indicators for which we have data available.
Methodology for computation of index
The study aims at computing different sub-indices and computes the overall index of the well-being of different districts in West Bengal. The methodology for preparing the indices is explained as follows:
First, the values of the selected indicators for all the 18 districts of West Bengal have been collected and tabulated. Then, the tabulated data were transformed into standardized values by using Eq. 1.
The standardized value is treated as the Dimension Index (DI) for those dimensions which are composed of single variable (e.g. health is composed of life expectancy at birth for WBHDR 2004) and unweighted aggregation of standardized values is made for those dimensions which are composed of multiple dimensions.
Finally, the HDI or SHDI is developed by unweighted aggregation of three dimensions—Health Index, Education Index and Income Index or Standard of Living Index
Results
Pattern of human development in West Bengal (WBHDR 2004)
West Bengal Human Development Report, 2004, is different from others as it focuses both the evaluative and the agency aspects of human development. A wide range of analysis has been made to establish the role of land reforms, decentralization in enhancement of human development of the state.
The HDI is composed three basic dimensions—health, knowledge and standard of living with some variation in the income index (standard of living). The health takes into account longevity, i.e. life expectancy at birth. Knowledge is expressed as combination of literacy rate and combined gross enrolment ratio. Standard of living is a composite of per capita income, per capita consumption and percentage of population above poverty line. It is calculated as follows:
Human development index (HDI), West Bengal human development report (WBHDR), 2004
-
a.
Dimension and the Representative Indicators
The HDI is composed three basic dimensions—health, knowledge and standard of living and six (6) representative indicators.
-
1.
The health dimension is expressed through longevity, i.e. life expectancy at birth.
-
2.
Knowledge dimension consists of literacy rate with 2/3 weightage and 1/3 weighatge of gross enrolment ratio at school level.
-
3.
The standard of living dimension contains unweighted average of per capita income, per capita consumption and percentage of population living above poverty line.
-
b.
Methodology
Each of these indicators is combined into three dimension indices, namely Health Index, Education Index and Income Index.
-
1.
The Sub-dimension Index (SDI) calculated with the help of the formula below. In the calculation of the dimension indices, the goal post value for each dimension are listed below (Table 1).
Table 1 Goalposts for dimension index in HDI of West Bengal.
-
2.
Dimension Index (DI) is treated as the Dimension Index for the dimension which contains single indicator. In case of a dimension (Education or Standard of Living/Income Index) which contains multiple indicators, the Dimension Index develops by weighted (Education Index) or unweighted average (Standard of Living Index/Income Index) of the sub-dimension index.
-
3.
The goal post that used in the calculation of the dimension index is given below
-
4.
HDI is then calculated as simple unweighted average of three different dimension values by using the formula below. HDI with value varies between 0 and 1.
West Bengal is placed in the groups of states with moderate levels of Human Development (with HDI of 0.61). Human development in West Bengal with moderate inter-district disparities (as reflected by the CV of HDI is more than 10%).
At aggregate level, the human development in West Bengal is not dissatisfactory. The persistence of inequality in human development across socio-religious groups coupled with inter-district disparity makes it very difficult for West Bengal to achieve higher levels of human development. Moderate mean and high variance of HDI in West Bengal is also indicative of high inter-district disparity in the state. The inter-district disparity in human development in West Bengal is very much stricking and is ranging from highest of 0.78 in Kolkata district to lowest of 0.44 in Malda district. The high level of inter-district disparity in human development is also reflected from the value of coefficient of variation for HDI which is more than 16% in West Bengal. The districts in West Bengal spread across four regions (according to NSSO classification of natural regions): Himalayan Region (Kooch Behar, Darjeeling and Jalpaiguri), Eastern Plain Region (Uttar and Dakshin Dinajpur, Malda, Murshidabad, Nadia, Birbhum), Central Plain Region (North 24 Parganas, Kolkata, Howrah, Hoogly, Bardhamman and South 24 Parganas) and Western Plain (Purba and Paschim Mednipur, Purulia and Bankura). In terms of HDI, most of the districts in Eastern plain (all the districts have HDI value lower than the state average of 0.60) and Western plain region (except undivided Mednipur, all other districts have HDI value lower than the state average of 0.60) are accounting low level of Human Development and marked as ‘problem region’ or ‘backward region’. Low level of human development is also observed in the districts of the Himalayan region except Darjeeling. The districts of the central plain exhibit relatively uniform level of HDI except South 24 Parganas, and all districts have high level of human development than state average. Therefore, the clear-cut regional patterns emerge; low-HDI districts are heavily concentrated in the Eastern Plain, Himalayan Region, and Western Plain Region. The central Plain Region is virtually free of low-HDI districts.
Another interesting feature of Human development in West Bengal is that highest HDI is observed in greater Kolkata region and the surrounding districts of it. It decreases outward from this region. The districts with low level of human development contain more than 60% of total population of the state and observe heavy concentration of SC/ST and minority population (Western and Himalayan Region contains Tribal and the Eastern Region is with substantial Muslim population). Lower achievements of these socio-religious groups have also noted in the Human Development Report of West Bengal. The deprivation in social well-being of these segments of population is one of the major reasons behind high inter-district disparity in human development of West Bengal (C.V is 16.60). When the inter-district disparity is viewed across the component dimensions, highest spatial variation is observed in education (C.V of 30.52) and lowest in income index (C.V of 14.26) (Table 2).
There are four particular sub-regions in West Bengal which face particular problems of development and constraints on improving the conditions of well-being.
-
a.
The Paschimanchal region in the west of the state spans the all the blocks of Purulia, and some blocks of Bankura, Medinipur. These blocks are relatively isolated, with poor transport infrastructure and therefore tend to be backward and overwhelmingly tribal population.
-
b.
Himalayan Region—Kooch Behar and Jalpai guri face the infrastructural and connectivity problem.
-
c.
Eastren Plain Region—Malda, Murshidabad, North and South Dinajpur, Birbhum contains substantial Muslim population with very low level of Human Development.
-
d.
Finally, the Sunderbans area in the southernmost part of the state, mostly in South 24 Parganas and some blocks of North 24 Parganas, a special region with an exceptionally fragile environment of mangrove forests and estuaries (Figs. 1, 2, 3 and 4).
Fig. 1 
Inter-district variation in health index in West Bengal
Fig. 2 
Inter-district variation in income index in West Bengal
Fig. 3 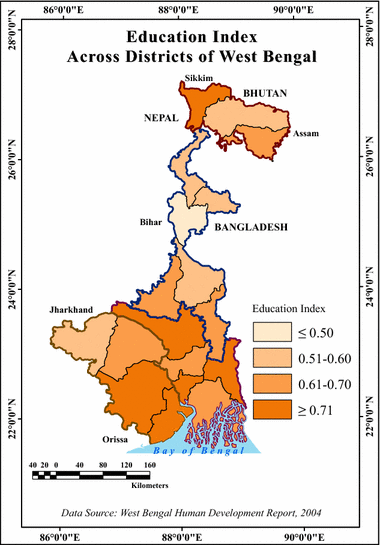
Inter-district variation in education index in West Bengal
Fig. 4 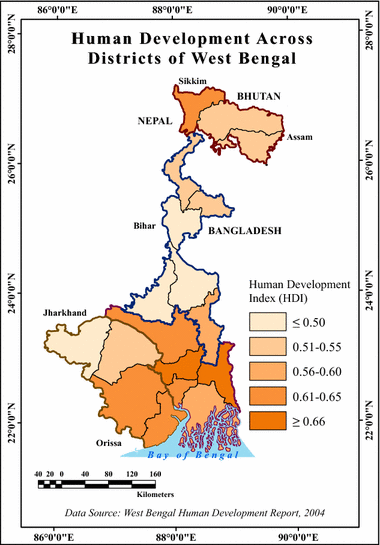
Inter-district variation in human development index in West Bengal


Critical appraisal of human development in West Bengal
West Bengal is the pioneer state in India in decentralization of governance and community mobilization for better utilization of resources. In the state HDR, entitled ‘West Bengal Human Development Report, 2004’, the role of decentralization and community mobilization is regarded as the major drivers of human development in West Bengal but have failed to explain its weak linkages various other crucial aspects of social well-being. The levels of social consumption other than education and health services (like drinking water, electricity, sanitation) and its distribution play a vital role in Human Development. Low consumption of the social goods and the lack in other parameters of standard of living has very strong negative bearings on levels human development. Low social consumption emanates from the lack in provision by the government. Closer look at the various dimensions of social consumption and standard of living parameters exhibits a strong contrasting feature with the HDI in West Bengal. Overall low household quality of living and its various dimensions in West Bengal that supports human development represents one of the visible forms of clear-cut mismatch. It is important to take a note that in spite of successful land reform near about 60% the rural households are landless compared to 65% at the national level; 51.52% of the rural households do not have access to electricity compared to 30% of national average; 56.34% of the rural households have not toilet facility compared to 49.30% at the national level and more than 40% of the rural household lives in kaccha houses compared to 35.50% of national average (Table 3).
Differential estimates of human development in West Bengal
Adoption of different methodologies brings out different levels of human development for West Bengal and its various dimension index. For instances, as per the estimates of WBHDR, 2004, it is 0.6, following the UNDP (1994) methodology HDI of West Bengal comes out to be 0.50, the standard Human development methodology estimates HDI of West Bengal is 0.37 and India HDR, 2011 estimates the figure of HDI in West Bengal is 0.492 in 2007–2008 and as per WBHDR, 2004 it is 0.61. Therefore, it is clear that different agencies give different estimates of HDI for West Bengal. For instance, as per the WBHDR, 2004 estimates, West Bengal has crossed more than 60% of its journey towards the desired given end while according to India HDR, 2011 it has crossed only 49% of its path. This kind of anonymities in the estimation HDI creates the problems of comparability and also may be responsible for misdirection in the policy implementation. Thus, HDI instead of emerging as powerful policy tools becomes a mere nothing but a statistical exercise. It is noteworthy that while doing the exercise of compositing HDI one of the prime intentions was the comparability over space and time. To fulfil this objective the indicators are normalized and compressed into single index in the form of HDI. Differential methodologies adopted in the construction of HDI make it incomplete, inconsistent and incomparable (Table 4).
Conceptual and methodological loopholes
HDI is composite index and contains no more information than the constituent indicators of it. Variations in the estimated HDI of West Bengal are primarily an outcome of two factors;
-
1.
Variations in the choice of indicators
-
2.
Variations in the process of normalization
Variations in the choice of indicators
First look at the large-scale differences in the choice of indicators for the construction of HDI for West Bengal by different agencies. Major deviations have been observed in the choice of indicators for the standard of living and followed by education among the various agencies. One needs to adopt nuanced perspective while choosing the indicators for constructing HDI at district level. Most serious problems arise out of measures of standard of living. The adoption of district per capita income, inequality-adjusted per capita real consumption expenditure, proportion of population above poverty line for as proxy variables for the command over resources and standard of living are lack in rationale and contextual specification for its incorporation. At the country level or at state level, the incorporation of those variables can be justified on the ground of data limitation. The logic of incorporation of these indicators at the state level cannot be justified on the same ground at the district level. Production of cardinal ranking of districts based on aggregation three cardinal numbers for 16 or 17 districts is not the objective of exercising the HDI at the district level rather changes in the landholding structure, access to credit and access to public goods are much better representative of the command over resources. The data limitations some time forced us to depend on inadequate indicators. It is, therefore, while constructing HDI district level one really need to check whether secondary information is available on these indicators or not. If available, then incorporation of these indicators is essential instead of average per capita consumption or per capita district domestic product as representative of the command over resources and standard of living (Table 5).
Variations in the process of normalization
In the construction of the HDI for West Bengal, different agencies have adopted different methods of normalization. The computation of dimension index is uniform for all agencies:
where Xi is the normalized indicator for district i, Xi is the corresponding pre-normalization figure, and Xmax and Xmin are the maximum and minimum values of the same indicator across all districts.
Although the method of construction of dimension index remained same, differences have been observed in the choice of goalposts (used as the maximum and minimum values for various dimension index). For instances, in WBHDR, 2004, it combined the UNDP goalpost-based approach, and for some indicators, it has used the best- and the worst-performing districts of India in that indicators during the process of normalization. While doing this, the idea behind it may be to locate the districts of West Bengal in Indian ladder, but this has a serious limitation. Since, the best-performing district is not far ahead from the best-performing districts of West Bengal, but the worst-performing districts in West Bengal is far better than the worst-performing districts of India and that leads to lowering the inter-district disparity which is in fact much higher. This largely affects the dimension index for each parameter and measured HDI for West Bengal as well as for the districts. In India HDR 2011, minimum (maximum) values for indicators are derived by scaling down (up) the observed minimum (maximum) by 25%. This is done so as to avoid a value of zero or one for the state having the observed maximum and minimum values, respectively (Tables 6, 7, 8 and 9).
In short, due to inconsistency in the methods of normalization, all the indices of HDI are incomparable. In below, the ambiguity in the methods of normalization of various agencies is represented.
For example, consider the Life Expectancy at birth for Malda is 65 for 2001. Comparing the WBHDR and India HDR, 2011, methodology, it is clear that the changes in the goal post bring differential levels of dimension value for health Index.
Health Index for Nadia as per WBHDR is
Health Index for Nadia as per India HDR 2011
Need for a standard variant of human development index
The limitations of the various measures of HDI for West Bengal observed in multiple of facets ranging from choice of indicators to methods of normalization and aggregation. It is therefore necessary to put forward a standard variant of HDI at the district level to get a real picture of Human Development and for effective implementation of public policies.
Normative framework
HDI tells us where a particular district stands and the relative position of the districts with respect to the worst districts and the desired end (i.e. HDI of 1). It is very meaningful from the perspective of planning because it enables us in relative ordering of the district based on its progress or lagging towards the desired ends and to specify the priority in the allocation of resources in specific dimensions. Now the question may arise regarding ‘what is that desired end’ it attempts to reach. Standard Human Development Methods has set a simple normative framework for the desired end whereby all born children will alive till age five, all female will be literate and all households live above the low standard of living. The normative framework provides very useful tools for evaluating the efficiency of public policy and its variations across districts.
Human Development visualized by the normative framework through the Standard Human Development Index which encompasses two domain of well-being–standard of living and Quality of Life. With the capability approach, while the education and life expectancy indicators refer to ‘functionings’, the income per capita component seems to be a ‘commodity’. As the human development concept has emerged from the GDP limitations, it seems inappropriate to include an income component in an index of well-being.
Well-being is not determined by possession of resources but by their transformation into ‘functionings’ which depends on personal, social and environmental factors. GDP per capita is necessary but not sufficient for human development as shown by countries where high and growing GDP per capita has not led to enrichment of human lives (Sen 1989). The income component affects the purity of the HDI as a capability-based measure. First, the level of GDP per capita is a poor indicator of the means of a group of people, and its usefulness for the expansion of social services and infrastructure development is not clear (Sen and Anand 2000; Sen 1985, 1989). Means indicators that are determinants of well-being and part of the standard of living index are needed. Second, GDP per capita is a bad proxy of freedoms and quality of life. It includes several means indicators that correspond to ‘commodities’ that could be called inputs such as access to improved source of water, sanitation facilities, electricity facilities, clean fuel for cooking, and households assets. QL includes (unlike SL) more intangible or qualitative aspects such as quality of education, extent of child labour and quality of the environment. It is a combination of ‘functionings’ and/or ‘capabilities’ indicators within the meaning of freedoms.
Standard of living index
Considering household amenities, such as source of drinking water, type of house, source of lighting, fuel for cooking, toilet facility and ownership of durable goods, a composite measure, standard of living index (SLI), is developed.
Quality of life index
It is composite of two-dimensional index—health and education. Health index constructed by considering the children survival probability up to age five and the education index by considering female literacy rate. Child survival probability accounts for health conditions of the society under which birth occurred and maternal nourishment during pregnancy. Female literacy rate has been widely accepted in the recent development literature as an important proxy indicator of social development as it seeks to capture the degree of gender discrimination in rural societies in various dimensions of social development.
Standard human development index (SHDI)
Standard Human Development Index for West Bengal is composed of three dimensions and eight indicators. HDI is simple unweighted average of three-dimensional index—health index (represented via child survival probability), education index (female literacy rate as the indicators) and standard of living index (composite of six dimensions of material well-being
a. Dimension and the Representative Indicators
-
1.
The health dimension is expressed through child survival probability.
-
2.
Knowledge dimension is consisting of female literacy rate.
-
3.
The standard of living dimension is composite of household-specific amenities and developed by applying the DLHS-2 methods.
Standard of Living Index (SLI) has developed by adding up the scores of diversified household aspects listed below (Table 10).
The total scores of a household may vary from the lowest of a 0 to maximum of 40. On the basis of total score, households are divided into three different categories of standard of living as;
-
a.
Low Standard of Living—if total score is less than or equal to 9
-
b.
Medium Standard of Living—if total score is greater than 9 but less than or equal to 19
-
c.
High Standard of Living—if total score is greater than 19
-
b.
Dimension Index for SHDI
The Dimension Index is calculated as follows:
where Xi is the normalized indicator for district i, Xi is the corresponding pre-normalization figure, and Xmax and Xmin are the maximum and minimum values of the same indicator across all districts. The normalized indicator takes value 0 for the ‘bottom’ district, 1 for the ‘top’ district and varies between 0 and 1 for other districts. It tells us where a particular district stands, between the ‘top’ and ‘bottom’ districts (in terms of the concerned indicator), on a linear scale. For instance, a value of 0.5 means that the district is ‘half way’ between the top and bottom districts.
Dimension Index (DI) for the standard variant of human development index is same as Sub-Dimension Index (SDI) for those dimensions which contain single indicator and Dimension Index which contains multiple indicators developed by unweighted average of normalized indicators.
-
c.
Calculation of SDHI
SHDI is then calculated as simple unweighted average of three different dimension values by using the formula below. SHDI with value varies between 0 and 1.
Pattern of human development according to standard human development index
Level of Human Development in West Bengal is considerably lower when it is viewed with the help of standard human development index as opposed to the HDI constructed by the West Bengal Human Development Report (2004). According to standard human development index, West Bengal is placed in the groups of states with low level of (with HDI of 0.44). Human development in West Bengal exhibits very high inter-districts disparity (CV of HDI is 47.59%). Human Development in West Bengal tends to follow the broader pattern of WBHDR with most of the districts belong to Eastern and Western plain region have shown very low level of human development and emerge as the ‘problem region’. Human Development lower than the state average is also observed in the districts of the Himalayan region with exception of Kooch Behar which has HDI higher than the state average. All other districts of the central plain have higher and relatively uniform level of HDI with an interesting feature of comparatively low levels of HDI for Kolkata. One possible reason is that the large number of slum population are devoid of provision of social goods and is reflected in the HDI. High Human Development districts are highly concentric around Kolkata with comparatively low level of HDI for Kolkata itself (Figs. 5, 6, 7 and 8 and Table 11).

Inter-district variation in standard of living index in West Bengal

Inter-district variation in education index in West Bengal

Inter-district variation in health index in West Bengal

Inter-district variation in standard human development index in West Bengal
Levels of over-/under-estimation of HDI in West Bengal
Table 13 shows that the ranking of districts by level of HDI has remained almost the same for each method despite the huge difference in value of HDI. In fact, the rank correlation between the ranking of districts by HDI in all methods is extremely high (0.97). The top five ranks in both the years go to the better performing states of districts are (Table 12):
It has already been noted that different agencies have adopted differential techniques in estimating HDI of West Bengal, and it results in wide-spread deviation in the achieved HDI of West Bengal over the same period of time. The levels and magnitude of over- and under-estimation considering the standard human development index and its variation across districts are essential to get a correct picture of the human development and its variation across districts.
where Xi is the normalized indicator for district i in other methods, X* is the corresponding normalized figure for standard HDI. The normalized indicator takes value from − 1 to + 1. Negative signs represent under-estimation by the other methods and positive signs indicate over-estimation. 0 represents no over-estimation and + 1 (− 1) represents absolute over- (under-estimation).
The index value revels that WNHDR methods have considerable over-estimation of the HDI compared to UNDP, 1994 methods. It is also interesting to note that the in the WBHDR methods the good performing districts in terms of Human Development are under-estimated to a considerable extent and the worse-performing districts are over-estimated. The tendency is more or less same for the UNDP methods but with lesser magnitude. That clearly indicates the statistical manipulation leads to decrease in the inter-district disparity in HDI which is originally considered to be very high (Table 13).
Discussion
It is imperative in the light of the discussion that has made so far, it is clear Human Development has to be placed in a much more complex and nuanced rather than simplistic framework at district level. The districts of Eastern, Western Plan and Himalayan region emerge as the backward or problem region whether viewed it in the lens of human development or any other measures of social well-being. Cooch Behar and Jalpaiguri district in the Himalayan region; Uttar Dinajpur, Malda, Murshidabad and Birbhum in the Eastern plain; South 24 Parganas in the Central plain; Puruliya and Paschim Mednipur in the Western plain are such districts and has emerged as the problem regions. It is important to note that these districts by their very demographic character contain relatively higher concentration of vulnerable population particularly of Muslims. These socio-economically backward segments of population in most of the cases share in total population rangers in between 70 and 90%. Therefore, the backwardness of these districts is indicative of deeper pattern of deprivation in social well-being. Malda and Uttar Dinajpur are two districts which are lagging behind all the parameters.
However, the ‘distance theory’ (more distant the district is from Kolkata lower is social well-being) is not strictly valid. In most the composite measures of social well-being, the performance of Kolkata is followed by the districts of North 24 Parganas (but not South 24 Parganas), Howrah (but not Hooghly) and Medinipur (but not Nadia). Further, the striking feature of the development is the wide gap between Kolkata and the below-average districts such as Dinajpur (North and South), Maida, Purulia and Birbhum so far as the so is concerned social well-being.
The contrasting and inconsistent picture of human development in West Bengal, as represented with the HDI constructed by several agencies is a result of differential methodologies adopted in the construction of it. It is important to note that HDI is a composite index and composite index are nothing but a mere composition of diversified dimensions of social well-being (or its deprivation) that it attempted to capture. The composite index contains no more information than its constituent indicators. The advantage of composite index lies on the fact that it is able to bring the diversified dimension in a synthetic frame which makes the interpretation very easier. West has already published the first human development report and the second is on the verge of completion. It is this regard it is important to note that the need for development of HDI at the sub-district level is mainly driven by the interest of the government to look at the aggregate level of development and its disparity within the state to inform resource allocation decisions and formulate appropriated development policy. The lack of contextualization of the concept of human development and over-dependence on aggregation of some specified indicators brings erroneous estimates which often misdirect the resource allocation decision. West Bengal for instance, the wide gap between the HDI estimated in the WBHDR and as per the estimates of standard HDI is wide difference which emerges out primarily due to the choice of indicators. The most serious problem perhaps arises because of the ‘per capita district income’ as an indicator of ‘command over resources’. Inclusion of this in the HDI of districts is nothing but a straightforward application of per capita GDP in the country context. Ideally, household amenities, such as type of houses, drinking water, availability of toilet facility and assets holding status of the households, is more representative of the command over resources to maintain a descent standard of living. It is, therefore, incorporation of the indicators of household amenities and assets, instead of per capita district income or headcount ratio, can be more illuminating for command over resources. District level data is also available from published sources (e.g. district level household survey) but the government report still roams around the traditional way of representing HDI as a set of commonly known indicators and often not reprehensive of the reality. It often leads to leakages in expenditure in so-called social sector planning India and its constituent states.
References
Alkire S (2002) Dimensions of human development. World Dev 30(2):181–205
Chowdhury OH (1991) Human development index: a critique. Bangladesh Dev Stud 19(3):125–127
Dasgupta P (1993) An inquiry into well-being and destitution. Clarendon Press, Oxford
Desai M (1993) Income and alternative measures of well-being. In: Westendorff DG, Ghau D (eds) Monitoring social progress in the 1990s. Avebury, Aldershot
Hopkins Michael (1991) Human development revisited: a new UNDP report. World Dev 19(10):1469–1473
Mahbub ul Haq (1995) Reflections on human development. Oxford University Press, New York
Sen A (1985) Commodities and capabilities. North Holland, Amsterdam
Sen A (1989) Development as capabilities expansion. J Dev Plan 19:41–58
Sen A, Anand S (2000) The income component of the human development index. J Hum Dev 1(1):83–106
Sen A (2002) "Foreword". In: Fukuda-Parr S, Shiva Kumar AK (eds) Human development, essential readings. Oxford University Press, New Delhi
United Nations Development Programme (1990) Human development report 1990. Oxford University Press, New York
United Nations Development Programme (1994) Human development report 1994. Oxford University Press, New York
United Nations Development Programme (1995) Human development report 1995. Oxford University Press, New York
United Nations Development Programme (2000) Human development report 2000. Oxford University Press, New York
United Nations Development Programme (2004) Human development report 2004. Oxford University Press, New York
Author information
Authors and Affiliations
Corresponding author
Rights and permissions
About this article

Cite this article
Das, A. Re-examining human development in West Bengal, India. J. Soc. Econ. Dev. 19, 341–364 (2017). https://doi.org/10.1007/s40847-018-0054-6
Published:
Issue Date:
DOI: https://doi.org/10.1007/s40847-018-0054-6