
Abstract
Introduction
Identifying and addressing neurodevelopmental delays in children can be challenging for families and the healthcare system. Delays in accessing services and early interventions are common. The design and delivery of these services, and associated outcomes for children, may be improved if service provision aligns with families’ needs and preferences for receiving care. The aim of this study is to identify families’ preferences for neurodevelopmental follow-up care for children using an established methodology.
Methods
We used a discrete choice experiment (DCE) to elicit families’ preferences. We collected data from families and caregivers of children with neurodevelopmental needs. The DCE process included four stages. In stage 1, we identified attributes and levels to be included in the DCE using literature review, interviews, and expert advice. The finalised attributes were location, mode of follow-up, out-of-pocket cost per visit, mental health counselling for parents, receiving educational information, managing appointments, and waiting time. In stage 2, we generated choice tasks that contained two alternatives and a ‘neither’ option for respondents to choose from, using a Bayesian d-efficient design. These choice tasks were compiled in a survey that also included demographic questions. We conducted pre- and pilot tests to ensure the functionality of the survey and obtain priors. In stage 3, the DCE survey was administered online. We received 301 responses. In stage 4, the analysis was conducted using a latent class model. Additionally, we estimated the relative importance of attributes and performed a scenario analysis.
Results
Two latent classes were observed. More families with full-time employees, higher incomes, postgraduate degrees, and those living in metropolitan areas were in class 1 compared with class 2. Class 1 families preferred accessing local public health clinics, face-to-face follow-up, paying AUD100 to AUD500, mental health support, group educational activities, health service-initiated appointments, and waiting < 3 months. Class 2 families disliked city hospitals when compared with private, preferred paying AUD100 or no cost, and had similar preferences regarding mental health support and wait times as class 1. However, no significant differences were noted in follow-up modality, receiving educational information, and appointment management. The relative importance estimation suggested that location was most important for class 1 (28%), whereas for class 2, cost accounted for nearly half of the importance when selecting an alternative. The expected uptake of follow-up care, estimated under three different hypothetical scenarios, may increase by approximately 24% for class 2 if an ‘ideal’ scenario taking into account preferences was implemented.
Conclusion
This study offers insights into aspects that may be prioritised by health services and policymakers to improve the design and delivery of neurodevelopmental follow-up care for children. The findings may enhance the organisation and functioning of existing care programmes; and therefore, improve the long-term outcomes of children with neurodevelopmental needs and their families.
Family preferences and barriers may impact broader health service design of neurodevelopmental follow-up care for children; however, there is a gap in eliciting families’ preference, particularly regarding health service design and delivery perspective. | |
A latent class analysis revealed two classes, with a higher proportion of families with full-time employees, a higher income, and metropolitan residents belonging to class 1 compared with class 2. Most of the decision making in class 1 was driven by the location of follow-up care services, while that in class 2 was influenced by cost of services. | |
A scenario analysis noted about 24% increase in the uptake of follow-up care when families’ ‘ideal’ preferences were considered. |
1 Introduction
Neurodevelopmental disorders are a leading cause of morbidity impacting children and their families as well as healthcare and education systems [1]. These consist of a group of disorders, including diagnoses of intellectual disorders (ID), communication disorders, autism spectrum disorder (ASD), attention-deficit/hyperactivity disorder (ADHD), learning disorders (LD), motor disorders, and tic disorders [2]. In existing literature, few studies have measured the prevalence of neurodevelopmental disorders. While there are estimates for some individual diagnoses, collective prevalence estimates are lacking. A national survey in the United States estimated the weighted prevalence of ADHD, ASD, ID, and LD to be 8.5%, 2.9%, 1.4%, and 6.4%, respectively, in 2019–2020 [3]. These estimates are comparable to reports from other high-income countries; for example, the Australian Institute of Health and Welfare reported the prevalence of ADHD in Australian children to be 8.2% [4].
In this manuscript, ‘neurodevelopmental follow-up care’ refers to the care provided to children at risk of or diagnosed with neurodevelopmental disorder or delay and their families, to monitor the developmental outcomes and provide suitable support and services [5, 6]. Effective follow-up care programmes are likely to require sustained engagement with healthcare services. To promote sustained engagement with services, follow-up care programmes ought to be designed considering the preferences and needs of families.
Despite the importance of including family preferences in the design and delivery of neurodevelopmental care programmes, this topic has received little attention in research to date. Previous neurodevelopment care-related studies have primarily focussed on diagnosis-specific issues without consideration of how family preferences and challenges may impact broader health service design [7,8,9,10]. For example, waiting time has frequently been reported as a major barrier to accessing developmental services for children [11,12,13]. Another important healthcare-service-related factor for families is the cost associated with neurodevelopmental assessments, therapies, medications, as well as travelling or accommodation for accessing services [11, 14]. A lack of educational resources [11, 15] and mental health support for parents [16] have also been noted. These known factors are likely to be priority considerations for families of children with neurodevelopmental needs, with implication for the design and improvement of health services.
Preferences can be identified using several methods. Previous studies in this clinical area have elicited preferences using interviews, focus groups, and surveys [17,18,19,20]; however, quantifying weighted preference of attributes (features) cannot be captured using these methods. Additionally, the design and analysis associated with these methods may not be robust enough to disentangle preferences for the purpose of health service design. Discrete choice experiments (DCE) are an increasingly used preference method that can quantify people’s preferences where individuals are presented with several hypothetical health scenarios (choice tasks), each containing several alternatives (options) with different attributes for the individuals to choose from [21]. A recent systematic review by our research team indicated that DCE is a suitable method for studies related to neurodevelopmental follow-up care [22]. However, limitations were noted in the methodology of the studies included in the review, such as not providing reasons for forced choices, not conducting pilot tests, and using numerous attributes or choice sets, which made it cognitively burdensome for respondents.
Given the methodological limitations and the lack of eliciting preferences in this field, particularly from the perspective of health service design and delivery, this study aimed to identify families’ preferences for neurodevelopmental follow-up care for children in Australia using a DCE.
2 Methods
This study was approved by the Human Research Ethics Committee, Queensland University of Technology (approval number: 6468). Written consent was obtained from all the participants. The DCE design and analysis were reported based on the checklist and reports of the International Society for Pharmacoeconomics and Outcomes Research (ISPOR) Conjoint Analysis Task Forces (Table 1 of Online Resource 1, see electronic supplementary material [ESM]) [23,24,25]. Recent guidance published by the International Academy of Health Preference Research (IAHPR) was also used to ensure that the methodological approaches aligned with current best practices in health preference research [26, 27].
A DCE has several stages that makes it a robust technique for eliciting preferences. These stages broadly include attribute identification and selection, experimental design strategy, final survey administration, and econometric model and data analysis [28,29,30,31]. Several components within these stages were specifically adopted for our DCE, and this process is outlined in the flowchart in Fig. 1.
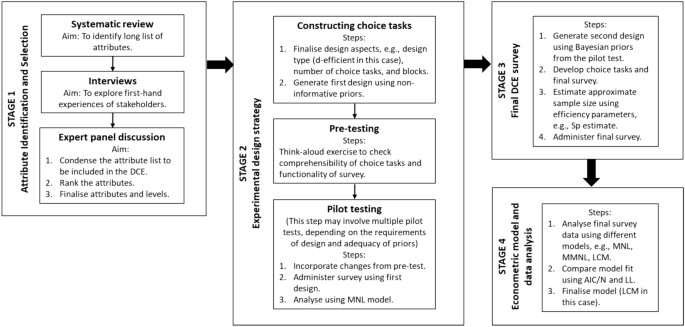
Flowchart of discrete choice experiment study process. MNL multinomial logit, MMNL mixed multinomial logit, LCM latent class model, AIC/N Akaike information criterion/number of observations, LL Log likelihood function
2.1 Stage 1: Attribute Identification and Selection
It is typically recommended to conduct qualitative groundwork to support the identification and selection of attributes [23, 32, 33]. We conducted a systematic review and in-depth interviews to explore a broad range of attributes, followed by expert panel discussions to narrow down the attribute list for inclusion in the DCE. These are explained in detail below.
2.1.1 Systematic Review
We undertook a systematic review to identify a list of attributes. We systematically searched PubMed, Embase, CINAHL, Scopus, and Google Advance databases. After the title and abstract (n = 6618 papers) and full-text (n = 16 papers) screening, we obtained a comprehensive list of attributes (n = 102 attributes, Table 2 of Online Resource 1, see ESM) from international literature. This review is published elsewhere [22].
2.1.2 Interviews
We interviewed families of children with neurodevelopmental delays to obtain their first-hand experiences regarding follow-up care. Due to the sensitive nature of the condition, recruiting a large number of participants was challenging [34, 35]. Moreover, we faced challenges due to attempted imposter participation after recruiting via open postings on social media platforms associated with a neurodevelopment organisation [36]. This initially caused disruption and delays in the study, and we chose not to use any data collected from the attempted imposter participants. We promptly implemented strategies to prevent such occurrences in subsequent recruitment with a stricter screening process and recruitment via a closed social media page affiliated with the same organisation. In doing so, we were able to recruit two participants for in-depth interviews that provided valuable insights into the topic. Given time and resource limitations we were not able to recruit additional participants. Content analysis of the interview transcripts by PS (and confirmed by BA) identified 14 attributes/themes which aligned with the attributes identified in our systematic review (Table 3, Online Resource 1, see ESM).
2.1.3 Expert Panel
Limitations, including the cognitive burden on respondents and sample size constraints, prevented the inclusion of all identified possible attributes via the preliminary qualitative work [37]. Typically, five to seven attributes are ideal for a DCE [38, 39]. Consequently, before the expert panel discussion, a team of health economists and a qualitative research expert on neurodevelopment-related care (SK, BA and PS) reviewed the attributes identified from the review and interviews to prioritise their inclusion based on their relevance to the research question and contextual importance in Australia. Irrelevant attributes were excluded, and similar attributes were combined, reducing the list to 11 attributes. (Table 4, Online Resource 1, ESM).
This was followed by expert panel discussions to further narrow the attribute list. The expert panel (n = 5) included health economists and qualitative research experts with extensive experience in conducting interviews with a similar cohort, that is, families of children needing neurodevelopment-related care. This exercise was conducted individually with each expert. The 11 attributes were presented to the experts, who discussed and ranked the attributes in the order of their importance, relevance to neurodevelopmental follow-up care for children, and suitability to our research question. Then, all experts gathered to finalise the attributes to be included in the DCE, aiming to reach a consensus via unanimity, ensuring no objections persisted. At this point, seven attributes were finalised. This exercise also included defining the levels of attributes. The final list of attributes and levels and their descriptions are provided in Table 1.
2.2 Stage 2: Experimental Design Strategy
This stage includes the construction of choice tasks using a suitable experimental design. A choice task includes hypothetical scenarios, each containing a certain number of alternatives [21]. Those alternatives will comprise the finalised attributes and levels from Stage 1, allowing individuals to choose from them. This is followed by pre-testing and pilot testing of the design to check the functionality of the survey and to obtain suitable priors for the final DCE, respectively.
2.2.1 Constructing Choice Tasks
We included two unlabelled alternatives (Follow-up care A and Follow-up care B) and a ‘neither’ alternative. In this case, neither indicates that respondents do not prefer any of the provided options (A and B), but it does not necessarily mean that they do not prefer follow-up care at all. We employed a dual response approach where respondents were first given three options, ‘A’, ‘B’ and ‘neither’ (unconditional response). If they selected ‘neither,’ they were presented with a forced choice between ‘A’ and ‘B’ (conditional response). The inclusion of a ‘neither’ option was to make the choice tasks more realistic, as in the real world, there may be many scenarios where people do not prefer any available choices. To prevent bias due to the placement order of the alternatives, the position of the ‘neither’ alternative in the choice task was varied randomly.
The below formulae were used to estimate the total number of profiles and pairwise choice tasks, respectively:
Where P is the possible number of profiles and M1, M2, M3 are the number of attributes corresponding to the number of levels (L1, L2, L3) for different attributes [40]. Given three attributes with three levels (L1 = 3, M1 = 3), two attributes with two levels (L2 = 2, M2 = 2), and two attributes with five levels (L3 = 5, M3 = 2), this would result in 2700 (33 × 22 × 52) possible profiles and 3,643,650 combinations of pairwise choice tasks [2700 (2700 – 1)/2]. A full factorial design (a design encompassing all possible combinations of attribute levels) was not possible, so we used a fractional factorial design (a subset of the full design). A d-efficient design was generated using NGENE software [41].
To estimate the minimum number of choice tasks required for our design, we used the formula:
Where Smin is the minimum number of choice tasks, K is the total number of parameters to estimate, and A is the number of alternatives [40]. According to this, our minimum requirement was eight choice tasks. Usually, this estimate is multiplied by two or three to ensure an adequate sample size for the study. We tested different numbers of choice tasks including 20, 30, 40, 50, and 60 and compared the normalised d-error of each design (Fig. 1 of Online Resource 2, see ESM). Even though the normalised d-error reduced with the increase in number of choice tasks, the design with 30 choice tasks was selected considering it had near-best balance. A design achieves balance when each level of an attribute occurs an equal number of times [23]. While there is limited existing literature on determining the number of choice tasks per person, eight to 16 tasks are usually considered suitable [23]. For large designs, it is recommended to use ‘blocks’, which divides the main design into groups to ease the cognitive burden on participants [42]. Therefore, the 30 choice tasks were divided into three blocks of ten. In the absence of prior information on the coefficients of different attributes, small positive or negative priors (non-informative priors) were used. The design codes are provided in Fig. 2 of Online Resource 2 (see ESM). An example choice task is given in Fig. 2.

Example of choice set
2.2.2 Pre-Testing
We conducted two think-aloud exercises with ten randomly selected choice tasks from the design [43]. Participants of the two think-aloud exercises were parents from the general population (n = 10 and n = 8, respectively). The participants were presented with one choice task at a time and asked to verbalise their thought process in selecting an option from ‘A’, ‘B’, or ‘neither’. They were also requested to indicate if they had problems understanding specific attributes or levels. Their feedback was used to refine the comprehension of choice tasks, including restructuring wording for specific attributes, clarifying the meaning of some levels, providing examples alongside levels for better understanding, and improving the hypothetical scenario provided. Participants also noted that the choice tasks were easy to understand, with seven attributes not overwhelming and ten choice tasks not overly burdensome. After addressing these adjustments, we proceeded with the first pilot test.
2.2.3 Pilot-Testing
The survey was administered to families of children aged below five years, not specifically targeting those with neurodevelopmental disorders. This broader approach was considered to engage a larger audience and obtain a comprehensive perspective. We used PureProfile, an online survey panel, to administer our survey. The survey had four parts: eligibility questions, ten DCE choice tasks, demographic details, and questions related to the comprehensibility of the survey. In addition to these ten choice tasks per participant, a repeated choice task was also included to assess the internal reliability and consistency of responses, creating 11 DCE choice tasks presented to each participant. We received 53 responses. After analysing the data using multinomial logit (MNL) model, using NLOGIT software [44] (analysis codes are provided in Fig. 3 of Online Resource 2, see ESM), we found that the cost attribute was dominant as its parameter estimate was higher than the rest of the attributes by a large margin. However, about 26% of the respondents, identified through demographic questions, were families or caregivers of children with neurodevelopmental disorders. In this subgroup, cost was not a dominant attribute. Because of this divergent finding, we decided to focus on this population and conducted another pilot study.
For the second pilot, we used the same experimental design as the first pilot and recruited families of children aged under five years with neurodevelopmental delays via PureProfile. The survey was administered, and we received 48 responses. After analysing the data using the MNL model, we found no issues regarding the dominance of any attributes. We used the parameter estimates obtained from this pilot as priors in the main DCE.
2.3 Stage 3: Final DCE Survey
For the final survey, choice sets were generated again in NGENE using priors obtained from the second pilot. We used a Bayesian d-efficient design optimised using a swapped algorithm with two Gauss draws. We compared this design to the second pilot survey design using the ‘eval’ function in NGENE (second pilot d-error = 0.43), and the efficiency of the Bayesian design was improved by 9% (Bayesian d-error = 0.39). The codes are provided in Fig. 4 of Online Resource 2 (see ESM). Bayesian efficient designs are known to enhance the reliability of parameter estimates and reduce sample size requirements [45]. After a design was produced, the survey was administered. The eligible survey participants were families or caregivers of children < 5 years of age with neurodevelopmental needs. They were recruited via PureProfile. Full DCE survey, participant information sheet, and more information about PureProfile is provided in Online Resource 3 in the ESM.
We used S-estimates to determine our sample size. The S-estimate is the minimum sample size required for a parameter, with Sb mean estimates incorporating the full range of Bayesian priors for a comprehensive interpretation [46]. In our study, Sb mean estimates indicated a minimum sample size of 11,772, which was impractical. Therefore, we opted for the next largest Sb mean estimate of 105. With a three-block design, our target sample size was approximately 315 participants. We ultimately collected 301 responses from the final DCE survey. More details and explanations on the design, priors, and sample size can be found in Online Resource 4 (see ESM).
2.4 Stage 4: Econometric Model and Data Analysis
A panel mixed multinomial logit (MMNL) model was used to identify the overall preferences at a population level; however, this output was presented in the supplementary information and not in the main analysis (Table 5, Online Resource 1, ESM). A panel latent class model (LCM) was used and presented as the main analysis due to its ability to account for preference heterogeneity and identify preferences within different groups of the sample [47]. In this study, we aimed to determine if decisions can be linked to certain demographic groups. By identifying 'latent' or ‘hidden’ groups with distinct preferences and needs, neurodevelopmental care services can be tailored to meet the specific requirements of each group, which may ensure that access to care is provided to maximum families and their children. Moreover, we considered the theoretical interpretability of different models and decided to use panel LCM due to its clearer understanding and potential implications.
Since LCM is probabilistic, respondents belong to a group up to a certain probability and can be allocated the group they are most likely to be a member of [40]. Posterior probabilities were estimated to describe the differences in sociodemographic characteristics across groups. For each respondent, the posterior probability that they belong to each latent class was calculated and they were assigned to the class with the highest probability. Class membership was determined solely from the estimated preferences from the LCM [48]. The panel LCM codes are provided in Fig. 5 of Online Resource 2 and information on model fits are provided in Table 6 of Online Resource 1 (see ESM).
The below utility was estimated:
Where V is the observable relative utility and is a function of constant β0 and 16 parameters measuring the effect of neurodevelopmental follow-up care attributes described in Table 1.
Descriptive statistics were used to describe demographic characteristics of the overall sample and each latent class. The DCE data were categorical, therefore they were dummy coded. We conducted a scenario analysis (NLOGIT codes provided in Fig. 6 of Online Resource 2, ESM). By controlling attribute levels within hypothetical scenarios, researchers may assess respondents' sensitivity to variations, providing insights into potential policy outcomes, and informing decision-making processes [49, 50]. Moreover, to evaluate the extent to which each attribute contributes to the overall utility of follow-up care, we calculated the relative importance of attributes within each class [51]. To estimate the relative importance of each attribute, the difference between the highest and lowest coefficient of each attribute was divided by the sum of these differences across all attributes [48].
We performed Monte Carlo simulation to address the uncertainty associated with the parameters used in estimating the relative importance of attributes. For this purpose, a probability distribution was assigned to each parameter, reflecting the uncertainty surrounding its value [52]. This study used normal distributions (mean and standard error) to represent parameter estimates for each attribute level. Our Monte Carlo simulations consisted of 1000 iterations, whereby values were randomly sampled from the parameter distributions to generate simulated observations. These simulated observations were then used to estimate the mean and 95% confidence intervals of the relative importance of attributes in each class.
All analyses were done using NLOGIT Version 6 software [44] and R Version 1.3.1093 [53]. The output from the unconditional dataset was reported as the main result. Due to the small and incomparable sample size, the output from the conditional dataset is presented in Table 7 of Online Resource 1 in the ESM.
3 Results
3.1 Respondents’ Characteristics
Demographic details of the respondents are presented in Table 2. Overall, there were more female respondents than male (56.4% and 42.5%, respectively). Most respondents had completed a higher education qualification, including both undergraduate and postgraduate degrees. Over half of the respondents had full-time jobs and earned 60,000–120,000 Australian dollars (AUD). Approximately 64% of the respondents lived in metropolitan cities, and some lived in regional (27%) and rural (7%) areas. The median age of family members was 35 years. Most respondents’ children were diagnosed with ADHD (34%) or ASD (19%).
3.2 DCE Results
3.2.1 Latent Class Analysis
The results of the panel LCM are provided in Table 3. We tested the model with two and three classes, and ultimately selected the model with two classes because of its enhanced comprehensibility and clearer interpretability. The probability of individuals being in class 1 is more (63%) than them being in class 2 (37%).
Class 1 had more families with postgraduate degrees, full-time employees, and more individuals with higher incomes living in metropolitan areas when compared with class 2. Conversely, class 2 had more families with undergraduate degrees, part-time or casual employees, slightly lower income, and higher representation of individuals from regional areas when compared with class 1. Both groups showed similar age distributions and types of neurodevelopmental disorders, with most respondents' children diagnosed with ADHD and ASD. However, class 2 had a higher proportion of ADHD and ASD diagnoses, while class 1 had a higher representation of learning disabilities, intellectual disability, and conduct disorder.
The alternative specific constant (ASC) reveals that preferences for follow-up care options A and B were positive in class 1, indicating a tendency for individuals in this class to choose these options over the reference option (neither). On the contrary, preferences were negative in class 2, suggesting a preference against options A and B compared with the reference option. There was a significant heterogeneity regarding these preferences among respondents.
In class 1, local public health community clinics were preferred (0.97, 95% CI 0.45–1.50) when compared with private services. A similar trend was observed in class 2; however, it was not statistically significant. Moreover, city-based hospitals were disliked by families in class 2 (− 0.21, 95% CI − 0.44 to 0.02). Regarding modality of follow-up care, families from class 1 preferred face-to-face follow-up sessions (0.23, 95% CI 0.08–0.38); however, no significant difference was observed in preferences regarding this attribute in class 2. Regarding out-of-pocket costs, even though both classes 1 and 2 preferred to pay at least AUD100, the cost was more crucial in the decision-making process for families in class 2 (2.72, 95% CI 2.27–3.16) compared with those in class 1 (0.50, 95% CI 0.13–0.85). Both class 1 and class 2 preferred having mental health support provided to them (class 1: 0.13, 95% CI 0.01–0.25 and class 2: 0.43, 95% CI 0.23–0.64). While class 1 preferred group activities (0.27, 95% CI 0.06–0.48) and online learning (0.22, 95% CI 0.005–0.43) as ways of receiving educational information, there was no significant difference in the preferences regarding this attribute in class 2. Class 1 preferred health service providers initiating reminders and scheduling appointments for them (0.33, 95% CI 0.21–0.46), whereas class 2 was found to be indifferent to this aspect. Lastly, both classes preferred waiting <3 months for follow-up appointments compared with a waiting time of around 12 months.
3.2.2 Relative Importance
The relative importance of all attributes was estimated for each class and is reported in Table 4. In class 1, the most important attribute was location, driving 28% of the decision making, followed by cost (26%) and waiting time (16%). In class 2, cost accounted for nearly half of the importance when selecting an alternative (49%).
3.2.3 Scenario Analysis
The scenarios were discussed and finalised by the research team considering their practicality in the real world and alignment with the research question. The scenarios and analysis results are presented in Table 5. The probabilities of uptake for three hypothetical scenarios were compared with the probability of uptake for the base scenario (with reference levels of all attributes). For the overall sample, the base scenario showed uptake probability of 88.7%. For scenario 1, the probability of uptake increased to 98.6%, making it the most preferred or an ‘ideal’ follow-up care scenario. The probabilities of uptake for scenario 2 and scenario 3 are 88.9% and 96.8%, respectively. While there was not a considerable difference in preferences among all scenarios in class 1, class 2 showed a significantly higher preference for scenario 1 (99%) and a lower preference for scenario 2 (66%).
4 Discussion
The primary aim of this study was to identify families’ preferences for neurodevelopmental follow-up care for children. Overall, the findings suggested that both class 1 and class 2 families preferred accessing local public health community clinics and disliked city-based hospitals. Both classes favoured receiving mental health support and waiting < 3 months. Even though both classes preferred paying AUD100, the next preferred choice for class 1 was AUD500, whereas class 2 preferred no cost. While class 1 liked face-to-face follow-up, group activities for receiving educational information, and health service providers initiating reminders and scheduling appointments for them, no significant differences were observed in preferences regarding these attributes in class 2. The heterogeneity of follow-up care preferences may be of value to policy makers and health services officials that may facilitate care management service improvements for children and families.
Families in both classes preferred local public health community clinics, but this preference was not statistically significant in class 2. There is limited published literature on public care services, particularly for neurodevelopmental follow-up care for children. Some available services, such as Child Development Services in the state of Queensland, Australia, offer formal evaluation and diagnosis of neurodevelopmental delays, which are crucial for obtaining referrals for early interventions [54]. In a general healthcare context, these facilities may be located closer to home, which may save travel time and improve access, especially in rural or regional areas, and sometimes offer more services compared with private care [55, 56]. The cost of private services is relatively high; however, waiting time may be less and some families may be able to pay for private services to bypass public waiting lists. City-based hospitals may not be preferred due to their centralised nature, leading to extra travel time for patients, particularly if the families are from rural or regional areas [57]. Since there is a higher representation of families from regional areas in class 2, this may explain why they strongly dislike city-based hospitals. Additionally, a higher proportion of lower-income families in class 2 may contribute to their significant dislike, as increased travel time and costs pose a greater burden.
Families in both classes preferred face-to-face follow-up, although this was not statistically significant in class 2. This was somewhat contradictory, as recently, an increased trend of virtual care has been noted due to enhanced convenience and reduced waiting times [58,59,60]. Additionally, recent reports from the United States recommend integrating a telehealth model in neurodevelopmental assessments [61, 62]. There may be several potential barriers however, including technical issues, difficulty in ensuring confidentiality, limited control over distractions at home, difficulties in administering standardised testing virtually, and access to technology and electronic devices. However, virtual care may be further explored for those services where specialists do not need to physically examine the child. Even though it may improve access and efficiency in follow-up care, facilitating quicker connections for patients needing support and services, further investigation is therefore still required about its implementation to meet both family and heath service needs.
It is likely that the presence of higher-income individuals and more full-time employees in class 1 meant that cost was not the driving factor of decision making in this group. They preferred to pay at least AUD100 or AUD500 for their child’s treatment. Interestingly, the preference for AUD1500 over no cost in class 1 may be perceived as receiving more service benefits and better quality. However, the coefficient for AUD0 was statistically insignificant, so a definitive conclusion should not be made. However, for class 2, which was associated with comparatively lower-income individuals with more part-time or casual jobs, cost was the most crucial deciding factor (nearly 50% relative importance for this attribute). They preferred to pay AUD100 followed by paying no cost. Other studies have shown cost as a crucial factor in decision making [63,64,65,66], especially for a lower-income group as they often encounter significant financial burden [67, 68]. In Australia, the National Disability Insurance Scheme also financially supports those who qualify, but the qualification process may be time consuming and difficult to access for some individuals [69].
Families of both classes preferred mental health support. Mental health for families may be a lower priority when they are concerned about their children. Previous studies have indicated that parents of children with neurodevelopmental needs often experience poor wellbeing, anxiety, and depression [70,71,72,73]. Despite this information, very few neurodevelopmental follow-up services have included mental health support for families as a crucial consideration. For example, a cardiac neurodevelopmental programme in Canada counselled 100% of the families in that programme on neurodevelopmental outcomes [74]. Moreover, studies have reported that financial stress may also negatively influence mental health and wellbeing [75, 76], which may be the reason that mental health support was relatively more important for class 2 (more low-income families), but the least important attribute for class 1 (more high-income families). This may inform decision makers to prioritise families’ mental health to reduce burden, improving their resilience related to the neurodevelopmental outcomes of their children.
Providing appropriate educational resources to families regarding neurodevelopmental delays and problems specific to their children is important. Even though class 2 families did not think this attribute was important, class 1 families considered group activities such as playgroups or peer support classes and online learning material helpful. Prior evidence shows that playgroups or peer support activities have been beneficial for families as they offer opportunities to connect with others with similar experiences, feel accepted, enhance their knowledge and skills, as well as provide an environment for child development, socialising, and enjoyment [77, 78]. Online learning material or training for families may also be valuable as it may make them self-reliant and skilled at addressing parenting stress or issues with their children, especially if they do not have the time to attend traditional classes [79, 80]. Preliminary evidence from a study in Canada indicated high parent satisfaction and improved parenting confidence, parenting skills, and child behaviour with the development of an online training programme that included educational modules and videoconference sessions with a therapist [81]. On the contrary, educational information provided face-to-face via a professional was not as effective, possibly due to its higher cost or the time commitment required, with sessions typically lasting 45–90 minutes [79, 82]. Moreover, studies have shown that using a phone application can be a useful tool for educational information purposes and accessing support related to neurodevelopmental follow-up care [83, 84]. It may be interpreted for class 2, which had more families with a lower income, that these educational information methods were not deemed necessary as they may have an additional cost.
In terms of managing appointments, it had no significant effect on class 2 families, but class 1 families preferred health service providers initiating reminders and scheduling appointments for them. A recent study reported that when health service providers scheduled appointments for neurodevelopmental evaluation, adherence was higher compared with when families scheduled appointment themselves [85]. This may lead to more effective and quick formal evaluations for children, identifying delays earlier and providing appropriate treatments, thus facilitating better patient-centred care. Our interviews confirm that implementing such systems could serve as a safety net. However, flexibility should also be provided based on the availability of family members, hence forming a hybrid care management system.
Waiting time was crucial for both classes. In healthcare, this issue has persisted where people often wait excessively to access services. This may be detrimental in the case of neurodevelopmental issues, as by the time families seek assistance for their child, the issue may have already progressed, with considerable literature highlighting this concern [86,87,88,89,90,91]. The latest findings from the Sydney Child Neurodevelopment Research Registry suggest that the average age that caregivers identified developmental concerns was 3 years of age, but the average age for receiving a developmental assessment was about 6 years [92]. These waiting delays may challenge implementing early intervention and support policies that depend on timely developmental assessments. This is further confirmed by one of our interview participants, who reported waiting for 3 years for their child's follow-up visit. During this waiting period, they experienced anxiety due to uncertainty about their child's condition and the lack of access to suitable treatment or support.
The scenario analysis suggests that there may be a likely impact of different scenarios on programme uptake. It shows the importance of considering various system-level aspects to optimise the effectiveness of neurodevelopmental follow-up care for children and families. Even though the different scenarios did not make notable differences in preference for class 1, the significant uptake increase observed in the first scenario—nearly 10% for the overall sample and nearly 24% for class 2—indicates that future programmes may be designed to account for the preferences identified in that scenario. This may include policies designed to reduce out-of-pocket costs, improve access to local public health community clinics, minimise waiting times, provide families online learning material, promote mental health counselling, and enhance coordination between healthcare providers and families. Other studies have conducted scenario analysis including DCEs regarding maternal health, doctor attendance, vaccination preferences, hypertension management, and environmental health fields [49, 50, 93,94,95,96], consequently informing policy simulations.
4.1 Further Steps
This study has a range of implications. The findings may be useful for Child Health Services and Child Development Services to enhance their neurodevelopmental follow-up care services. Moreover, health insurance policymakers may use these findings to step up to cover the costs of more services, including providing education and mental health support to families. Methodology-wise, DCEs may be conducted considering different perspectives (e.g., taxpayers’ perspective). Since taxpayers fund these services as a society, eliciting their preferences regarding the structure and delivery of care may also be an essential voice. The findings may also be integrated with economic evaluations to predict service uptake or cost effectiveness of neurodevelopmental care services. Furthermore, virtual care solutions may be explored to enhance service accessibility and reduce waiting times. Implementing such strategies may ensure practical use of healthcare resources and improved overall patient experiences. While including children's preferences was outside the scope of this study, it is a crucial area for future research, as also suggested by another study [97].
4.2 Strengths and Limitations
While this may not be considered as a strength or a limitation, it is worth noting that most of the sample in this study were better educated than the general population, which might imply that they may be more informed and proactive in seeking neurodevelopmental care for their children; this may have influenced preferences and decision-making processes.
It can be challenging to conduct DCEs in neurodevelopment-related contexts. Generating an apt design that focuses on the specific population and is methodologically correct remains imperative. Previous DCEs conducted in this context have evident limitations in their designs. For instance, absence of justification for forced choices (i.e., respondents not having the freedom to opt out if they were not interested in an option [98, 99]); using many attributes (e.g., n = 20) and choice tasks (e.g., n = 30) [100,101,102]; and not conducting pilot tests [10, 103]. These shortcomings were addressed in our study. The inclusion of a ‘neither’ option made the choice task realistic without forcing a participant to choose from the given choices. Our pre-test determined cognitively appropriate numbers of attributes, levels, and choice tasks to ensure that they do not cause a cognitive burden on respondents. The pilot studies informed us about the availability of the target population, due to which the priors we obtained may be comparatively efficient. Several trials in designing the DCE were useful for various reasons, including gaining an understanding of the sample size, obtaining priors, finalising the structure or function of the choice tasks and the overall DCE survey.
Despite several strengths of this study, there were some limitations. Firstly, the qualitative attribute development phase; even though our literature review and expert advice were appropriate for the qualitative groundwork for the DCE, we experienced challenges with recruitment as we encountered a case of participant fraud in online focus groups and interviews. Although it interrupted the study, we identified it early and implemented strategies to prevent this in further recruitment. Moreover, we identified ‘red flags’ for identifying imposter participants in the future [36]. Secondly, we reported the unconditional dataset as the main output. Even though combining the unconditional and conditional datasets increases the dataset's quality, the combined behavioural model would imply something completely different compared with the unconditional one, which is the true choice of the sample. Thirdly, another limitation of our study is the complexity of the ‘location’ attribute, which may encompass more than just the geographical aspect of healthcare services (e.g., the type of provider). In another instance, the implication of travel time may vary depending on the respondent's location as ‘local’ clinics are often presumed to be nearby for all respondents, while ‘city-based’ hospitals may be more accessible for urban respondents than for those in rural areas. This variability could influence preferences based on individual travel constraints and convenience. Moreover, different levels of the location attribute might imply differences in service quality, and some respondents may have ideological preferences for public versus private providers. Future studies could benefit from disentangling these factors to provide clearer insights into preferences related to healthcare service locations. Fourthly, in terms of analysis, we considered conducting a sub-analysis for various neurodevelopmental disorders, but the sample size (overall and of the two classes) for each diagnostic group were insufficient. Additionally, we did not use a statistical significance test to assess differences between classes as the primary goal of our study was to provide a descriptive overview of the characteristics of the identified latent classes. Given the exploratory nature of our analysis, we aimed to offer an understanding of the profiles within each class rather than to test for statistical differences. Furthermore, the use of statistical significance tests may not be appropriate in this context due to the assumptions required by these tests, which may not be met by the latent class analysis-derived classes. Therefore, we chose to present the descriptive characteristics to highlight the practical relevance and implications of our findings. Lastly, this study represents the combined preferences for all neurodevelopmental disorders or delays. The scope of this study was limited to providing an overview of preferences for informing a healthcare service design perspective rather than individual diagnosis. Given the diversity within neurodevelopmental disorders and individual circumstances, preferences may vary widely among consumers within the same diagnostic category and across different diagnostic groups. Moreover, health system designs internationally have not typically established different health systems and services for individual diagnostic groups, but rather aim to provide comprehensive services that cater to a spectrum of at-risk children regardless of whether they have specific diagnoses upon entering services. Our analysis also supports this information as the sociodemographic characteristic 'types of neurodevelopmental disorders' did not show any evidence suggesting that families of children with different conditions preferred different service models. We have tried to be inclusive of a range of diagnoses and disorders in this study. Therefore, the findings arising from this study should not be interpreted as representing the preferences of all families who may access neurodevelopmental follow-up care.
5 Conclusion
The design and delivery of neurodevelopmental care services for children have room for improvement. We conducted a DCE that identified families’ preferences for neurodevelopmental follow-up care for their children. The findings suggest that health services may benefit from prioritising aspects including making local public health community clinics more accessible, reducing waiting times and costs, providing mental health and educational resources to family members, and organising better care coordination for follow-up visits. Implementing these evidence-based findings may support resource allocation and contribute to improved outcomes for children with neurodevelopmental needs and their families.
Data Availability
The datasets generated and/or analysed during the current study are not publicly available due to privacy considerations as they may contain potentially identifiable information about participants but are available from the corresponding author on reasonable request.
Code Availability
Relevant codes are provided as supplementary material.
References
Thapar A, Cooper M, Rutter M. Neurodevelopmental disorders. Lancet Psychiatry. 2017;4(4):339–46.
American Psychiatric Association D, Association AP. Diagnostic and statistical manual of mental disorders: DSM-5. Washington DC: American psychiatric association; 2013.
Yang Y, Zhao S, Zhang M, Xiang M, Zhao J, Chen S, et al. Prevalence of neurodevelopmental disorders among US children and adolescents in 2019 and 2020. Front Psychol. 2022;13: 997648.
Health AIo, Welfare. Australia's children. Canberra: AIHW. 2022.
McGowan EC, Vohr BR. Neurodevelopmental follow-up of preterm infants: what is new? Pediatr Clin. 2019;66(2):509–23.
Salt A, Redshaw M. Neurodevelopmental follow-up after preterm birth: follow up after two years. Early Human Dev. 2006;82(3):185–97.
Glenngård AH, Hjelmgren J, Thomsen PH, Tvedten T. Patient preferences and willingness-to-pay for ADHD treatment with stimulants using discrete choice experiment (DCE) in Sweden, Denmark and Norway. Nord J Psychiatry. 2013;67(5):351–9.
Tsai J-H, Crossnohere NL, Strong T, Bridges JF. Measuring meaningful benefit-risk tradeoffs to promote patient-focused drug development in Prader–Willi syndrome: a discrete-choice experiment. MDM Policy Pract. 2021;6(2):23814683211039456.
Webb EJ, Lynch Y, Meads D, Judge S, Randall N, Goldbart J, et al. Finding the best fit: examining the decision-making of augmentative and alternative communication professionals in the UK using a discrete choice experiment. BMJ Open. 2019;9(11):e030274.
Fegert JM, Slawik L, Wermelskirchen D, Nuebling M, Muehlbacher A. Assessment of parents’ preferences for the treatment of school-age children with ADHD: a discrete choice experiment. Expert Rev Pharmacoecon Outcomes Res. 2011;11(3):245–52.
Boulton KA, Hodge A, Levu K, Ong N, Silove N, Guastella AJ. Access and barriers to supports for children and caregivers attending public child developmental assessment services: findings from the Sydney child neurodevelopment research registry. Autism Res. 2023;17(3):555–67.
Preece PM, Mott J. Multidisciplinary assessment at a child development centre: do we conform to recommended standards? Child Care Health Dev. 2006;32(5):559–63.
Harding KE, Lewis AK, Dennett A, Hughes K, Clarke M, Taylor NF. An evidence-based demand management strategy using a hub and spoke training model reduces waiting time for children’s therapy services: an implementation trial. Child Care Health Dev. 2024;50(1): e13154.
Galliver M, Gowling E, Farr W, Gain A, Male I. Cost of assessing a child for possible autism spectrum disorder? An observational study of current practice in child development centres in the UK. BMJ Paediatr Open. 2017;1(1): e000052.
Singhi P, Malhi P. Early diagnosis of autism spectrum disorder: what the pediatricians should know. Indian J Pediatr. 2023;90(4):364–8.
Chen C, Bailey C, Baikie G, Dalziel K, Hua X. Parents of children with disability: mental health outcomes and utilization of mental health services. Disabil Health J. 2023;16(4): 101506.
Ahmed R, Borst JM, Yong CW, Aslani P. Do parents of children with attention-deficit/hyperactivity disorder (ADHD) receive adequate information about the disorder and its treatments? A qualitative investigation. Patient preference and adherence. 2014;8:661–70.
Bailes AF, Gannotti M, Bellows DM, Shusterman M, Lyman J, Horn SD. Caregiver knowledge and preferences for gross motor function information in cerebral palsy. Dev Med Child Neurol. 2018;60(12):1264–70.
Davis CC, Claudius M, Palinkas LA, Wong JB, Leslie LK. Putting families in the center: family perspectives on decision making and ADHD and implications for ADHD care. J Atten Disord. 2012;16(8):675–84.
Kawarai S, Symon JB, Hernández A, Fryling MJ. Assessing preferences among behavioral interventions with Japanese parents of children with developmental disabilities. Child Fam Behav Ther. 2017;39(3):191–9.
de Bekker-Grob EW, Ryan M, Gerard K. Discrete choice experiments in health economics: a review of the literature. Health Econ. 2012;21(2):145–72.
Sharma P, Kularatna S, Abell B, Eagleson K, Vo LK, Halahakone U, et al. Preferences in the design and delivery of neurodevelopmental follow-up care for children: a systematic review of discrete choice experiments. Patient Prefer Adherence. 2023;17:2325–41.
Bridges JFP, Hauber AB, Marshall D, Lloyd A, Prosser LA, Regier DA, et al. Conjoint analysis applications in health—a checklist: a report of the ISPOR good research practices for conjoint analysis task force. Value Health. 2011;14(4):403–13.
Johnson FR, Lancsar E, Marshall D, Kilambi V, Mühlbacher A, Regier DA, et al. Constructing experimental designs for discrete-choice experiments: report of the ISPOR conjoint analysis experimental design good research practices task force. Value Health. 2013;16(1):3–13.
Hauber AB, González JM, Groothuis-Oudshoorn CG, Prior T, Marshall DA, Cunningham C, et al. Statistical methods for the analysis of discrete choice experiments: a report of the ISPOR conjoint analysis good research practices task force. Value Health. 2016;19(4):300–15.
Johnson FR, Adamowicz W, Groothuis-Oudshoorn C. What can discrete-choice experiments tell us about patient preferences? An introduction to quantitative analysis of choice data. Patient Patient Center Outcomes Res. 2024;24:1–16.
Whitty JA, Lancsar E, De Abreu Lourenco R, Howard K, Stolk EA. Putting the choice in choice tasks: incorporating preference elicitation tasks in health preference research. Patient Patient Center Outcomes Res. 2024;14:1–9.
Lancsar E, Louviere J. Conducting discrete choice experiments to inform healthcare decision making: a user’s guide. Pharmacoeconomics. 2008;26:661–77.
Kularatna S, Allen M, Hettiarachchi RM, Crawford-Williams F, Senanayake S, Brain D, et al. Cancer survivor preferences for models of breast cancer follow-up care: selecting attributes for inclusion in a discrete choice experiment. Patient Patient Center Outcomes Res. 2023;16(4):371–83.
Senanayake S, Barnett A, Brain D, Allen M, Powell EE, O’Beirne J, et al. A discrete choice experiment to elicit preferences for a chronic disease screening programme in Queensland Australia. Public Health. 2024;228:105–11.
Mohammed Selim S, Senanayake S, McPhail SM, Carter HE, Naicker S, Kularatna S. Consumer preferences for a healthcare appointment reminder in australia: a discrete choice experiment. Patient Patient Center Outcomes Res. 2024;11:1–14.
Hollin IL, Craig BM, Coast J, Beusterien K, Vass C, DiSantostefano R, et al. Reporting formative qualitative research to support the development of quantitative preference study protocols and corresponding survey instruments: guidelines for authors and reviewers. Patient Patient Center Outcomes Res. 2020;13:121–36.
Coast J, Horrocks S. Developing attributes and levels for discrete choice experiments using qualitative methods. J Health Serv Res Policy. 2007;12(1):25–30.
Ellard-Gray A, Jeffrey NK, Choubak M, Crann SE. Finding the hidden participant: solutions for recruiting hidden, hard-to-reach, and vulnerable populations. Int J Qual Methods. 2015;14(5):1609406915621420.
Hoppitt T, Shah S, Bradburn P, Gill P, Calvert M, Pall H, et al. Reaching the ‘hard to reach’: strategies to recruit black and minority ethnic service users with rare long-term neurological conditions. Int J Soc Res Methodol. 2012;15(6):485–95.
Sharma P, McPhail SM, Kularatna S, Senanayake S, Abell B. Navigating the challenges of imposter participants in online qualitative research: lessons learned from a paediatric health services study. BMC Health Serv Res. 2024;24(1):724.
De Brún A, Flynn D, Ternent L, Price CI, Rodgers H, Ford GA, et al. A novel design process for selection of attributes for inclusion in discrete choice experiments: case study exploring variation in clinical decision-making about thrombolysis in the treatment of acute ischaemic stroke. BMC Health Serv Res. 2018;18:1–14.
Webb EJD, Meads D, Lynch Y, Judge S, Randall N, Goldbart J, et al. Attribute selection for a discrete choice experiment incorporating a best-worst scaling survey. Value Health. 2021;24(4):575–84.
Marshall D, Bridges JF, Hauber B, Cameron R, Donnalley L, Fyie K, et al. Conjoint analysis applications in health—how are studies being designed and reported? An update on current practice in the published literature between 2005 and 2008. Patient Patient Center Outcomes Res. 2010;3:249–56.
Hensher D, Rose J, Greene W. Applied choice analysis-second Edi. ed. Cambridge University Press, The University Printing House, Cambridge CB2 8RU, UK; 2015.
ChoiceMetrics N. 1.2 User manual & reference guide, Australia. 2012.
Soekhai V, de Bekker-Grob EW, Ellis AR, Vass CM. Discrete choice experiments in health economics: past, present and future. Pharmacoeconomics. 2019;37:201–26.
Campoamor NB, Guerrini CJ, Brooks WB, Bridges JF, Crossnohere NL. Pretesting discrete-choice experiments: a guide for researchers. Patient Patient Center Outcomes Res. 2024;17(2):109–20.
Greene WH. NLOGIT reference guide : version 3.0: Plainview. Econometric Software, Inc., New York. 2002.
Bliemer MCJ, Rose JM, Hess S. Approximation of bayesian efficiency in experimental choice designs. J Choice Model. 2008;1(1):98–126.
Rose JM, Bliemer MCJ. Sample size requirements for stated choice experiments. Transportation. 2013;40(5):1021–41.
Lancsar E, Fiebig DG, Hole AR. Discrete choice experiments: a guide to model specification, estimation and software. Pharmacoeconomics. 2017;35:697–716.
Hoedemakers M, Karimi M, Jonker M, Tsiachristas A, Rutten-van MM. Heterogeneity in preferences for outcomes of integrated care for persons with multiple chronic diseases: a latent class analysis of a discrete choice experiment. Qual Life Res. 2022;31(9):2775–89.
Borriello A, Master D, Pellegrini A, Rose JM. Preferences for a COVID-19 vaccine in Australia. Vaccine. 2021;39(3):473–9.
Angell B, Khan M, Islam MR, Mandeville K, Naher N, Hutchinson E, et al. Incentivising doctor attendance in rural Bangladesh: a latent class analysis of a discrete choice experiment. BMJ Glob Health. 2021;6(7): e006001.
Gonzalez JM. A guide to measuring and interpreting attribute importance. Patient Patient Center Outcomes Res. 2019;12(3):287–95.
Harrison RL (ed) Introduction to monte carlo simulation. In: AIP conference proceedings. NIH Public Access. 2010;1204:17.
R. A language and environment for statistical computing. In: R Foundation for Statistical Computing V, Austria, editor. 1.3.1093 ed. Vienna, Austria: R Core Team 2021.
Eagleson K, Campbell M, McAlinden B, Heussler H, Pagel S, Webb KL, et al. Congenital Heart Disease Long-term Improvement in Functional hEalth (CHD LIFE): a partnership programme to improve the long-term functional health of children with congenital heart disease in Queensland. J Paediatr Child Health. 2020;56(7):1003–9.
Duckett SJ. Living in the parallel universe in Australia: public Medicare and private hospitals. CMAJ. 2005;173(7):745–7.
Ward PR, Rokkas P, Cenko C, Pulvirenti M, Dean N, Carney AS, et al. ‘Waiting for’and ‘waiting in’public and private hospitals: a qualitative study of patient trust in South Australia. BMC Health Serv Res. 2017;17:1–11.
Abell BR, Eagleson K, Auld B, Bora S, Justo R, Parsonage W, et al. Implementing neurodevelopmental follow-up care for children with congenital heart disease: a scoping review with evidence mapping. Dev Med Child Neurol. 2024;66(2):161–75.
Jamieson T, Wallace R, Armstrong K, Agarwal P, Griffin B, Wong I, et al. Virtual care: a framework for a patient-centric system. Toronto: Women’s College Hospital Institute for Health Systems Solutions and Virtual Care; 2015. p. 11.
Donelan K, Barreto EA, Sossong S, Michael C, Estrada JJ, Cohen AB, et al. Patient and clinician experiences with telehealth for patient follow-up care. Am J Manag Care. 2019;25(1):40–4.
Barsom EZ, Jansen M, Tanis PJ, van de Ven AW, Blussé van Oud-Alblas M, Buskens CJ, et al. Video consultation during follow up care: effect on quality of care and patient-and provider attitude in patients with colorectal cancer. Surg Endosc. 2021;35:1278–87.
Cox SM, Butcher JL, Sadhwani A, Sananes R, Sanz JH, Blumenfeld E, et al. Integrating telehealth into neurodevelopmental assessment: a model from the cardiac neurodevelopmental outcome collaborative. J Pediatr Psychol. 2022;47(6):707–13.
Kasparian NA, Sadhwani A, Sananes R, Blumenfeld E, Butcher JL, Cassidy AR, et al. Telehealth services for cardiac neurodevelopmental care during the COVID-19 pandemic: a site survey from the Cardiac Neurodevelopmental Outcome Collaborative. Cardiol Young. 2023;33(2):280–7.
Carlsson F, Martinsson P. How much is too much? An investigation of the effect of the number of choice sets, context dependence and the choice of bid vectors in choice experiments. Environ Resource Econ. 2008;40:165–76.
Regier DA, Diorio C, Ethier M-C, Alli A, Alexander S, Boydell KM, et al. Discrete choice experiment to evaluate factors that influence preferences for antibiotic prophylaxis in pediatric oncology. PLoS ONE 2012;7(10): e47470.
Najafzadeh M, Johnston KM, Peacock SJ, Connors JM, Marra MA, Lynd LD, et al. Genomic testing to determine drug response: measuring preferences of the public and patients using Discrete Choice Experiment (DCE). BMC Health Serv Res. 2013;13:1–12.
Ngorsuraches S, Thongkeaw K. Patients’ preferences and willingness-to-pay for postmenopausal hormone receptor-positive, HER2-negative advanced breast cancer treatments after failure of standard treatments. Springerplus. 2015;4:1–11.
Kullgren JT, Galbraith AA, Hinrichsen VL, Miroshnik I, Penfold RB, Rosenthal MB, et al. Health care use and decision making among lower-income families in high-deductible health plans. Arch Intern Med. 2010;170(21):1918–25.
Ketsche P, Adams EK, Wallace S, Kannan VD, Kannan H. Lower-income families pay a higher share of income toward national health care spending than higher-income families do. Health Aff. 2011;30(9):1637–46.
Foster M, Henman P, Tilse C, Fleming J, Allen S, Harrington R. ‘Reasonable and necessary’care: the challenge of operationalising the NDIS policy principle in allocating disability care in Australia. Aust J Soc Issues. 2016;51(1):27–46.
Wang L, Li D, Pan S, Zhai J, Xia W, Sun C, et al. The relationship between 2019-nCoV and psychological distress among parents of children with autism spectrum disorder. Glob Health. 2021;17(1):23.
McCann D. Making the invisible visible: home care provided by parents of children with complex needs: University Of Tasmania. 2016. https://doi.org/10.25959/23240468.v1
Bayer ND, Wang H, Yu JA, Kuo DZ, Halterman JS, Li Y. A national mental health profile of parents of children with medical complexity. Pediatrics. 2021;148(2).
Bolduc M-E, Rennick JE, Gagnon I, Sokol E, Majnemer A, Brossard-Racine M. Navigating the healthcare system with my child with CHD: parental perspectives on developmental follow-up practices. Cardiol Young. 2024;34(1):37–43.
Roberts SD, Kazazian V, Ford MK, Marini D, Miller SP, Chau V, et al. The association between parent stress, coping and mental health, and neurodevelopmental outcomes of infants with congenital heart disease. Clin Neuropsychol. 2021;35(5):948–72.
Wray TB, Dvorak RD, Martin SL. Demographic and economic predictors of mental health problems and contact with treatment resources among adults in a low-income primary care setting. Psychol Health Med. 2013;18(2):213–22.
Sareen J, Afifi TO, McMillan KA, Asmundson GJ. Relationship between household income and mental disorders: findings from a population-based longitudinal study. Arch Gen Psychiatry. 2011;68(4):419–27.
Armstrong J, Elliott C, Davidson E, Mizen J, Wray J, Girdler S. The Power of playgroups: key components of supported and therapeutic playgroups from the perspective of parents. Aust Occup Ther J. 2021;68(2):144–55.
Armstrong J, Elliott C, Wray J, Davidson E, Mizen J, Girdler S. Defining therapeutic playgroups: key principles of therapeutic playgroups from the perspective of professionals. J Child Fam Stud. 2020;29:1029–43.
Tan-MacNeill KM, Smith IM, Johnson SA, Chorney J, Corkum P. A systematic review of online parent-implemented interventions for children with neurodevelopmental disorders. Child Health Care. 2021;50(3):239–77.
Yamanaka T, Yuruki K, Sanabe Y, Yasutake M, Inoue M. Assessing the effectiveness of real-time online parent training for parents of children with diverse neurodevelopmental disorders residing in the community. Yonago Acta Med. 2023;66(4):448–58.
Burek B, Ford MK, Hooper M, Green R, Kohut SA, Andrade BF, et al. Transdiagnostic feasibility trial of internet-based parenting intervention to reduce child behavioural difficulties associated with congenital and neonatal neurodevelopmental risk: introducing I-InTERACT-North. Clin Neuropsychol. 2021;35(5):1030–52.
Roberts CA, Smith KC, Sherman AK. Comparison of online and face-to-face parent education for children with autism and sleep problems. J Autism Dev Disord. 2019;49:1410–22.
Pelser K-B. Using a cell phone application to support caregivers of children with Autism Spectrum Disorder: University of Pretoria (South Africa). Thesis. 2019.
Haque MM, Rabbani M, Dipal DD, Zarif MII, Iqbal A, Akhter S, et al. Grant report on mCARE: mobile-based care for children with autism spectrum disorder (ASD) for low-and middle-income countries (LMICs). J Psychiat Brain Sci. 2021;6.
Ortinau CM, Wypij D, Ilardi D, Rofeberg V, Miller TA, Donohue J, et al. Factors associated with attendance for cardiac neurodevelopmental evaluation. Pediatrics. 2023;152(3): e2022060995.
Creen J, Kennedy-Behr A, Gee K, Wilks L, Verdonck M. Reducing time between referral and diagnosis in paediatric outpatient neurodevelopmental and behavioural clinics. J Paediatr Child Health. 2021;57(1):126–31.
Enneking B, Ryan T, Tang Q, James C, Rouse M, Curtin M, et al. Acceptability and access metrics for telehealth consultation of pediatric neurodevelopmental disabilities during COVID-19. J Pediatr Health Care. 2023;37(2):200–7.
Kanne SM, Bishop SL. Editorial perspective: the autism waitlist crisis and remembering what families need. J Child Psychol Psychiatry. 2021;62(2):140–2.
Keehn RM, Tomlin A, Ciccarelli MR. COVID-19 pandemic highlights access barriers for children with autism spectrum disorder. J Dev Behav Pediatr. 2021;42(7):599–601.
Constantino JN, Abbacchi AM, Saulnier C, Klaiman C, Mandell DS, Zhang Y, et al. Timing of the diagnosis of autism in African American children. Pediatrics. 2020;146(3).
Wiggins LD, Durkin M, Esler A, Lee LC, Zahorodny W, Rice C, et al. Disparities in documented diagnoses of autism spectrum disorder based on demographic, individual, and service factors. Autism Res. 2020;13(3):464–73.
Boulton KA, Hodge M-A, Jewell A, Ong N, Silove N, Guastella AJ. Diagnostic delay in children with neurodevelopmental conditions attending a publicly funded developmental assessment service: findings from the Sydney Child Neurodevelopment Research Registry. BMJ Open. 2023;13(2): e069500.
Fletcher B, Hinton L, McManus R, Rivero-Arias O. Patient preferences for management of high blood pressure in the UK: a discrete choice experiment. Br J Gen Pract. 2019;69(686):e629–37.
Khan S, Yao L, Khan ZA, Ali U, Zhao M. Exploring stakeholder preferences and spatial heterogeneity in policy scenario analysis for vulnerable ecosystems: a choice experiment approach. Ecol Ind. 2023;153: 110438.
Byun H, Shin J, Lee C-Y. Using a discrete choice experiment to predict the penetration possibility of environmentally friendly vehicles. Energy. 2018;144:312–21.
Fletcher BR, Rowe R, Hollowell J, Scanlon M, Hinton L, Rivero-Arias O. Exploring women’s preferences for birth settings in England: a discrete choice experiment. PLoS One. 2019;14(4): e0215098.
Stafford L. ‘What about my voice’: emancipating the voices of children with disabilities through participant-centred methods. Child Geograph. 2017;15(5):600–13.
Mühlbacher AC, Rudolph I, Lincke H-J, Nübling M. Preferences for treatment of attention-deficit/hyperactivity disorder (ADHD): a discrete choice experiment. BMC Health Serv Res. 2009;9(1):1–10.
Waschbusch DA, Cunningham CE, Pelham WE Jr, Rimas HL, Greiner AR, Gnagy EM, et al. A discrete choice conjoint experiment to evaluate parent preferences for treatment of young, medication naive children with ADHD. J Clin Child Adolesc Psychol. 2011;40(4):546–61.
Cunningham CE, Deal K, Rimas H, Buchanan DH, Gold M, Sdao-Jarvie K, et al. Modeling the information preferences of parents of children with mental health problems: a discrete choice conjoint experiment. J Abnorm Child Psychol. 2008;36:1123–38.
Wymbs FA, Chen Y, Rimas HM, Deal K, Waschbusch DA, Pelham WE. Examining parents’ preferences for group parent training for ADHD when individual parent training is unavailable. J Child Fam Stud. 2017;26:888–904.
Wymbs FA, Cunningham CE, Chen Y, Rimas HM, Deal K, Waschbusch DA, et al. Examining parents’ preferences for group and individual parent training for children with ADHD symptoms. J Clin Child Adolesc Psychol. 2016;45(5):614–31.
Cross J, Yang J-C, Johnson FR, Quiroz J, Dunn J, Raspa M, et al. Caregiver preferences for the treatment of males with fragile X syndrome. J Dev Behav Pediatr. 2016;37(1):71–9.
Funding
Open Access funding enabled and organized by CAUL and its Member Institutions. This work is part of a programme of research funded through a Medical Research Future Fund (MRFF) Congenital Heart Disease Grant (ARGCHDG0035) 2020-2024. This funder did not have any role in the study design, data collection and analysis, decision to publish, or preparation of the manuscript.
Author information
Authors and Affiliations
Contributions
Pakhi Sharma: Conceptualization, Data curation, Methodology, Formal analysis, Investigation, Software, Writing—Original Draft, Writing—Review & Editing. Sanjeewa Kularatna: Conceptualization, Data curation, Methodology, Validation, Resources, Writing—Review & Editing, Supervision, Project administration, Funding acquisition. Bridget Abell: Conceptualization, Data curation, Methodology, Investigation, Formal analysis, Validation, Resources, Writing—Review & Editing, Supervision. Steven M. McPhail: Conceptualization, Methodology, Validation, Resources, Writing—Review & Editing, Supervision, Project administration, Funding acquisition. Sameera Senanayake: Conceptualization, Data curation, Methodology, Investigation, Formal analysis, Validation, Resources, Software, Writing—Review & Editing, Supervision.
Corresponding author
Ethics declarations
Conflict of Interest
The authors declare no conflict of interest.
Ethics approval and participant consent
This study was approved by the Human Research Ethics Committee, Queensland University of Technology (approval number: 6468). Written consent was obtained from all the participants for both the interviews and the DCE survey.
Consent for publication
Not applicable.
Supplementary Information
Below is the link to the electronic supplementary material.
Rights and permissions
Open Access This article is licensed under a Creative Commons Attribution-NonCommercial 4.0 International License, which permits any non-commercial use, sharing, adaptation, distribution and reproduction in any medium or format, as long as you give appropriate credit to the original author(s) and the source, provide a link to the Creative Commons licence, and indicate if changes were made. The images or other third party material in this article are included in the article's Creative Commons licence, unless indicated otherwise in a credit line to the material. If material is not included in the article's Creative Commons licence and your intended use is not permitted by statutory regulation or exceeds the permitted use, you will need to obtain permission directly from the copyright holder. To view a copy of this licence, visit http://creativecommons.org/licenses/by-nc/4.0/.
About this article

Cite this article
Sharma, P., Kularatna, S., Abell, B. et al. Preferences for Neurodevelopmental Follow-Up Care for Children: A Discrete Choice Experiment. Patient (2024). https://doi.org/10.1007/s40271-024-00717-3
Accepted:
Published:
DOI: https://doi.org/10.1007/s40271-024-00717-3