
Abstract
Key message
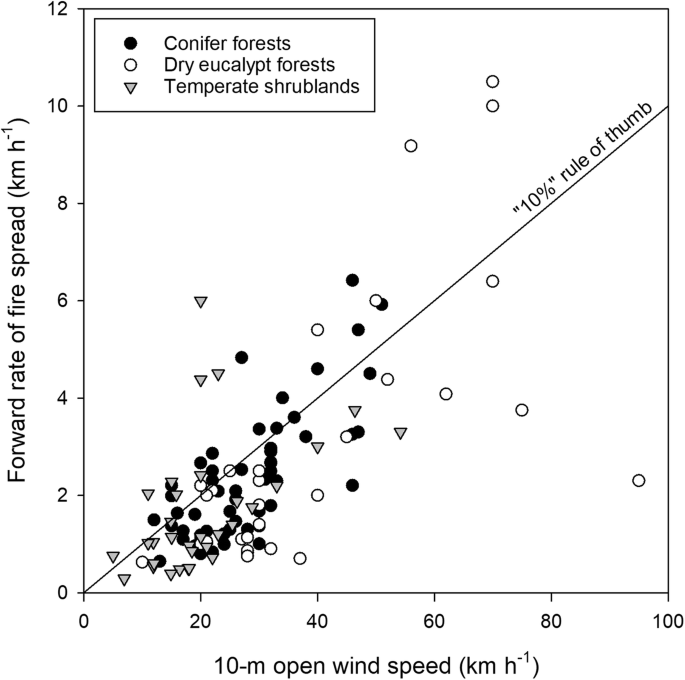
The collective analysis of a relatively large number of wildfire observations documented in conifer forests, dry eucalypt forests and temperate shrublands revealed that the forward rate of fire spread is roughly 10% of the average 10-m open wind speed, provided both are expressed in the same units (e.g. km h −1 ).
Context
Knowledge of a wildfire’s forward spread rate is a prerequisite for defining adequate fire suppression strategies and to ensure timely public warnings.
Aims
We wanted to investigate the possibility that a simple relationship exists that could be used as a first approximation for quickly estimating a wildfire’s spread rate simply from the open wind speed alone.
Methods
We analysed data from a number of high-intensity wildfire observations (n = 118) documented in temperate shrublands, Australian dry eucalypt forests and North American conifer forests to examine the suitability and soundness of a relationship between wind speed and rate of fire spread. We also contrasted the performance of the best function against established fire spread rate models for the three fuel types.
Results
The resulting rule of thumb is that the forward rate of spread of wildfires burning in forests and shrublands in relatively dry conditions is approximately equal to 10% of the average 10-m open wind speed, where both values are expressed in the same units.
Conclusion
The rule of thumb gives the most accurate results for dry fuel and high wind speed conditions with reduced bias and mean relative errors lower than 50%. Under these conditions, the error statistics are comparable to those obtained by the established fire spread rate models. The rule is not applicable to grasslands.
1 Introduction
Free-burning wildland fires are a determinant feature of the Earth system. Under favourable burning conditions, a random ignition can result in a fast-spreading, high-intensity wildfire causing widespread damage to human values (Harris et al. 2012) and ecosystem components (Scott et al. 2014). In such situations, effective suppression of the head fire region is impossible and outright dangerous for firefighter resources (Alexander and Thorburn 2015). The key to mitigating the threat that wildfires pose to the personal safety of people is to be able to gauge their potential speed and direction across the landscape (Cruz et al. 2015) and to use this information to release timely and effective public warnings and evacuation orders (Cova et al. 2005; Alexander et al. 2017; Neale and May 2018).
Mathematical models and quantitative methods to predict wildland fire behaviour on an operational basis have been under development since the 1960s (McArthur 1967; Rothermel 1972; Van Wagner 1973; Albini 1976). The models and methods have evolved over the years, namely with the development of complex spatial fire growth simulators such as FARSITE (Finney 2004), Prometheus (Tymstra et al. 2010), Phoenix (Tolhurst et al. 2008) and Spark (Miller et al. 2015). These simulators take into account the description of model inputs (e.g. wind speed, fuel moisture, fuel type, slope steepness) as they vary across the landscape and can reduce the time taken to produce a detailed fire growth simulation when compared to manual methods involving graphs, tables and software applications (Rothermel 1983, 1991; Andrews et al. 2008; Plucinski et al. 2017; Taylor and Alexander 2018; Monedero et al. 2019).
Independent of the method used (i.e. manual drawing of fire spread vectors on a map vs. a computer-automated fire growth projection) and an agency’s investment in a trained cadre of fire behaviour analysts, there will be numerous instances, as alluded to above, where fires will escape initial attack and immediately threaten down-wind communities (Kissane 2010; Ramsey et al. 2012; Hawley et al. 2017; Nauslar et al. 2018). In such cases, there will typically be little time available for local resources to undertake a detailed prediction of fire spread and direction. Yet, an incident commander or fire controller still needs to be able to make quick and timely decisions in regard to the issuance of warnings to wildland firefighters and members of the general public in potentially affected communities (Cova et al. 2009).
For such wildfire emergencies, users require uncomplicated and quick-to-use rules (e.g. Butler and Cohen 1998; Cruz and Alexander 2014) or guidelines (e.g. Alexander and Fogarty 2002; Sharples et al. 2009). The use of fire behaviour rules of thumb has been a common practice in wildland fire management for many years now (e.g. Mitchell 1937; Arnold 1962; Chandler et al. 1983, p. 115; Terry 1993; Heikkilä et al. 2010; Jandt and Miller 2015). “Crossover”, for example, is a common fire behaviour rule of thumb used primarily in the boreal forest regions of Canada for identifying the threshold conditions for extreme fire behaviour. It occurs when the relative humidity is equal to or lower than the ambient air temperature in degrees Celsius (Janz 1989; Lawson and Armitage 2008). The “30-30-30” rule of thumb (i.e. situations where three conditions are met: ambient air temperature ≥ 30 °C, relative humidity ≤ 30% and open wind speed ≥ 30 km h−1) is increasingly being used around the world as an indicator of extreme fire behaviour potential (Steffens 2016). Sauvagnargues-Lesage et al. (2001) and Filippi et al. (2014) refer to the “three per cent model” used by firefighters in Southern France, indicating the spread rate of a fire to be 3% of the open wind speed.
By nature, a rule of thumb is a broadly applicable guide or principle based on experience or practice rather than theory. Rules of thumb can help guide decision-making when problems are too complex for a truly analytical solution in the time that is available (Kahneman 2011). Rules of thumb are certainly needed for the assessment of the potential for a wildfire to spread into peri-urban areas so that public safety messages and evacuation orders can be issued in a timely manner. The events associated with the 2009 Black Saturday fires in Victoria, Australia (Teague et al. 2010), are but one example of where a large number of random ignitions and rapid fire development very quickly overcame the capability of fire control and emergency service agencies to predict fire propagation and help keep local communities safe.
Analyses of experimental fire and wildfire data have shown wind speed to be the environmental variable that leads to the most significant changes in the rate of fire spread and intensity (Burrows 1994; Cheney et al. 1998, 2012). The effect of wind speed on the spread rate of a flame front is complex, integrating several interactions involving fuelbed characteristics, the vertical wind speed and gustiness profiles, and the energy output of the fire itself. Exploratory analysis of wildfire case study data carried out by Pimont et al. (2017), for example, suggests that under certain conditions, the rate of fire spread might be explained in large part by wind speed alone.
In the present paper, we investigate the possible existence and validity of a simple and scientifically credible rule of thumb for judging the effect of the 10-m open wind speed, a World Meteorological Organization (2008) standard for conducting surface wind measurements, on the spread rate of high-intensity wildfires in fire-prone forest and shrubland environments.
2 Methods
We relied on published wildfire case study data for our analysis. Alexander and Cruz (2006), Cheney et al. (2012) and Anderson et al. (2015) provide wildfire datasets used in the evaluation of their fire spread rate models, namely for crown fires in North America conifer forests, Australian dry eucalypt forests and temperate shrublands, respectively (Table 1). These compiled datasets are for the most part based on published wildfire case studies and include some of the most notorious wildfire events documented to date (e.g. Kiil and Grigel 1969; Simard et al. 1983; Cruz et al. 2012). The datasets include information on fuels, weather (10-m open wind speed, ambient air temperature, relative humidity), duration of the fire run(s) and the associated rate of fire spread on level or undulating topography. The duration of the fire runs was typically of the order of 1 h to 3 h. Fuel characteristics were nominally estimated from relevant studies, namely using time since fire as a proxy of fuel accumulation (e.g. Cheney et al. 2012) and assigning canopy bulk density values based on conifer forest fuel type (Alexander and Cruz 2006). Data in Cheney et al. (2012) and Anderson et al. (2015) also include a reliability score that ranks the reliability of the fuel, weather and fire behaviour data. For further detail, we recommend readers to consult the list of references in the aforementioned publications for the original wildfire data sources.
Linear regression analysis through ordinary least squares was used to establish a reference relationship between the forward rate of fire spread (R, km h−1) and the 10-m open wind speed (U10, km h−1). These results formed the basis for establishing a rule of thumb. Metrics such as the mean absolute error (MAE), the mean bias error (MBE) and the mean absolute percentage error (MAPE) were used to quantify the error (Willmott 1982; Mayer and Butler 1993; Cruz and Alexander 2013) associated with the proposed rule of thumb. We then contrasted the error statistics obtained with the rule of thumb with the statistics obtained with the fuel type–specific rate of fire spread models—i.e. Cruz et al. (2005) for the conifer forest crown fire data, Cheney et al. (2012) for the dry eucalypt forest data and Anderson et al. (2015) for the temperate shrubland data.
3 Results
Linear regression analysis (forced through the origin) of wind speed on the rate of fire spread, considering all data together, yielded a slope coefficient of 0.082 (p < 0.0001). Such a model resulted in a MAE of 0.95 km h−1 and a MAPE of 55%. The slope coefficient determined by dataset source was 0.084 (p < 0.0001), 0.081 (p < 0.0001) and 0.080 (p < 0.0001), for conifer forests, eucalypt forests and temperate shrublands, respectively. The consistency of these results suggests the rate of fire spread to be about 8% of the wind speed, independent of the fuel type. Because the calculation of 8% of a wind speed does not lend itself readily to mental arithmetic, we tested the use of a 10% value (Fig. 1). The 10% wind speed rule of thumb (i.e. the forward rate of fire spread is 10% of the average wind speed) resulted in a MAE of 1.11 km h−1, a MBE of 0.53 km h−1 and a MAPE of 74% (Fig. 2). What is relevant to such a simplistic model is not the overall error, but how the error is distributed, as the rule of thumb would be most relevant at the more extreme or severe end of the fire environment spectrum (i.e. dry fuels and high wind conditions) where the urgency of the situation requires swift decisions.
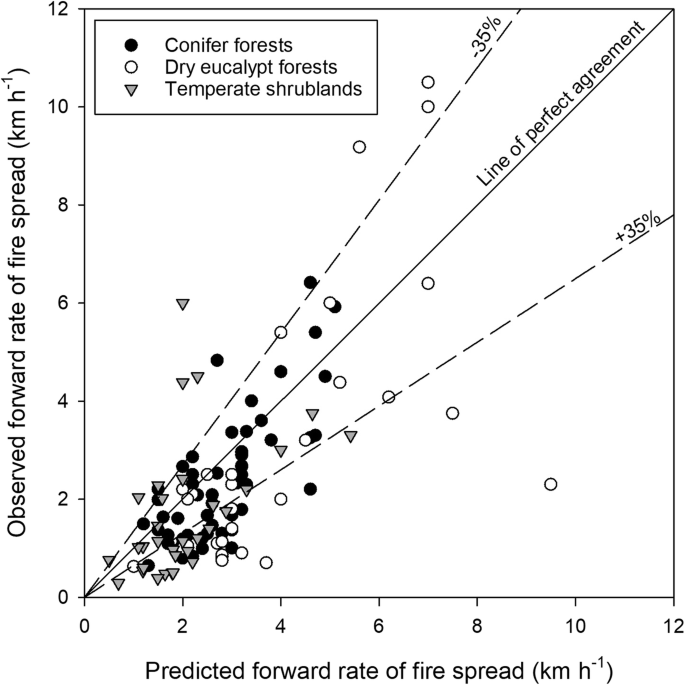
Observed wildfire rates of spread vs. predictions by the 10% wind speed rule of thumb for conifer forests (data from Alexander and Cruz 2006), dry eucalypt forests (data from Cheney et al. 2012) and temperate shrublands (data from Anderson et al. 2015). The dashed lines around the line of perfect agreement indicate the ± 35% error interval as per Cruz and Alexander (2013)
Figure 3a, b shows the variation of MBE and MAPE by rate of fire spread class (0 to 1.0, 1.0 to 2.0, etc.). For rates of fire spread between 1.0 and 6.0 km h−1, the class MBE varies between 1.0 and − 1.0 km h−1. This consistency of the class MBE, while the magnitude of the rate of fire spread increases, results in a notable decay in the MAPE (Fig. 3b). Noteworthy in Fig. 3a is the magnitude of the error for the three fastest spreading fires in dry eucalypt forests (MBE = − 3.5 km h−1). Although the error is large, its relative magnitude is acceptable, with the MAPE varying between 33 and 39%. The two data points with the highest spread rate (i.e. 10 km h−1 and 10.5 km h−1) were related to the effect of the post-frontal weather change on fire spread during the 1983 Ash Wednesday fires in Victoria, Australia (Rawson et al. 1983).
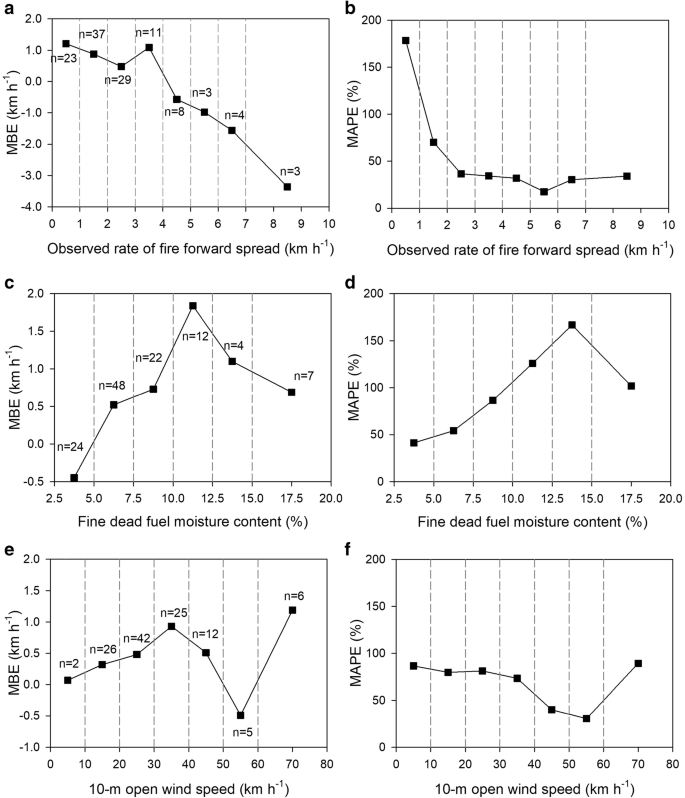
Plots of the mean bias error (MBE) and mean absolute percent error (MAPE) per a, b observed rate of fire spread class (1.0 km h−1 interval), c, d fine dead fuel moisture content (2.5% interval) and e, f 10-m open wind speed class (10 km h−1 interval). The number of observations per interval is given by n
The analysis of the MBE and percent residual with fine dead fuel moisture class shows the rule of thumb to work best for dry fuels. The MBE varied within the ± 0.5 km h−1 range for fine dead fuel moisture levels < 7.5% (Fig. 3c) but increased to about 1 km h−1 for fuel moistures above 10%. MAPE increased moderately with wind speeds up to a 50–60 km h−1 class, after which there was a sharp increase in the average residual. This increase is based on a few data points: the above-mentioned errors associated with a post-frontal change in fire dynamics during the 1983 Ash Wednesday conflagrations and two other wildfire runs in dry eucalypt forests burning under the influence of very high wind speeds (i.e. 75 km h−1 to 95 km h−1) but relatively high moisture conditions (Buckley 1992), resulting in relatively low rates of fire spread (2.3 km h−1 to 3.8 km h−1) for the prevailing wind speeds.
From the results above, we categorised the rule of thumb error statistics by considering a matrix with four sets of burning conditions: low (≤ 7.5%) vs. high (> 7.5%) fine dead fuel moisture content, and moderate (≤ 30 km h−1) vs. high (> 30 km h−1) wind speeds (Fig. 4). In this respect, we see the MBE and MAPE to be reduced in the dry fuel conditions, irrespective of the associated wind speeds. For these conditions, the MBE varies between 0.16 and 0.22 km h−1, and the MAPE varies between 42 and 54%. The highest errors obtained by the rule of thumb occur for the high fuel moisture/moderate wind speed combination. This condition is associated with the lowest average R (1.05 km h−1), the MAPE and MBE being 122% and 0.93 km h−1, respectively.
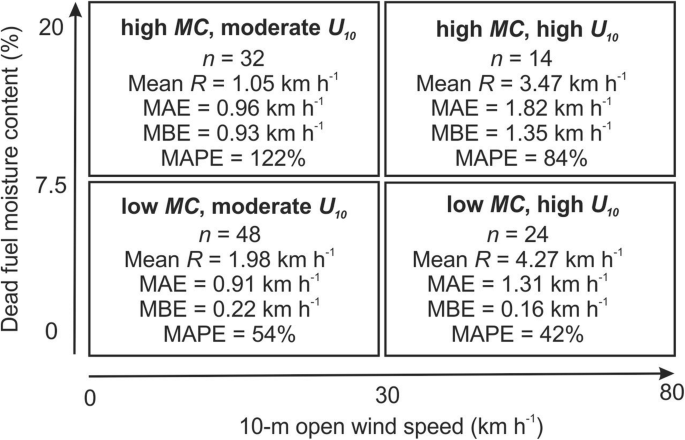
Variation in the mean forward rate of fire spread (R) and error statistics for the 10% wind speed rule of thumb per broad burning condition. MC is the fine dead fuel moisture content (low < 7.5%; high > 7.5%), U10 is the 10-m open wind speed (moderate < 30 km h−1; high > 30 km h−1), MAE is the mean absolute error, MBE is the mean bias error and MAPE is the mean absolute percent error
Table 2 provides the fit statistics when one applies fuel type–specific fire spread models to the three datasets used in developing the rule of thumb. In this analysis, the models are being evaluated against independent data (i.e. the wildfire data not used in their development), whereas for comparative purposes, it should be noted that the rule of thumb was informed, but not strictly fitted, by this data. Overall, bias and percent error were consistent for the conifer and dry eucalypt forest datasets, with a MBE of 0.4 km h−1 and a MAPE just above 50%. The error was lower for the temperate shrubland dataset, with a MBE of 0.1 km h−1 and a MAPE of 33%. Although these overall errors are lower than those obtained by the rule of thumb for the whole dataset, they are comparable to the rule errors for the low fuel moisture content situations. When contrasting the error statistics obtained with the rate of fire spread models and the rule of thumb by broad burning conditions, it is evident that the results are comparable to the low fuel moisture conditions (Fig. 5), with the MBE being substantially lower for the rule of thumb.
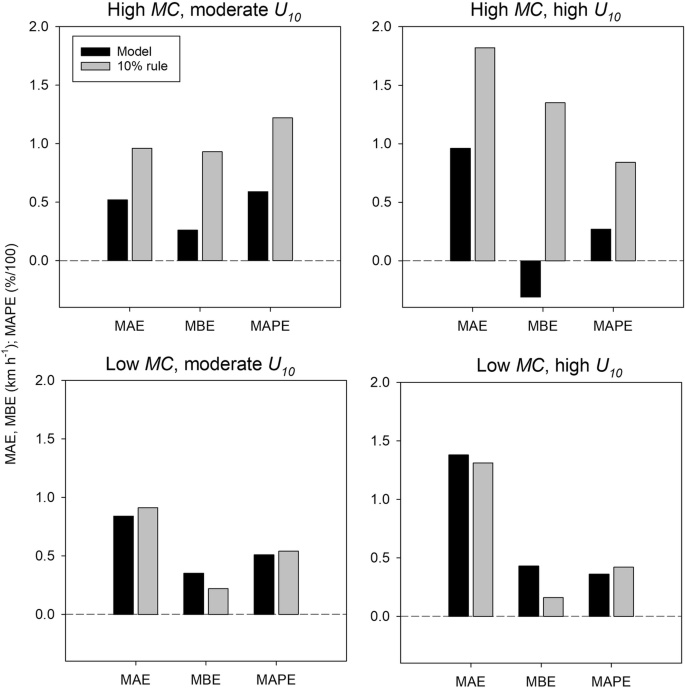
Comparison of model fit statistics between the 10% wind speed rule of thumb and fuel type–specific models for four sets of distinct burning conditions. MC is the fine dead fuel moisture content (low < 7.5%; high > 7.5%), U10 is the 10-m open wind speed (moderate < 30 km h−1; high > 30 km h−1), MAE is the mean absolute error, MBE is the mean bias error and MAPE is the mean absolute percent error
4 Discussion
Our analysis of published wildfire rate of spread data in forest and temperate shrubland fuel types revealed a simple rule of thumb to estimate the forward rate of fire spread (being approximately 10% of U10) with acceptable accuracy based on contrasting the error statistics with those from published fire spread model evaluation studies (Cruz and Alexander 2013). The rule of thumb assumes that both wind speed and rate of fire spread are expressed in the same units. Too often people trust rules of thumb as if they were certainties and fail to recognise when they should make an independent analytical decision. One should know enough about why a rule of thumb works to be able to predict when it will fail (Scott et al. 2014, p. 364).
The rule of thumb produced the lowest relative error for low fine dead fuel moisture content (i.e. MC < 7.5%) situations, with MAPE values varying between 54% for moderate wind speeds (i.e. U10 < 30 km h−1) and 42% for high wind speeds (i.e. U10 > 30 km h−1). These will typically characterise the environment associated with peak burning conditions. For such situations, the error statistics obtained by the rule of thumb were comparable with those obtained using fuel type–specific fire spread rate models. These results suggest that the rule of thumb works best for cases when it might be required. The rule of thumb performed poorly for higher fuel moisture content conditions (i.e. MC > 7.5%). In these situations, the errors statistics obtained for the rule of thumb were substantially higher than the ones obtained for the fire spread rate models.
These results can be somewhat counterintuitive, as it is commonly postulated (Rothermel 1991) that under the most severe fire weather situations (i.e. under critically dry fuel conditions and strong winds), wildfires can attain a level of fire behaviour that is unpredictable due to the high energy release rates and fire-atmosphere interactions (Werth et al. 2016). In such cases, errors obtained by the rule of thumb or fire spread rate models should be higher. However, this is not the case as the bias and relative error, expressed by the MBE and MAPE, respectively, are, in fact, smaller for the severe burning conditions. One possible explanation is that as the burning conditions shift towards the more severe side of the fire behaviour spectrum and the energy released increases, the overwhelming radiative and convective energy transfer fluxes reduce the influence that fuel characteristics and moisture content exert on the fire propagation processes. As the number of influential variables is reduced, presumably the predictability of the fire spread rate increases.
Our analysis used data from a broad range of fuel complex structures, namely temperate shrublands characterised by high fuel availability and relatively low fuelbed height (< 2 m), North America conifer forests with a broad range of surface fuel and canopy structures and Australian dry eucalypt forests characterised by their open structure and low canopy bulk densities. The results suggest that wind speed largely determines fire spread rates under dry fuel moisture conditions, irrespective of the fuel complex structure. These results are surprising not only because of the differences in fuel characteristics but also the mechanisms dominating the fire propagation process. In particular, fire propagation in dry eucalypt forests under low fuel moisture conditions is known to be largely influenced by the transport of firebrands and subsequent ignition of spot fire ignitions ahead of the main flame front (McArthur 1967; Cheney and Bary 1969). Although spotting behaviour is inherent to the fire spread rates in the three wildfire databases used in our analysis, the firebrand densities and travel distances observed in dry eucalypt forests are typically much greater (e.g. Hodgson 1968; Albini et al. 2012).
Spotting is a complex, multivariate process influenced by the fuel type (determining firebrand types and quantities), fuel moisture (controlling ignition probability), fire size and intensity (determining overall firebrand number, plume height and firebrand lofting height) and wind speed, namely its variation within the vertical profile of the atmosphere and its effect on firebrand horizontal travel distances (Koo et al. 2010; Albini et al. 2012; Martin and Hillen 2016). Under high wind and low fuel moisture conditions, spotting is expected to be present and strongly influences the overall fire propagation (Albini et al. 2012). Our analysis shows that wind speed alone is able to explain the variability in observed wildfire rates of fire spread to levels comparable to those observed in outdoor experimental fires—i.e. negligible bias, 40% < MAPE < 50% (Cruz and Alexander 2013). This dominant role played by wind speed emphasizes the importance of its accurate forecasting in the fire behaviour prediction process.
Care should be exercised in applying the rule of thumb to situations in which a weather change leads to a drastic change in wind speed and direction as observed with frontal passages over a fire, a somewhat common occurrence in south-eastern Australia during periods of extreme fire potential (McArthur 1967; Australian Bureau of Meteorology 1984). This process converts a fire’s eastern flank into a broad head fire and concurrently deposits numerous firebrands downwind in a north-easterly direction (Luke and McArthur 1978, p. 90), leading to a large increase in the burned area in a short time period. In such a situation, the overall movement of the flame front is largely a function of spot fires coalescing over a broad area, typically extending out over 5 km to 12 km, instead of the movement of a single flame front driven by the prevailing wind (McArthur 1967). This type of event is responsible for more than half of the documented fire-caused human fatalities in Australia (Blanchi et al. 2014), and in particular, those associated with the 1983 Ash Wednesday fires (Keeves and Douglas 1983; Rawson et al. 1983) and the 2009 Black Saturday fires (Teague et al. 2010) in southeastern Australia. The rule of thumb under-predicted by about 33% the two post-frontal change fires in the dry eucalypt forest fuel types used in the analysis. The particular concern about the use of the rule of thumb in these scenarios is not the relative error, which is somewhat acceptable, but its independence relative to the post-frontal wind speed, which makes the rule of thumb incapable of accurately capturing the extent of the post-frontal change in wildfire activity.
An obvious question is how well does the rule of thumb perform in fuel types distinctly different from the ones described in the methods and results. An analysis of wildfire data in Australian grasslands characterised by low dead fuel moisture contents (averaging 3.5%) published by Cheney et al. (1998) (n = 23) suggests an average R/U10 ratio of 0.25 (i.e. the forward rate of fire spread is approximately one quarter of the U10). Given such a large deviation, the 10% wind speed rule of thumb as developed here should not be applied to open grasslands.
One might also ask how applicable is the rule of thumb in estimating R in disease or insect-killed stands, a particularly important fire management issue in western North America (Page et al. 2015). Perrakis et al. (2014) showed that wildfires in the red stage of mountain pine beetle (MPB) (Dendroctonus ponderosae Hopkins) affected lodgepole pine (Pinus contorta Dougl. var. latifolia Engelm.) forests in British Columbia, Canada, to propagate 2.7 times faster than predicted by fire spread models for healthy stands. Analysis of the wildfire rate of spread data compiled by Perrakis et al. (2014) (n = 14; mean R = 1.4 km h−1) suggests an average R/U10 ratio of 0.12. The application of the 10% wind speed rule of thumb to this data resulted in a MAPE of 42% and a MBE of − 0.21 km h−1. Of the 14 wildfires, the rule of thumb under-predicted eight and over-predicted six, an almost equal partition. The data given in Perrakis et al. (2014) were in the high MC—moderate wind speed category. The performance of the rule of thumb in relation to these wildfires was better than that obtained against the main dataset, suggesting that at least for similar burning conditions, the rule of thumb is applicable to MPB-affected lodgepole pine forests in the red stage.
The use of the rule of thumb is acceptable not only for fires spreading on level to gently undulating topography but may also apply in cases of fires advancing across drainages with alternating upslope and downslope runs (e.g. Anderson 1968). As fire increases in size and spreads across multiple drainages, the surging (during upslope runs) and stalling (during downslope runs) are commonly assumed to average out to a flat ground condition (Rothermel 1991; Sullivan et al. 2014). The suitability of the rule of thumb in purely upslope or downslope fire runs is questionable, remains untested in our work and should be avoided.
The use of the rule of thumb requires the knowledge of the 10-m open wind speed. This wind speed is typically measured in the open (i.e. not being influenced by vegetation or man-made structures) and is averaged over a 10-min time interval (Lawson and Armitage 2008). In a forecasting sense, the rule of thumb should be used with the forecasted wind speed. In areas where the forecasted wind speed is not given at a 10-m open height, a correction can be applied. For example, it is customary to report wind speed for fire management applications in the USA at a height of 6.1 m in the open (Andrews 2012). A conversion for this wind speed into the 10-m one would require multiplying the former by 1.15 (Lawson and Armitage 2008). In the absence of forecasted wind speed and direction, the rule of thumb could be used with locally measured wind conditions. In cases where representative weather stations are not available, the use of a wind speed measured at an approximate eye-level height, as commonly used in fire operations, will require corrections for the vertical wind profile, taking into account the surrounding vegetation and location on the landscape (Rothermel 1983). The Beaufort wind scale (List 1951, p. 119) could also be used to estimate U10.
In practice, it is envisioned that an end-user would typically plot a fire spread direction arrow(s) on a map aligned in the direction of the prevailing wind (Rothermel 1983, 1991; Alexander and Fogarty 2002; Taylor and Alexander 2018). The length of the arrow, representing the fire’s forward spread distance, would be dictated by the projected rate of spread and the duration of the run. The shape and size of the fire could, in some cases, also be displayed, provided the wind direction remains relatively constant. A wind-driven fire typically adopts a roughly elliptical shape as defined by its length-to-breadth (L:B) ratio (Alexander and Cruz 2014). The L:B ratio is, in turn, a function of the wind speed (Taylor and Alexander 2018).
Comparison of the 10% wind speed rule of thumb against wildfire data showed that although the rule of thumb has value as a first approximation of a fire’s forward rate of spread under dry fuel conditions, irrespective of the forest or shrubland type, its use in higher, or marginal, fuel moisture conditions can lead to notable over-prediction bias. Although it is well understood that under-predictions can result in disastrous outcomes (Cheney 1981), over-predictions or the cautionary approach to inflate the level of risk as a safety precaution can lead to “warning fatigue” (Mackie 2013). Warning fatigue, or the “cry wolf syndrome”, can result in general mistrust of potentially life-saving future warnings.
The errors produced by the application of the rule of thumb against the wildfire data can be considered acceptable, given (1) the uncertainty in the wildfire data, namely related to the representativeness of weather data due to the distance between the weather station and the fire, and relative to the infrequent and opportunistic nature of fire behaviour observations, and (2) the error inherent to the prediction of fire spread associated with models that are simplified representations of a physical process (Alexander and Cruz 2013). Cruz and Alexander (2013) compiled the statistics from published fire spread model evaluation studies and came to the conclusion that an error within a ± 35% interval around the observation would constitute a reasonable standard for these models. The rule of thumb predicted close to this threshold for the low MC fires. Despite this adequacy, it should be noted that within each fire behaviour forecast scenario, the most accurate method to produce a fire spread prediction will be to use the most appropriate models for the situation, combined with situational awareness and direct observations of fire activity in the preceding time periods (Alexander and Cruz 2013).
5 Conclusions
We conducted an analysis of a large number of wildfire rate of spread observations documented in conifer forests, eucalypt forests and temperate shrublands to investigate the suitability of a simple rule of thumb that provides a first approximation of the rate of fire spread from wind speed alone. The analysis revealed the forward rate of fire spread to be roughly 10% of the average 10-m open wind speed, provided both are expressed in the same units (e.g. km h−1). This rule of thumb gives the most accurate results for dry fuel and high wind speed conditions with reduced bias and mean relative errors lower than 50%. Under these conditions, the error statistics are comparable to those obtained by fire spread rate models. The rule is not applicable to grasslands, but it was shown to work adequately for wildfires burning in some insect-killed forests. The rule of thumb is deemed applicable to fires spreading on level to undulating topography or across drainages with alternating upslope and downslope runs.
Data availability
The datasets generated and/or analysed during the current study are available as electronic supplementary material.
References
Albini FA (1976) Estimating wildfire behavior and effects. USDA Forest Service, Intermountain Forest and Range Experiment Station, General Technical Report INT-30, Ogden, UT, 92 p
Albini FA, Alexander ME, Cruz MG (2012) A mathematical model for predicting the maximum potential spotting distance from a crown fire. Int J Wildland Fire 21:609–627
Alexander ME, Cruz MG (2006) Evaluating a model for predicting active crown fire rate of spread using wildfire observations. Can J For Res 36:3015–3028
Alexander ME, Cruz MG (2013) Limitations on the accuracy of model predictions of wildland fire behaviour: a state-of-the-knowledge overview. For Chron 89:370–381
Alexander ME, Cruz MG (2014) The elliptical shape and size of wind-driven crown fires. Fire Manag Today 73(4):28–33
Alexander ME, Fogarty LG (2002) A pocket card for predicting fire behaviour in grasslands under severe burning conditions. Natural Resources Canada, Canadian Forest Service, Forest Research and National Rural Fire Authority, Fire Technology Transfer Note 25, Ottawa, ON, Rotorua, NZ and Wellington, NZ, 8 p
Alexander ME, Mutch RW, Davis KM, Bucks CM (2017) Wildland fires: dangers and survival. Auerbach’s Wilderness Medicine, Volume 1, 7th edition, pp. 276–318. Edited by P.S. Auerbach. Elsevier, Philadelphia
Alexander ME, Thorburn WR (2015) LACES: adding an “A” for Anchor point(s) to the LCES wildland firefighter safety system. Current International Perspectives on Wildland Fires, Mankind and the Environment. pp. 121–144. Edited by B Leblon and ME Alexander. Nova Science Publishers Inc, Hauppauge, NY
Anderson HE (1968) Sundance Fire: an analysis of fire phenomena. USDA Forest Service, Intermountain Forest and Range Experiment Station, Research Paper INT-56, Ogden, UT, 39 p
Anderson WR, Cruz MG, Fernandes PM, McCaw L, Vega JA, Bradstock RA, Fogarty L, Gould J, McCarthy G, Marsden-Smedley JB, Matthews S, Mattingley G, Pearce HG, van Wilgen BW (2015) A generic, empirical-based model for predicting rate of fire spread in shrublands. Int J Wildland Fire 24:443–460
Andrews PL (2012) Modeling wind adjustment factor and midflame wind speed for Rothermel’s surface fire spread model. USDA Forest Service, Rocky Mountain Research Station, General Technical Report RMRS-GTR-266, Fort Collins, CO, 39 p
Andrews PL, Bevins CD, Seli RC (2008) BehavePlus fire modeling system, version 4.0: user’s guide. USDA Forest Service, Rocky Mountain Research Station, General Technical Report RMRS-GTR-106WWW, Ogden, UT, 116 p
Arnold RK (1962) Rules for outdoor fires. Firemen 29(8):22
Australian Bureau of Meteorology (1984) Report on the meteorological aspects of the Ash Wednesday fires—16 February 1983. Australian Government Publishing Service, Canberra, ACT, 143 p
Blanchi R, Leonard J, Haynes K, Opie K, James M, Oliveira FD (2014) Environmental circumstances surrounding bushfire fatalities in Australia 1901–2011. Environ Sci Policy 37:192–203
Buckley AJ (1992) Fire behaviour and fuel reduction burning: Bemm River wildfire, October 1988. Aust For 55:135–147
Burrows ND (1994) Experimental development of a fire management model for jarrah (Eucalyptus marginata Donn ex Sm.) forest. PhD thesis, Australian National University, Canberra, ACT, 293 p
Butler BW, Cohen JD (1998) Firefighter safety zones: how big is big enough? Fire Manag Notes 58(1):13–16
Chandler C, Cheney P, Thomas P, Trabaud L, Williams D (1983) Fire in forestry. Volume I: forest fire behavior and effects. Wiley, New York, NY, 450 p
Cheney NP (1981) Fire behaviour. Fire and the Australian biota. pp. 151–175. Edited by A.M. Gill, R.H. Groves and I.R. Noble. Australian Academy of Science, Canberra, ACT
Cheney NP, Bary GAV (1969) The propagation of mass conflagrations in a standing eucalypt forest by the spotting process. In Collected papers of mass fire symposium, Volume I. Paper A6. Commonwealth of Australia, Defence Standards Laboratory: Melbourne, VIC, 18 p
Cheney NP, Gould JS, Catchpole WR (1998) Prediction of fire spread in grasslands. Int J Wildland Fire 8:1-15
Cheney NP, Gould JS, McCaw WL, Anderson WR (2012) Predicting fire behaviour in dry eucalypt forest in southern Australia. For Ecol Manag 280:120–131
Cova TJ, Dennison PE, Kim TH, Moritz MA (2005) Setting wildfire evacuation trigger points using fire spread modeling and GIS. TransGIS 9:603–617
Cova TJ, Drews FA, Siebeneck LK, Musters A (2009) Protective actions in wildfires: evacuate or shelter-in-place? Nat Hazards Rev 10:151–162
Cruz MG, Alexander ME (2013) Uncertainty associated with model predictions of surface and crown fire rates of spread. Environ Model Softw 47:16–28
Cruz MG, Alexander ME (2014) The start, propagation, and spread rate of crown fires. Fire Manag Today 73(4):17–23
Cruz MG, Alexander ME, Wakimoto RH (2005) Development and testing of models for predicting crown fire rate of spread in conifer forest stands. Can J For Res 35:1626–1639
Cruz MG, Gould JS, Alexander ME, Sullivan AL, McCaw WL, Matthews S (2015) A guide to rate of fire spread models for Australian vegetation. Revised edition. CSIRO Land and Water Flagship and Australasia Fire Authorities Council, Canberra, ACT and Melbourne, VIC, 123 p
Cruz MG, Sullivan AL, Gould JS, Sims NC, Bannister HJJ, Hurley R (2012) Anatomy of a catastrophic wildfire: the Black Saturday Kilmore East Fire. For Ecol Manag 284:269–285
Filippi J-B, Mallet V, Nader B (2014) Representation and evaluation of wildfire propagation simulation. Int J Wildland Fire 23:46–57
Finney MA (2004) FARSITE: Fire area simulator—model development and evaluation. USDA Forest Service, Rocky Mountain Research Station, Research Paper RMRS-RP-4 Revised, Ogden, UT, 47 p
Harris S, Anderson W, Kilinc M, Fogarty L (2012) The relationship between fire behaviour measures and community loss: an exploratory analysis for developing a bushfire severity scale. Nat Hazards 63:391–415
Hawley J, Hurley G, Sackett S (2017) Into the fire: the fight to save Fort McMurray. McClelland & Stewart – Penguin Random House Canada, Toronto, ON, 148 p
Heikkilä TV, Grönqvist R, Jurvélius M (2010) Wildland fire management handbook for trainers. Food and Agriculture Organization of the United Nations, Rome, IT, 248 p
Hodgson A (1968) Control burning in eucalypt forests in Victoria, Australia. J For 66:601–605
Jandt R, Miller E (2015) What is the moisture content of standing dead grass? Alaska Fire Science Consortium, AFSC Research Brief 2015-1, Fairbanks, AK, 1 p
Janz B (1989) The fire weather report—what does it tell us? Proceedings of the fifth Central Region Fire Weather Committee Scientific and Technical Seminar, April 6, 1988, Winnipeg, MB. pp. 41-47. Compiled and Edited by W.J. De Groot. Forestry Canada, Northwest Region, Saskatchewan District Office, Study NOR-36-03-04 File Report No. 1, Prince Albert, SK.
Kahneman D (2011) Thinking, fast and slow. Farrar, Straus and Giroux, New York, NY, 418 p
Keeves A, Douglas DR (1983) Forest fires in South Australia on 16 February 1983 and consequent future forest management aims. Aust For 46:148–162
Kiil AD, Grigel JE (1969) The May 1968 forest conflagrations in central Alberta—a review of fire weather, fuels and fire behavior. Canada Department of Fisheries and Forestry, Forestry Branch, Forest Research Laboratory, Information Report A-X-24, Calgary, AB, 36 p
Kissane K (2010) Worst of days: inside the Black Saturday firestorm. Hachette Australia, Sydney, NSW, 316 p
Koo E, Pagni PJ, Weise DR, Woycheese JP (2010) Firebrands and spotting ignition in large-scale fires. Int J Wildland Fire 19:818–843
Lawson BD, Armitage OB (2008) Weather guide for the Canadian Forest Fire Danger Rating System. Natural Resources Canada, Canadian Forest Service, Northern Forestry Centre, Edmonton, AB, 73 p
List RJ (1951) Smithsonian meteorological tables. 6th rev. edn. Smithsonian Institute Press, Washington DC, 527 p
Luke RH, McArthur AG (1978) Bushfires in Australia. Australian Government Publishing Service, Canberra, ACT, 359 p
Mackie B (2013) Warning fatigue: insights from the Australian bushfire context. PhD thesis, University of Canterbury, Christchurch, NZ, 294 p
Martin J, Hillen T (2016) The spotting distribution of wildfires. Appl Sci 6:177 34 p
Mayer DG, Butler DG (1993) Statistical validation. Ecol Model 68:21–32
McArthur AG (1967) Fire behaviour in eucalypt forests. Commonwealth Department of National Development, Forestry and Timber Bureau, Leaflet 107, Canberra, ACT, 36 p
Miller C, Hilton J, Sullivan A, Prakash M (2015) SPARK—a bushfire spread prediction tool. Environmental software systems. Infrastructures, services and applications. ISESS 2015. pp. 262–271. In: Edited by R. Denzer, R.M. Argent, G. Schimak and J Hřebíček. IFIP advances in information and communication technology, Volume 448. Springer, Cham
Mitchell JA (1937) Rule of thumb for determining rate of spread. Fire Control Notes 1:395–396
Monedero S, Ramirez J, Cardil A (2019) Predicting fire spread and behaviour on the fireline. Wildfire analyst pocket: a mobile app for wildland fire prediction. Ecol Model 392:103–107
Nauslar NJ, Abatzoglou JT, Marsh PT (2018) The 2017 North Bay and Southern California fires: a case study. Fire 1:18 17 p
Neale T, May D (2018) Bushfire simulators and analysis in Australia: insights into an emerging sociotechnical practice. Environ Hazards 17:200–218
Page WG, Alexander ME, Jenkins MJ (2015) Effects of bark beetle attack on canopy fuel flammability and crown fire potential in lodgepole pine and Engelmann spruce forests. Proceedings of the Large Fire Conference, May 19–23, 2014, Conference, May 19–23, 2014, Conference, May 19–23, 2014, Missoula, MT. pp. 174-180. In: Edited by R.E. Keane, M. Jolly, R. Parsons and K. Riley. USDA Forest Service, Rocky Mountain Research Station. Proceedings RMRS-P-73, Fort Collins, CO
Perrakis DDB, Lanoville RA, Taylor SW, Hicks D (2014) Modeling wildfire spread in mountain beetle-affected forest stands, British Columbia, Canada. Fire Ecol 10(2):10–35
Pimont F, Dupuy JL, Linn RR, Parsons R, Martin-StPaul N (2017) Representativeness of wind measurements in fire experiments: lessons learned from large-eddy simulations in a homogeneous forest. Agric For Meteorol 232:479–488
Plucinski MP, Sullivan AL, Rucinski CJ, Prakash M (2017) Improving the reliability and utility of operational bushfire behaviour predictions in Australian vegetation. Environ Model Softw 91:1–12
Ramsey L, Ramsey N, McWilliams J, Kristoff MJ (2012) The sky was on fire—Slave Lake’s story of disaster, exodus, and new beginnings. Slave Lake Book Committee: Slave Lake, AB, 300 p
Rawson RP, Billing PR, Duncan SF (1983) The 1982-83 forest fires in Victoria. Aust For 46:163–172
Rothermel RC (1972) A mathematical model for predicting fire spread in wildland fuels. USDA Forest Service, Intermountain Forest and Range Experiment Station, Research Paper INT-115, Ogden, UT, 40 p
Rothermel RC (1983) How to predict the spread and intensity of forest and range fires. USDA Forest Service, Intermountain Forest and Range Experiment Station, General Technical Report INT-143, Ogden, UT, 161 p
Rothermel RC (1991) Predicting behavior and size of crown fires in the Northern Rocky Mountains. USDA Forest Service, Intermountain Research Station, Research Paper INT-438, Ogden, UT, 46 p
Sauvagnargues-Lesage S, Dusserre G, Robert F, Dray G, Pearson DW (2001) Experimental validation in Mediterranean shrub fuels of seven wildland fire rate of spread models. Int J Wildland Fire 10:15–22
Scott AC, Bowman DMJS, Bond WJ, Pyne SJ, Alexander ME (2014) Fire on Earth: an introduction. Wiley-Blackwell, Chichester, UK, 413 p
Sharples JJ, McRae RHD, Weber RO, Gill AM (2009) A simple index for assessing fuel moisture content. Environ Model Softw 24:637–646
Simard AJ, Haines DA, Blank RW, Frost JS (1983) The Mack Lake Fire. USDA Forest Service, North Central Forest Experiment Station, General Technical Report NC-83, St. Paul, MN, 36 p
Steffens R (2016) When fire burns, are we prepared? Wildfire 25(3):8
Sullivan AL, Sharples JJ, Matthews S, Plucinski MP (2014) A downslope fire spread correction factor based on landscape-scale fire behaviour. Environ Model Softw 62:153–163
Taylor SW, Alexander ME (2018) Field guide to the Canadian Forest Fire Behavior Prediction (FBP) System. 3rd edn. Natural Resources Canada, Canadian Forest Service, Northern Forestry Centre, Special Report 11, Edmonton, AB, 101 p
Teague B, McLeod R, Pascoe S (2010) 2009 Victorian Bushfires Royal Commission: final report summary. Government Printer for the State of Victoria, Melbourne, VIC, 42 p
Terry B (1993) Fire behavior rules of thumb. Update on the Rural Community Fire Protection Program, Fire Control Department. Texas Forest Service 5(1):2
Tolhurst K, Shields B, Chong D (2008) Phoenix: development and application of a bushfire risk management tool. Aust J Emerg Manag 23:47–54
Tymstra C, Bryce RW, Wotton BM, Taylor SW, Armitage OB (2010) Development and structure of Prometheus: the Canadian wildland fire growth simulation model. Natural Resources Canada, Canadian Forest Service, Northern Forestry Centre, Information Report NOR-X-417, Edmonton, AB, 88 p
Van Wagner CE (1973) Rough prediction of fire spread rates by fuel types. Environment Canada, Canadian Forestry Service, Petawawa Forest Experiment Station, Information Report PS-X-42, Chalk River, ON, 5 p
Werth PA, Potter BE, Alexander ME, Cruz MG, Clements CB, Finney MA, Forthofer JM, Goodrick SL, Hoffman C, Jolly WM, McAllister SS, Ottmar RD, Parsons RA (2016) Synthesis of knowledge of extreme fire behavior: volume 2 for fire behavior specialists, researchers, and meteorologists. USDA Forest Service, Pacific Northwest Research Station, General Technical Report PNW-GTR-891, Portland, OR, 258 p
Willmott CJ (1982) Comments on the evaluation of model performance. Bull Am Meteorol Soc 63:1309–1313
World Meteorological Organization (2008) Guide to meteorological instruments and methods of observation. 7th edn. World Meteorological Organization, WMO-No. 8, Geneva, CH, 611 p
Acknowledgements
The authors appreciate the comments received from Kelsy Gibos, Dana Hicks, Dave Marek, Brian McIntosh, Wesley Page, Matt Plucinski, Dave Thomas and the two anonymous reviewers on an earlier draft of this paper. This study was carried out in the framework of the BONFIRE (gloBal-scale analysis and mOdelliNg of FIRE behaviour potential) project (PTDC/AAG-MAA/2656/2014), funded by the Portuguese Foundation for Science and Technology (FCT) and the European Regional Development Fund (ERDF) through COMPETE 2020—Operational Program for Competitiveness and Internationalization (POCI).
Contribution of the co-authors
MGC and MEA contributed equally to the analysis and writing.
Author information
Authors and Affiliations
Corresponding author
Ethics declarations
Conflict of interest
The authors declare that they have no conflicts of interest.
Additional information
Handling Editor: Paulo Fernandes
Publisher’s note
Springer Nature remains neutral with regard to jurisdictional claims in published maps and institutional affiliations.
Electronic supplementary material
ESM 1
(XLSX 18.4 kb)
Rights and permissions
About this article

Cite this article
Cruz, M.G., Alexander, M.E. The 10% wind speed rule of thumb for estimating a wildfire’s forward rate of spread in forests and shrublands. Annals of Forest Science 76, 44 (2019). https://doi.org/10.1007/s13595-019-0829-8
Received:
Accepted:
Published:
DOI: https://doi.org/10.1007/s13595-019-0829-8