
Abstract
Aceclofenac (ACE) is a drug that was precisely devised to circumvent the shortcomings associated with diclofenac. However, ACE too corresponds to nonsteroidal anti-inflammatory drug (NSAID)-related adverse effects, but with a lower amplitude. The present investigation seeks to develop liposomes loaded with ACE adopting a central composite design (CCD) and formulate a chitosan-based hydrogel for synergistic anti-inflammatory efficacy and improved ACE dermal administration. On the basis of preliminary vesicle size, Poly Dispersity Index (PDI), and drug entrapment, the composition of lipid, cholesterol, and vitamin E TPGS were chosen as independent variables. The formulation composition met the specifications for an optimum liposomal formulation, with total lipid concentration (13.5% w/w), cholesterol concentration (10% w/w), and surfactant concentration (2% w/w). With particle size and PDI of 174.22 ± 5.46 nm and 0.285 ± 0.01 respectively, the optimised formulation achieved an entrapment effectiveness of 92.08 ± 3.56%. Based on the CCD design, the optimised formulation Acec-Lipo opt was chosen and was subsequently transformed to a chitosan-based gel formulation for in vitro drug release, penetration through the skin, in vivo analgesic therapeutic activity, and skin irritation testing. % age oedema inhibition was found to be greatest with the Acec-Lipo opt gel formulation, followed by Acec gel. These results reinforce the notion that the inclusion of chitosan resulted in a synergistic effect despite the same strength of the drug. The findings suggested that Acec-Lipo incorporated in chitosan gel for skin targeting might be an effective formulation for topical ACE administration in clinical subjects.
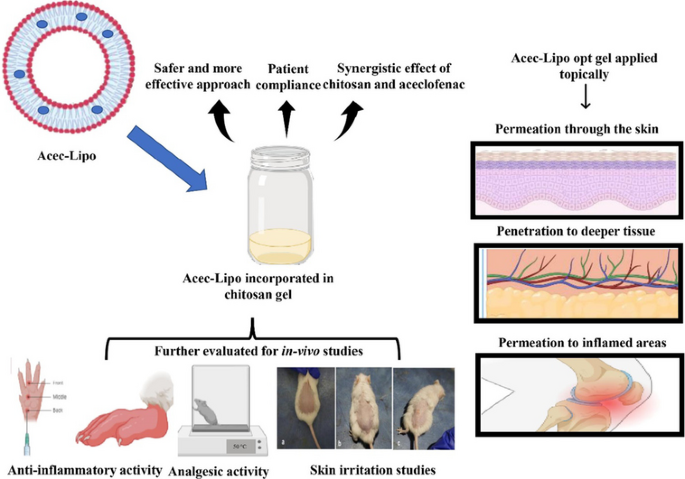
Graphical abstract
Introduction
Nonsteroidal anti-inflammatory drugs (NSAIDs) are the principal treatment for inflammation and discomfort caused by musculoskeletal diseases and injuries (e.g. ankylosing spondylitis, osteoarthritis). Despite the fact that NSAIDs have therapeutic efficacy when administered orally, numerous individuals incur tolerance concerns, including GI discomfort and significant cardiovascular and renal complications. To improve tolerance and safety, topical preparations have been considered to administer drugs Trans dermally directly beneath the tissue while lessening systemic exposure [1]. ACE, a NSAID that has anti-inflammatory and antipyretic characteristics, is primarily employed for alleviating acute pain as well as a variety of anti-inflammatory disorders such as osteoarthritis and rheumatoid arthritis. Due to the significant first-pass metabolism, it has a short half-life of 2–4 h. It fits into the Biopharmaceutics Classification System (BCS)-II family of drugs and has poor aqueous solubility. ACE suppresses the fabrication of inflammatory cytokines such as tumour necrosis factor-α (TNF-α), prostaglandin E2 (PGE2), and interleukin-1beta (IL-1beta). It dampens PGE2 production by inhibiting COX-1 and COX-2, which subsequently transforms intracellularly to diclofenac and 40-hydroxy aceclofenac [2]. Several researches have been conducted with the aim of overcoming the obstacles associated with gastric irritation and ulcers. ACE therapeutic effectiveness and mitigating adverse effects have been observed to reduce with different formulations. As a consequence, the pharmacokinetic and pharmacodynamic activities were significantly affected [3].
The key challenge with designing a viable topical NSAIDs formulation is that it should enable swift drug permeation through the stratum corneum. The skin’s primary protective barrier (outermost layer) is composed of distinct layers (10–20) of cornified cells encased within a hydrophobic lipid-protein matrix. Drug attributes (e.g. hydrophilic or hydrophobic, molecular weight), the use of permeation enhancers, and formulation properties encompassed all component attributes that govern the degree of drug permeation. Liposomal compositions have been developed as one way to improve topical absorption [4]. Liposomes being microscopic, spherical vesicles comprising a phospholipid concentric layer (with one or more layers) facilitate drug transport across or into the skin. As they enclose one another, a lipid bilayer forms an aqueous core. These are designed to deliver drugs to the desired location due to their capacity to integrate hydrophobic and lyophobic molecules, biodegradability, compatibility, and improved solubility of the incorporated drug. To increase the rigidity of vesicles, enhance bilayer characteristics, and stabilise the vesicular membrane, cholesterol is added in liposomal preparation along with phospholipids. Liposomes have emerged as a viable drug delivery device for enhancing several drug penetration flows through the biological membrane [5]. In the administration of drugs, vitamin E TPGS can be deployed as a solubiliser, enhancer of absorption and permeation, emulsifier, and surface stabiliser. This appears to be extensively employed to facilitate the manufacture of nanomedicines or other formulations for a variety of pharmaceuticals that are poorly water-soluble or permeable, notably those designated as BCS classes II and IV. As a surfactant, vitamin E TPGS demonstrates the exceptional potential to improve medication absorption across various biological barriers [6].
Chitosan is a feasible anti-inflammatory carrier for topical administration, and its incorporation in ACE-loaded liposomes is assumed to have a synergistic impact on the inflammatory region. Chitosan’s properties, such as nontoxicity, biodegradability, biocompatibility, anti-inflammatory, antioxidant, anti-microbial, and gel-formation [7], validate chitosan as an ideal vehicle for topical drug delivery to demonstrate anti-inflammatory action and draw therapeutic mileage alongside ACE.
The belief of quality by design (QbD) has got a lot of attention as a technique in pharmaceutical production for producing goods utilising a science and risk-based approach. The development of the formulation on the basis of design relies on QbD that leads to the best outcomes in terms of composition and other critical parameters [8]. The design of the experiment approach to optimisation provides a strategy for developing an optimised formulation [9, 10]. Design space (DS) is an important tool for studying the manufacturing process of liposomes since it is a fundamental component of the QbD concept. The DS is an operating zone where combinations of operational variables result in the required product critical quality attributes (CQAs), according to process knowledge [11]. The current study was designed to evaluate the therapeutic potential of topical ACE-loaded liposomes (Acec-Lipo) based on CCD. Design Expert software was utilised for the optimisation process [12]. The optimised liposomal formulation incorporating ACE was developed using conventional thin film hydration method and as per the composition of ingredients given by the design Expert software. Further to provide a localised action, it was incorporated in the chitosan-based gel formulation. The synergistic anti-inflammatory effect was expected from the same. Acec-Lipo opt gel was developed from the optimised formulation Acec-Lipo opt and tested for gel characteristics, skin permeation, anti-inflammatory, and anti-nociceptive activity [13]. Till date, no carrier-based formulation of ACE in chitosan gel has been reported for achieving better analgesic and anti-inflammatory effect on skin.
Thus, it was hypothesised to prepare carrier-based formulations of ACE embedded in chitosan gel base for topical administration to impart a safe and sustained drug release profile, better bioavailability, and reduced skin irritation.
Material and methods
Materials
ACE and soy lecithin (30%) were obtained from Himedia Laboratories Pvt. Ltd., Mumbai, and SRL Laboratories, Mumbai, respectively. Chitosan (low molecular weight) was obtained from Himedia Laboratories Pvt. Ltd., Mumbai. Cholesterol was acquired from Loba Chemie, Mumbai. Vitamin E TPGS was obtained from Souvenier Chemical, Mumbai. Dialysis membrane was obtained from HiMedia Laboratories Pvt. Ltd., Mumbai. The remaining chemicals and reagents were of analytical reagent (AR) grade.
Methodology
The conventional thin film hydration approach was employed to develop a liposomal formulation of ACE. Weighed quantity of ACE, soy lecithin, extra pure cholesterol, and vitamin E TPGS (biodegradable surfactant) were put in a round bottom flask (RBF), and an adequate amount of chloroform was poured in to amalgamate the components. Following whirling the RBF for 30–40 min at 50 °C in the rotary evaporator’s water bath, a thin layer of the incorporated components accumulated inside the RBF. The spinning was done under a 400–500 mm Hg vacuum. After the thin film had dried, the hydrating medium (10% ethanolic solution with phosphate buffer saline pH 6.8) was introduced, and the deposited layer in RBF was rotated for 20 min to hydrate. Finally, a liquid vesicular preparation was devised and kept in the refrigerator for future usage [14].
Optimisation via CCD
CCD is one of the most suitable RSM designs, consisting of factorial and axial points as well as at least one point in the centre of the experimental region that gives qualities such as orthogonality and rotatability for fitting quadratic polynomials. These points are excellent for obtaining comprehensive information about reactions with the fewest amount of studies. Further, CCD has been effectively employed in various studies for the fabrication and optimisation of formulations, and the data gathered with CCD indicated good and legit predictions [15]. A 33 CCD strategy was implemented to optimise the Acec-Lipo; the distinct dependent and independent parameters employed for the formulation [16] are illustrated in Table 1. Table 2 depicts the dependent variables (low and high) for the 20 experimental compositions. Emzploying the point prediction approach, the optimised ACE liposomes (Acec-Lipo opt) were ultimately selected based on the highest entrapment efficiency, minimal particle size, and ideal PDI value.
PDI and vesicle size
Implementing the diffraction light scattering approach, a zeta sizer (Beckman Coulter, Delsa Nano C, USA) was employed for assessing the PDI and vesicle size of the liposomes incorporating formulation. A helium laser had been employed as the light source with a detector angle of 90°, at a temperature of 25 ± 0.5 °C, and scattering was recorded. Particle size was determined after 100-fold dilution of the liposomal solution in phosphate buffer saline (PBS) pH 6.8. About 3 mL of diluted sample was put into a cuvette for the measurement of particle size and PDI, and no bubbles were present to ensure accurate readings [17].
Entrapment efficiency and drug content
The ultracentrifugation methodology was implemented for assessing the entrapment efficiency of an ACE liposomal formulation. To extract free ACE from liposomes, the component was centrifuged for 25 min at 14,000 rpm in an “ultracentrifuge” (Remi Instruments, Mumbai, India). The drug concentration in each formulation was estimated adopting a UV spectrophotometer (Shimadzu, UV-1900i, Kyoto, Japan) after diluting the free ACE in the supernatant. The proportion of drug entrapment was estimated using the formula below [18]:
while the proportion of drug content was computed using the formula below:
Surface morphology
High-resolution transmission electron microscopy (JEM 2100 plus, JOEL, Japan) with point resolution of 0.19 nm, an accelerating voltage of 80 to 300 kV, and magnification up to 1,500,000 was adopted to investigate the surface morphology of the optimised ACE-loaded liposomes. The instrument was configured to execute at 100 µA beam current and 200 kV accelerating voltage. The optimised liposomal preparation was diluted up to ten times with distilled water before being dried on a carbon-coated copper grid [14].
Differential scanning calorimetry (DSC) for thermal analysis
The DSC (Perkin Elmer 6000, MA, USA) scrutiny was implemented to investigate the dearth of prospective associations among its components of the liposomal preparation and ACE. Thermal analysis of liposomal samples was employed to estimate the probabilities of an association among the ACE, phospholipid, cholesterol, and surfactant and to calculate the enthalpy along with melting point of the liposomal formulation. DSC analysis was conducted on a 5 mg sample put in an aluminium pan under a nitrogen flow rate of 60 mL/min and a heating rate of 5 °C/min from 20 to 400 °C. On the reference platform, an empty aluminium pan was placed [19].
Chitosan-based hydrogel preparation
ACE chitosan hydrogel formulation was devised in two sections. The first phase was to develop and characterise ACE liposomal compositions. Chitosan hydrogel was fabricated and customised in the second stage. Finally, the optimised hydrogel system was blended with the Acec-Lipo opt to create the final formulation.
To develop a gel base with proper quantities of low molecular weight chitosan, 2% w/v of chitosan was dispersed in 0.5% v/v glacial acetic acid. The gel dispersion was kept for 3–4 h to allow it to disperse properly followed by stirring for 3 h at room temperature using a mechanical stirrer set at 1500–2000 rpm. The inclusion of triethanolamine (about 200 µL) in the formulation assisted in raising the pH to 7 [20]. Methylparaben was dissolved in propylene glycol and mixed into the gel base. The gel was then homogenised using a homogeniser for 10 min at 500 rpm. Following this, the optimised liposomal formulation was mixed with a blank chitosan base to develop Acec-Lipo opt gel [21, 22].
pH and homogeneity
The optimised gel base was assessed on factors such as colour, clarity, and transparency. To determine purity, any particle contamination was examined. Various smears were made on glass slides, and exterior particles or grittiness were seen using a microscope. The pH of the optimised Acec-Lipo opt gel was assessed employing a digital pH metre (Mettler Tolledo, Japan). A particular amount of the optimised gel was put in a beaker and analysed for pH with the probe inserted [23].
Spreadability
The spreadability had been assessed implementing the gel’s slip and drag properties. A refined apparatus comprised of two glass slides, one with the bottom end hooked onto a wooden plate and the other end with a hook attached to a balance. The sample gel (1 g) was positioned between two glass slides, and the top plate was pressed. The alteration in spread diameter caused by spreading the gel by putting on weight was observed (n = 3). The spreadability was computed using the formula below [24]:
where W specifies the amount of mass in the pan (g), ‘L’ refers to the set length traversed by the glass slide, ‘t’ the duration (s) required to entirely disintegrate the slides, and S represents the spreadability (g/s).
Texture profile analysis
The Acec-Lipo opt gel’s texture was evaluated employing numerous textural characteristics, including hardness/firmness, and adhesiveness. To reduce early test triggering, the Acec-lipo opt gel formulation was placed in a female cone. Further, the testing interface remained as flat as feasible. The sample being analysed was placed in with caution to avert a build-up of air bubbles. The automated CT3 Texture Analyser (Brookfield Engineering Laboratories, USA) by TA15/100 and TA-BT-KIT was implemented to determine the texture profile [25] like adhesiveness, springiness, and hardness from the resulting load temperature curves.
In vitro drug release study
Loading the devised gel compositions and commercialised gel into immersion cells led to drug release study. The dialysis membrane served as a barrier between the gel and the receptor fluid media, which entailed 150 mL of PBS (pH 6.8) kept at 37 ± 0.5 °C and agitated at 50 rpm. During the trials, aliquots of 5 mL were amputated at 0.25-, 0.5-, 0.75-, 1-, 2-, 4-, 6-, 8-, 12-, and 24-h intervals and replenished with an equivalent quantity of buffer. Each composition was tested for three times. Spectrophotometric analysis at 274 nm was used to quantify the drug concentration in the aliquots [26, 27]. To analyse the release mechanism, the modified ACE gel drug release data has been applied to an array of kinetic models.
Permeation study
Excised goat skin was immersed for 24 h in immersion cells (2 cm2 surface area) for the permeation investigation. The hair was removed from the outermost layer of skin and put within the donor region of the diffusion cell and the receptor compartment, which consisted of 150 mL of PBS (pH 6.8) kept at 37 ± 0.5 °C and agitated at 50 rpm. Both Acec-Lipo opt gel and Acec Gel (control) were placed in the donor compartment. Aliquots (5 mL) were removed and replenished with an equivalent quantity of fresh PBS (pH 6.8) at 0.25-, 0.5-, 0.75-, 1-, 2-, 4-, 6-, 8-, 12-, and 24-h intervals [26, 27]. Spectrophotometric analysis at 274 nm was used to quantify the drug concentration in the aliquots.
In vivo study
The Institutional Animal Ethical Committee (IAEC), ISF College of Pharmacy, Moga, Punjab, approved the in vivo protocol (ISFCP/IAEC/CCSEA/03/2023/45), and their specifications were adhered to the terms and regulations provided by the Committee for the Control and Supervision of Experiments on Animals (CCSEA). While kept in regular laboratory settings, the animals (Wistar rats, male of 2 months age) were fed a conventional laboratory diet and given unhindered access to water.
Carrageenan-induced rat paw oedema
The effectiveness of modified liposomal compositions was investigated employing a rat paw oedema induced by carrageenan for its anti-inflammatory properties. A wistar rat (220–250 g, male) was adopted in this experiment. The animals were split into six animals consisting three groups (control, Acec gel, and Acec-Lipo opt gel). Animals were administered an injection sub-plantarly with 0.1 mL of 1.0% w/v carrageenan solution in saline into the right hind paw to provoke paw inflammation. The Acec gel and Acec-Lipo opt gel (0.5 g) were given topically to the paw, and plethysmometer was implemented to analyse the paw volume before and after the injection of carrageenan at 0, 1, 2, 3, 4, 5, 6, and 12 h, respectively [28]. The following equation was executed for estimating the percentage swelling of the paw:
where V is the paw volume following the carrageenan injection at varied time intervals, and V0 is the baseline paw volume at time zero. The percent inhibition of edema was illustrated by
where PSf is the proportion of edema in the formulation-treated group, while PSc is the proportion of edema in the control group.
Hot plate method (anti-nociceptive behaviour)
The analgesic impact of the developed formulations was assessed via an Eddy hot plate. The test was conducted on a male Wistar rat weighing 150–250 g. The rats were split into three groups of six animals (control, Acec gel, and Acec-Lipo opt gel). The trial was started after applying the formulation (100 mg) to the paw of a rat every 15 min up to 1 h. The cut-off for the basal reaction time was set to 10 s as per standard conduct. Each group’s response time was tested at different time intervals (0, 30, 60, 90, and 120 min). The following equation was used to calculate the percent analgesic effect [29]:
Skin irritation studies
According to OECD guidelines 402, the study was conducted to establish the effect of optimised formulation on animals after repeated treatment in comparison to commercial formulation for 28 days. Each set of six animals was divided into three groups: control, commercial, and optimised formulation. The induction of the erythema and edema was evaluated as per the Draize skin irritation score system: 0, no erythema; 1, barely perceptible erythema; 2, well-defined erythema; 3, moderate erythema; and 4, well-defined erythema at intervals of 24, 48, and 72 h [30]. The animals in each group were weighed on the day of the experiment, and the gel was administered topically for 28 days on a regular basis. The skin was evaluated for redness, inflammation, or irritation after physical examination [31].
Statistical analysis
The mean standard deviation (SD) of the derived values is provided for each data set. The data was statistically evaluated using ANOVA, followed by Dunnett’s post-test in Graph Pad Prism 7. A p < 0.05 value was considered statistically significant.
Results and discussion
A dermal formulation of ACE was aimed with the inclusion in the chitosan-based gel to exhibit synergistic anti-inflammatory action. QbD approach was engaged for finding the best combination of drug along with excipients in order to develop liposomes. The selection of the best formulation was based on low PDI, required zeta potential, and ideal nanometric size range of the vesicles. Thereafter, the optimised liposomal formulation of ACE was further included in chitosan-based gel for suitable dermal delivery. The developed formulation was equivalent to its commercial counterpart in terms of ACE strength. The total duration of the study for its development and complete evaluation was around 12 months.
Fabrication and optimisation of ACE-loaded liposomes
Design expert software was used to successfully prepare and optimise liposomes. The response surface approach was used in conjunction with the CCD. As stated in Table 1, the concentration ranges of soy lecithin, cholesterol, and vitamin E TPGS were chosen to be 13.5–17% w/v, 7–10% w/v, and 2–3.75% w/v, respectively. The dependent variables including PDI, vesicular size, and entrapment efficiency impacted by the independent factors were assessed by implementing an aggregate of 20 preparation units, as shown in Table 2. All tests were performed in triplicate. Following the analysis of responses, dependent and independent variable constraints were established in order to assemble a design space. The design has been verified by repeating the most desirable solution and comparing the expected and obtained values for the dependent variables. It was observed that the most desirable outcome with ideal nanometric size range (192.8 nm), low PDI (0.226), and entrapment efficiency of 88.7% when repeated for reproducibility, there was marginal or insignificant variation in the dependent variables. After the limitations and priority for the dependent and independent variables were determined, the software created the overlay plot. A yellow zone was envisioned in order to convey the design space’s robust element where solutions might be consistently anticipated. A highly desirable arrangement in the overlay plot’s robust area was selected in order to form an ideal formulation. The formulation was then fabricated and analysed for vesicular size and entrapment efficacy. This staged improved liposomes were employed in further characterisation and investigations.
Characterization of ACE-loaded liposomes
Vesicle size
The vesicle sizes of all batches have been determined employing the Zetasize analyser as displayed in Table 2. The influence of formulation-related variables on vesicular size was investigated. ANOVA validated the quadratic model, and the F-value of 14.70 (p < 0.005) indicated that the model is significant. Lack of fit has a F-value of 2.53, indicating that it was not significant. The correlation among vesicular size and independent variables was described by the coded equation below:
Factors A and B had a favourable influence on vesicular size, whereas Factor C had a negative effect. Interaction terms (AB, BC) had a favourable effect on vesicular size, whereas AC observed a negative effect. Higher-order terms (A2, B2, and C2) had a positive effect. The 3-D response surface in Fig. 1A–C indicated the differences in vesicular size with A, B, and C. The response surface plot illustrated that elevating the proportion of lecithin and cholesterol enhances the vesicular size, yet accelerating the percentage of vitamin E TPGS mitigated vesicular size at low concentrations but increases it at high concentrations. Vesicle size increased as the quantity of cholesterol incorporated into the lipid bilayer was elevated. Quite a similar trend was seen in the study conducted by Karal et al. [32] in year 2022. The increase in lipid concentration raised vesicle size due to an increase in dispersion viscosity and lipid bilayer thickness. Similar outcomes have been observed in studies using papain liposomes [33] and diclofenac liposomes [34]. This was in confirmation to the study conducted by Taghizadeh et al. in 2011, where it was observed that an increase in lipid content led to hike in vesicle size. Surfactant concentration had a detrimental influence on vesicle size. Surfactant enhancement resulted in a reduction in vesicle size because the interfacial tension between the lipid and aqueous phases decreased at high surfactant concentrations. Non-ionic surfactants were seen to reduce the size of the vesicular system in literature also [35].

Effect of independent variables (lipid concentration; cholesterol concentration, vitamin E TPGS concentration) on the vesicle size (A–C); PDI (D–F); encapsulation efficiency (G–I)
Polydispersity Index
The PDI of all batches has been analysed using the Zetasize analyser, and displayed in Table 2. The impact of formulation parameters on vesicular size was investigated. The influence of formulation-related variables on PDI was investigated. ANOVA validated the quadratic model, and the F-value of 6.81 (p < 0.005) indicated that the model is significant. Lack of fit has a F-value of 0.542, indicating that it was not significant. The correlation among PDI and independent variables is described by the coded equation below:
The equation showed that Factors A, B, and C had a positive influence on PDI, whereas interaction terms (AB, BC) had a positive influence on PDI, AC had a negative effect, and higher-order terms (A2, B2, and C2) were seen to have a favourable effect. The 3-D response surface and contour plot in Fig. 1D–F indicated the differences in PDI with A, B, and C. The response surface plot showed that raising the concentration of lecithin, vitamin E TPGS, and cholesterol increased PDI. This is in confirmation to the study conducted by Maritim et al. where they observed an increase in PDI as an effect from the addition in cholesterol content in the liposomal formulation [36].
Entrapment efficiency
Table 1 indicates the entrapment efficiency for each vesicle as determined by ultracentrifugation. The influence of formulation factors on entrapment efficiency was investigated. ANOVA supported the quadratic model, and the F-value of 36.29 (p < 0.005) indicated that the model was significant. The F-value of 0.1360 for lack of fit implies that the lack of fit was not significant. The correlation among entrapment efficiency and independent variable is outlined by the coded equation below:
The equation showed that entrapment efficiency had been boosted by factors A, B, and C. Interaction terms (AB, AC) influenced vesicular size positively, but BC had a negative impact, and higher-order terms (A2, B2, and C2) observed a favourable effect. The 3-D response surface in Fig. 1G–I indicated the differences in vesicular size with A, B, and C. The response surface plot displayed that raising the concentration of lecithin, vitamin E TPGS, and cholesterol increased entrapment efficiency, but increasing the concentration of vitamin E TPGS decreased entrapment efficiency. It was observed in a study conducted for everolimus liposomal formulation that the drug entrapment increased significantly with a hike in the usage of lipid concentration [37]. The rise in cholesterol caused an increase in the encapsulation efficiency of ACE. This action was discovered owing to the deposition of cholesterol between the voids of lipid bilayers, which diminished flexibility, inhibits drug mobility, and reduced ACE diffusion from liposomes. The lipid also had a substantial effect on encapsulation efficiency. Enhanced lipid concentration causes an increase in encapsulation efficiency due to increased lipid viscosity. Because of the increased hydrophobicity and longer alkyl chain length, this inhibited ACE leaching from the lipid bilayer. Surfactant, on the contrary, strengthened ACE encapsulation effectiveness in liposomes. An upsurge in the percentage of surfactant led to a decline in interfacial tension and an improvement in viscosity that defends ACE leakage from liposomes [38]. Summary of findings has been illustrated in Table 3 after ANOVA and regression analysis found for vesicle size, PDI, and % EE.
Point prediction
The analyses of all 20 liposomal preparations appeared adapted to several kinetic orders, while the model with the greatest fit for the fabricated liposomal formulations proved to be quadratic. Acec-Lipo emerged as the best formulation employing the software’s point prediction, considering the criterion of having the lowest vesicle size and PDI with the maximum entrapment efficiency. The total lipid content in the liposomal formulation was (13.5% w/w), cholesterol concentration (10% w/w), and surfactant concentration (2% w/w) that met the requirements for an optimal formulation. The authentic experimental value and the anticipated experimental value (as predicted by software Design Expert 13) proved to be very analogous and linear to one another as depicted in Table 4 and % bias was minimal illustrating that the optimised Acec-Lipo was rational and trustworthy. With particle size and PDI of 174.22 ± 5.46 nm and 0.290 ± 0.01, respectively (Fig. 2), the optimised formulation achieved an entrapment effectiveness of 92.08 ± 3.56%. Based on the CCD design technique, the optimised formulation Acec-Lipo opt was chosen.

Polydispersity index and vesicle size of optimised Acec-Liposomes
Surface morphology
Figure 3 shows a HRTEM of the Acec-Lipo opt formulation. The micrograph indicated a more or less spherical shape as well as the creation of distinct vesicles with clear borders [39]. The results revealed that the vesicles were equally dispersed, separated from one another, and exhibited the contour and centre of the renowned particles.

HR-TEM of optimised aceclofenac liposomes
Differential scanning calorimetry for thermal analysis
The thermal behaviour of ACE and lyophilised ACE liposomes was investigated using DSC as illustrated in Fig. 4. ACE thermograms exhibited a single strong endothermic peak at 157 °C. Their melting points corresponded to these peaks, demonstrating their extremely crystalline composition. The DSC thermograms of the assessed Acec-Lipo formulation showed an endothermic peak at the 170 °C of soy lecithin [38], respectively. DSC traces of the Acec-Lipo formulation also revealed that the drug’s endothermic peak had vanished, suggesting that the ACE was molecularly distributed in the liposomes.

Thermal analysis of a aceclofenac and b lyophilised aceclofenac liposomes
Evaluation of Acec-Lipo opt gel
Table 5 shows the results of testing developed Acec-Lipo opt gel for various physical characteristics. The created Acec-Lipo opt gel had a pleasing, smooth, homogenous look and was devoid of any particulates. The pH of the fabricated topical gel was discovered to be 6.9 ± 0.18 that was considered safe to avoid any skin irritation when applied to the skin. The produced gel formulation has a spreadability of 16.87 ± 3.21 g·cm/s.
Texture analysis
The Acec-Lipo opt gel formulation was tested for texture analysis as illustrated in Fig. 5 as well as metrics such as hardness, % deformation, adhesive force, adhesiveness, stringiness length, stringiness work done, and springiness of the eloped formulation. The force vital to perform the initial compressive deformation was employed to assess the hardness of the gel and, as a consequence, its behaviour when adapted to the skin. In contrast to the conventional formulation, the optimised formulation showed required hardness, % deformation, adhesive force, adhesiveness, stringiness length, and springiness with values of 0.11 N, 66.7%, 0.07 N, 0.5 mJ, 0.333 cm, and 0.089 cm, respectively (Table 5). The duration of a formulation’s inclusion on the skin and the amount of work necessary to spread it defined its adhesiveness and cohesiveness. For further evaluation of the prepared gel-based formulation, an initial modulus was observed to be 16.07 ± 0.70 thus depicting its utility as a suitable application over the skin.

Texture analysis of optimised Acec-Lipo gel
In vitro drug release studies
ACE release from Acec-Lipo opt gel and Acec gel were estimated and found to be 84.50 ± 2.14% after 24 h and 94.89 ± 2.85% after 12 h respectively as illustrated in Fig. 6. Acec-Lipo opt gel had a biphasic release pattern, with an initial quick release followed by a delayed release after 2 h. The existence of the drug on the surface led to rapid escape in the beginning, which slowed gradually due to ACE entrapment in the matrix of gel that is projected to hinder drug diffusion from the lipid mix or strengthened gel viscosity. The drug release data was analysed kinetically employing an array of mathematical models, with the Acec-Lipo opt gel adopted Higuchi (R2 = 0.999) indicating the ideal fit in terms of R2 values, followed by the first-order (R2 = 0.924), zero order (R2 = 0.887), and Korsmeyer-Peppas (R2 = 0.738). The suggested model’s release exponent (n) was determined to be smaller than 0.5 (n < 0.5), suggesting that the Fickian diffusion release mechanism was adopted by the Acec-Lipo opt gel formulation.

In vitro profile of the Acec-lipo opt gel and Acec gel
Ex vivo permeation studies
Nonetheless, considering the goal of this study was to compare the permeation performance of Acec-Lipo opt gel with Acec gel. The graph provided cumulative plots of the quantities of ACE penetrated over the skin as a function of time. Ex vivo permeation studies were evaluated as cumulative release per cm2 as depicted in Fig. 7, with permeability coefficient and steady state flux. In the instance of excised goat skin, the steady state transdermal flux was 20.84 and 39.75 µg/cm2/h for Acec gel and Acec-Lipo opt gel, respectively. The greatest drug deposition was obtained in the case of the developed Acec-Lipo opt gel. For both samples, the augmentation of transdermal flux ratio was determined. The enhancement ratio for Acec-Lipo opt gel was determined to be 1.91.

Skin permeation profile of the Acec-lipo opt gel and Acec gel
According to the findings, Acec-lipo opt gel had the potential to penetrate the skin. The Acec-Lipo opt gel formulation demonstrated higher penetration into and through the epidermal layers, indicating that it was more acceptable as a drug delivery carrier. The findings suggested that a liposomal formulation would be a better alternative for skin distribution than an Acec gel formulation. The proportions of cholesterol and vitamin E TPGS in liposomes seemed to have an important influence in ACE penetration into the skin. Cholesterol had already been shown to influence and modify the fluidity, phase behaviour and stability of membrane permeation and trafficking. Cholesterol and vitamin E TPGS were also commonly utilised as penetration enhancers for topical administration. Researchers have generally recognised vesicular systems for topical drug administration due to their biocompatible, biodegradable, and nonimmunogenic nature. It should be mentioned that their adaptability also refers to their capacity to control the release of a medicinal substance based on specific treatment requirements [40].
Carrageenan-induced paw edema
Figure 8 depicts the percent inhibition of inflammation and mean percent edema of all groups investigated. Edema inhibition was found to be greatest in the Acec-Lipo opt gel formulation, followed by Acec gel. The obtained findings demonstrated that the formulated compositions outperformed Acec gel. These novel findings reinforce the notion that the addition of chitosan created a synergistic effect, as well as that deformability and vesicle size have a substantial impact on the accomplishment of topical therapies, in spite of the fact that Acec gel has the same composition.

Anti-inflammatory activity of Acec-Lipo opt gel and Acec-gel compared with disease control
Hot plate method (anti-nociceptive behaviour)
Acec-Lipo opt gel enhanced animal latency time on the hot plate throughout the scrutiny period. The heat stimulation of a hot plate causes the animal to respond by hopping or licking of the paw that correlates with the activation of nociceptive receptors. The Acec-Lipo opt gel demonstrated higher anti-nociceptive behaviour in our investigation as shown in Fig. 9, indicating in a hot plate testing, increased latency time indicates an anticipated analgesic effect of central origin.

Analgesic activity of Acec-Lipo opt gel and Acec-gel compared with disease control
Skin irritation studies
Figure 10 depicts visuals of mice undergoing various skin irritation treatments. The images clearly revealed that the animals receiving Acec gel had significant skin inflammation and discomfort. The samples of skin from the groups administered with the Acec-Lipo opt gel, on the contrary, exhibited no visible signs and had been shown to be similar to the control group. The free carboxyl group of ACE, leading to irritation in mice skin following application of Acec gel, might be the cause of the irritation [41]. Liposomes were effective at masking this group and avoiding direct contact with the epidermis.

Skin treated with a normal saline, b Acec-Lipo opt gel, c commercial gel
Conclusion
The liposomal formulation of ACE was successfully fabricated and optimised with the aid of design expert. The current study provided scientific evidence for novel drug delivery technologies outperforming conventional formulations. ACE was delivered safely and effectively using topical vesicular formulations based on vitamin E TPGS and phospholipids. The findings showed that achieving a nano-size range and the addition of ACE liposomes in chitosan-based gel offered a synergistic impact on analgesic and anti-inflammatory characteristics. The optimised gel formulation was tested for pH, phase separation, and homogeneity. It was found that the Acec-Lipo opt gel has significantly higher therapeutic potential than the commercial formulation based on in vitro and ex vivo, and in vivo datum. As an outcome, ACE-loaded liposomes in chitosan gel appear to be a potential alternative to ACE gel for improved topical administration.
Availability of data and materials
The data is available with the first author and corresponding author and the materials were provided by the institute.
References
Raj R, Mongia P, Ram A, Jain NK. Enhanced skin delivery of aceclofenac via hydrogel-based solid lipid nanoparticles. Artif Cells Nanomed Biotechnol. 2016;44:1434–9.
Iolascon G, Gimenez S, Mogyorosi D. A review of aceclofenac: analgesic and anti-inflammatory effects on musculoskeletal disorders. J Pain Res. 2021;14:3651–63.
Bindu S, Mazumder S, Bandyopadhyay U. Non-steroidal anti-inflammatory drugs (NSAIDs) and organ damage: a current perspective. Biochem Pharmacol. 2020;180: 114147.
Jeong WY, Kwon M, Choi HE, Kim KS. Recent advances in transdermal drug delivery systems: a review. Biomater Res. 2021;25:24.
Amisha, Singh D, Kurmi BD & Singh A (2023). Recent advances in nanocarrier-based approaches to atopic dermatitis and emerging trends in drug development and design. Curr Drug Deliv.
Yang C, Wu T, Qi Y, Zhang Z. Recent advances in the application of vitamin E TPGS for drug delivery. Theranostics. 2018;8:464–85.
Fong D & Hoemann CD (2018). Chitosan immunomodulatory properties: perspectives on the impact of structural properties and dosage. Future Sci OA, 4:FSO225.
Garg NK, Sharma G, Singh B, Nirbhavane P, Tyagi RK, Shukla R, Katare OP. Quality by Design (QbD)-enabled development of aceclofenac loaded-nano structured lipid carriers (NLCs): an improved dermatokinetic profile for inflammatory disorder (s). Int J Pharm. 2017;517(1–2):413–31.
Alam P, Shakeel F, Foudah AI, Alshehri S, Salfi R, Alqarni MH & Aljarba TM (2022). Central composite design (CCD) for the Optimisation of Ethosomal Gel Formulation of Punica granatum extract: in vitro and in vivo evaluations. Gels, 8.
Jain P, Taleuzzaman M, Kala C, Kumar Gupta D, Ali A, Aslam M. Quality by design (Qbd) assisted development of phytosomal gel of aloe vera extract for topical delivery. J Liposome Res. 2021;31:381–8.
Xu X, Khan MA, Burgess DJ. A quality by design (QbD) case study on liposomes containing hydrophilic API: II. Screening of critical variables, and establishment of design space at laboratory scale. Int J Pharm. 2012;423:543–53.
Singh A, Vaish A, Shukla R. Box-Behnken design optimized silibinin loaded glycerylmonooleate nanoliquid crystal for brain targeting. Chem Phys Lipid. 2022;1(244): 105193.
Chopra H, Dey PS, Das D, Bhattacharya T, Shah M, Mubin S, Maishu SP, Akter R, Rahman MH, Karthika C, Murad W. Curcumin nanoparticles as promising therapeutic agents for drug targets. Molecules. 2021;26(16):4998.
Singh A, Thakur S, Singh H, Singh H, Kaur S, Kaur S, Dudi R, Mondhe DM, Jain SK. Novel vitamin E TPGS based docetaxel nanovesicle formulation for its safe and effective parenteral delivery: toxicological, pharmacokinetic and pharmacodynamic evaluation. J Liposome Res. 2021;31:365–80.
Jiang C, Ma R, Jiang X, Fang R & Ye J (2023). A transfersomes hydrogel patch for cutaneous delivery of propranolol hydrochloride: formulation, in vitro, ex vivo and in vivo studies. J Liposome Res:1–10.
Hashemi SH, Montazer M, Naghdi N, Toliyat T. Formulation and characterization of alprazolam-loaded nanoliposomes: screening of process variables and optimizing characteristics using RSM. Drug Dev Ind Pharm. 2018;44:296–305.
Ge Y, Ge M. Development of tea tree oil-loaded liposomal formulation using response surface methodology. J Liposome Res. 2015;25:222–31.
Ali A, Ali S, Aqil M, Imam SS, Ahad A, Qadir A. Thymoquinone loaded dermal lipid nano particles: box Behnken design optimization to preclinical psoriasis assessment. J Drug Deliv Sci Technol. 2019;52:713–21.
Jangde R, Singh D. Preparation and optimization of quercetin-loaded liposomes for wound healing, using response surface methodology. Artif Cells Nanomed Biotechnol. 2016;44:635–41.
Kaur N, Kaur M, Mahajan M, Jain SK. Development, characterization and evaluation of nanocarrier based formulations of antipsoriatic drug “acitretin” for skin targeting. J Drug Deliv Sci Technol. 2020;60: 102010.
Avachat AM, Takudage PJ. Design and characterization of multifaceted lyophilized liposomal wafers with promising wound healing potential. J Liposome Res. 2018;28:193–208.
Mostafa M, Alaaeldin E, Aly UF, Sarhan HA. Optimization and characterization of thymoquinone-loaded liposomes with enhanced topical anti-inflammatory activity. AAPS PharmSciTech. 2018;19:3490–500.
Jain SK, Panchal N, Singh A, Thakur S, Shahtaghi NR, Sharma S, Guleria A. Novel self-micro emulsifying drug delivery system for safe intramuscular delivery with improved pharmacodynamics and pharmacokinetics. Curr Drug Deliv. 2021;18:1533–49.
Bachhav YG, Patravale VB. Microemulsion based vaginal gel of fluconazole: formulation, in vitro and in vivo evaluation. Int J Pharm. 2009;365:175–9.
Rai VK, Roy A, Sharma A, Rath G, Kar B, Ghosh G, Pradhan D & Halder JJJOPI (2023). Development and pharmaceutical evaluation of azelaic acid and vitamin E oil-based nanoemulgel of tacrolimus for topical application in plaque psoriasis.1–10.
Krishnaiah YS, Xu X, Rahman Z, Yang Y, Katragadda U, Lionberger R, Peters JR, Uhl K, Khan MA. Development of performance matrix for generic product equivalence of acyclovir topical creams. Int J Pharm. 2014;475:110–22.
Kulkarni M, Potdar S, Date AA, Marfatiya A. In vitro release testing of acyclovir topical formulations using immersion cells. Assay Drug Dev Technol. 2021;19:75–84.
Sharma G, Goyal H, Thakur K, Raza K, Katare OP. Novel elastic membrane vesicles (EMVs) and ethosomes-mediated effective topical delivery of aceclofenac: a new therapeutic approach for pain and inflammation. Drug Deliv. 2016;23:3135–45.
Barbosa AGR, Tintino C, Pessoa RT, De Lacerda Neto LJ, Martins A, De Oliveira MRC, Coutinho HDM, Cruz-Martins N, Quintans Junior LJ, Wilairatana P, De Menezes IRA. Anti-inflammatory and antinociceptive effect of Hyptis martiusii BENTH leaves essential oil. Biotechnol Rep (Amst). 2022;35: e00756.
Banerjee S, Chattopadhyay P, Ghosh A, Pathak MP, Singh S, Veer V. Acute dermal irritation, sensitization, and acute toxicity studies of a transdermal patch for prophylaxis against (±) anatoxin-A poisoning. Int J Toxicol. 2013;32(4):308–13.
Oecdilibrary. OECD Guidelines for the Testing of Chemicals, Section 4 [Online]. Available at: https://www.oecd-ilibrary.org/environment/test-no-402-acute-dermal toxicity_9789264070585-en.
Karal MA, Mokta NA, Levadny V, Belaya M, Ahmed M, Ahamed MK, Ahammed S. Effects of cholesterol on the size distribution and bending modulus of lipid vesicles. PLoS ONE. 2022;17(1): e0263119.
Wu Y, Xu Y, Sun WJ. Preparation and particle size controlling of papain nanoliposomes. J Shanghai Jiaotong Univ Agric Sci. 2007;25:105–9.
Taghizadeh SM, Bajgholi SJJOB & Nanobiotechnology (2011). A new liposomal-drug-in-adhesive patch for transdermal delivery of sodium diclofenac. 2:576.
Shaker S, Gardouh AR, Ghorab MM. Factors affecting liposomes particle size prepared by ethanol injection method. Research in pharmaceutical sciences. 2017;12(5):346.
Maritim S, Boulas P, Lin Y. Comprehensive analysis of liposome formulation parameters and their influence on encapsulation, stability and drug release in glibenclamide liposomes. Int J Pharm. 2021;5(592): 120051.
Torres-Flores G, Gonzalez-Horta A, Vega-Cantu YI, Rodriguez C, Rodriguez-Garcia A. Preparation and characterization of liposomal everolimus by thin-film hydration technique. Adv Polym Technol. 2020;10(2020):1–9.
Zafar A, Alruwaili NK, Imam SS, Yasir M, Alsaidan OA, Alquraini A, Rawaf A, Alsuwayt B, Anwer MK, Alshehri S & Ghoneim MM (2022). Development and optimization of nanolipid-based formulation of diclofenac sodium: in vitro characterization and preclinical evaluation. Pharmaceutics, 14.
Sankhyan A, Pawar PK. Metformin loaded non-ionic surfactant vesicles: optimization of formulation, effect of process variables and characterization. DARU J Pharma Sci. 2013;21:1–8.
Kaur M, Singh K, Jain SK. Luliconazole vesicular based gel formulations for its enhanced topical delivery. J Liposome Res. 2020;30:388–406.
Raza K, Kumar M, Kumar P, Malik R, Sharma G, Kaur M, Katare OP. Topical delivery of aceclofenac: challenges and promises of novel drug delivery systems. Biomed Res Int. 2014;2014: 406731.
Acknowledgements
The authors are thankful to the ISFAL and Pharmacology Department at ISF College of Pharmacy, Moga, India, for providing access to their sophisticated analytical instruments. We are grateful to DST-FIST, New Delhi, for providing infrastructure in college. We are also grateful to Punjab University Chandigarh, India, for providing HRTEM facility to perform morphological examination of the vesicular system.
Author information
Authors and Affiliations
Contributions
AK—investigation, software, validation, formal analysis, writing—original draft. GDG—methodology, resources. HS—validation, investigation. SS—resources. AS—conceptualization, methodology, resources, writing—review and editing, supervision.
Corresponding author
Ethics declarations
Ethics approval and consent to participate
All the ethics were adopted while conducting the research.
Consent for publication
All the authors provided their consent to publish the work.
Competing interests
The authors declare no competing interests.
Additional information
Publisher's Note
Springer Nature remains neutral with regard to jurisdictional claims in published maps and institutional affiliations.
Rights and permissions
Springer Nature or its licensor (e.g. a society or other partner) holds exclusive rights to this article under a publishing agreement with the author(s) or other rightsholder(s); author self-archiving of the accepted manuscript version of this article is solely governed by the terms of such publishing agreement and applicable law.
About this article

Cite this article
Amisha, Das Gupta, G., Singh, H. et al. QbD-assisted optimisation of liposomes in chitosan gel for dermal delivery of aceclofenac as synergistic approach to combat pain and inflammation. Drug Deliv. and Transl. Res. 14, 2403–2416 (2024). https://doi.org/10.1007/s13346-024-01514-z
Accepted:
Published:
Issue Date:
DOI: https://doi.org/10.1007/s13346-024-01514-z