
Abstract
With continued climate change, coastal areas are subjected to undesirable situations in the form of sea-level rise and its adverse outcomes like storm surge, flooding and erosion. Being a unique geographic location, low topography, relatively higher population density as well as overwhelming dependence on natural resources, Bangladesh is one of the vulnerable countries exposed to the impacts of global warming and climate change. Bhola in southern Bangladesh represents the world’s most dynamic estuary is potentially vulnerable to accelerated sea level rise and associated calamities. The present study aims to develop a coastal vulnerability index (CVI) using eight parameters namely (a) geomorphology, (b) slope, (c) relative sea level change rate, (d) mean tide range (e) shoreline erosion and accretion, (f) population (g) bathymetry and (h) coastal flooding which were addressed as the relative risk variable for the study area using geospatial techniques i.e., Remote Sensing and GIS. The aforementioned parameters were ranked on the basis of their potential contribution to physical changes on the coast, as sea-level rises, and the final calculation was done over 263.87 km shoreline by the square root of the mean values of the ranked variables. According to the vulnerability index, about 22 % corresponding to 57.23 km of the entire coast is under very high-risk and another 29 % representing 75.26 km is under high-risk. Again, 25 % encompassing 67.69 km shoreline is at moderate risk and 24 %, that is 63.69 km shoreline is found to be at low risk. The most vulnerable coastal regions are found mainly along the western coast of Char Fasson and northern and southwestern coast of Bhola Sadar of Bhola Island.
Introduction
Coastal zones, naturally very dynamic and economically highly productive have been adversely affected by the impact of extreme natural events like tsunami, cyclonic storm surge, severe erosion and increased sea surface temperature as a result of global climatic changes over the past century. The earth experienced warm temperature during ~1900 to 1940, cooled slightly during ~1940 to 1965–1970 and then warmed noticeably from ~1970 onward (Hansen et al. 2001; Trenberth et al. 2007). Large emission of greenhouse gases is considered responsible for anomalous rise in temperature in the past three decades; the rise was 0.6 °C at the rate of 0.2 °C. Whereas global warming in the past century was estimated at 0.8 °C, (Hansen et al. 2006; IPCC 2007; Rosenzweig et al. 2008; Wood 2008). At present the most commonly recognized impact of climatic change triggered by global warming is the eustatic sea level rise (Allen and Kumar 2006). Among the low lying countries, Bangladesh has received attention because of potential threat from sea-level rise (Sarwar 2013). The projected sea level rise (SLR) of 1 m in the twenty-first century may adversely affect approximately 1,000 km2 of the coastal land of Bangladesh and its coastal population (Cruz et al. 2007). Eventually the coastal environment will experience the adverse effect because of coastal erosion, flooding near river mouth and low lands, frequent shifting of channel courses, deterioration of water quality in estuaries and aquifers, uneven storm surge and severe cyclone. The rise of sea level is not uniform throughout the coast of Bangladesh. For instance, deltaic region shows relatively low trend whereas the western part of the Meghna River estuary, including the islands of Bhola, Manpura and Hatiya shows higher trend due to huge sediment load with compaction induced subsidence (Sarwar 2013).
Geomorphological features are also found to have significant control on the vulnerability of Bangladesh coasts to the sea level change which are low tidal flats i.e., supratidal plain and intertidal plain, depressions, low elevated dunes, cheniers, spits and levees. Moreover extreme pressure of population, unplanned development activities due to urbanization and industrialization along with tourism also accentuated the vulnerability of this particular region. In this context integrated coastal zone management plays a vital role to mitigate the problem and define suitable adaptation strategies to improve its effectiveness. Recent concern about potential climate-change effects on coastal systems demands the application of vulnerability assessment tools in order to delineate the shoreline susceptible to sea-level rise for more effective coastal zone management. The countries prone to such hazard should adopt certain strategic planning to increase resilience, and reduce the impacts of climate change.
Assessment of vulnerability in a coastal zone can be done by CVI in an efficient way. Many efforts have been made to measure coastal vulnerability and estimate risk intensities to sea-level rise considering various physical variables such as coastal landforms, relief, geology, relative sea-level changes, history of shoreline change, tide and wave regimes, etc. (Gornitz 1991; Thieler and Hammar-Klose 1999; Pendleton et al. 2004; Doukakis 2005 ; Diez et al. 2007; Nageswara Rao et al. 2008; Abuodha and Woodroffe 2010). In this way some relevant questions are to be solved before commencing any development strategic plans for combating the natural disaster and also to mitigate post disaster effect. In this regard CVI, if properly assessed, could give a deeper insight into the present status of vulnerability of a particular area. In fact CVI executed by geospatial techniques like remote sensing and geographic information system are well-established techniques practiced by many of the aforementioned researchers. It helps to handle large datasets and however positional accuracy is an important issue in large scale vulnerability mapping and this particular problem might be solved by geospatial techniques. With a view of quantitative measure and classifying the degree of potential threat zone in various portion of Bhola coast due to the potential effects of sea-level rise, a CVI was developed by this techniques.
The vulnerability assessment pertaining to Bangladesh coast, were done only on regional scale using parameter like sea level change or shoreline change (Sarwar 2013) that includes Ganges-Brahmaputra-Meghna (GBM) delta in Bangladesh rather than targeting a small island like Bhola. However combined parameters for coastal vulnerability assessment were not used previously. In this regard the present study was focused for the quantitative evaluation and classifying the degree of vulnerability at the various parts of Bhola coast combining physical, geological as well as socio-economic parameters with the help of geospatial techniques.
Study Area
Bhola island lies between latitude 21051′38″ to 22051′40″ N and longitude 90032′07″ to 90055′44″ E situated in the south-western part of Bangladesh (Fig. 1) having an area of 3,737.21 km2 . The island is elongated arc shaped in almost N-S direction, approximately 90 km long and 20 km wide. The present study area consists of 7 upazilas which are Bhola Sadar, Burhanuddin, Char Fasson, Daulatkhan, Lalmohan, Tazumuddin and Monpura . Here for the convenience of the computation of CVI a number of tiny islands including Monopura upazila have been excluded to avoid the cumbersomeness and also the difficulties for assigning the vulnerability ranking.

Location map of the study area with union headquarters. Targeting the main island a grid map of 1 × 1 km was made over the recent coastline of the study area
Being the longest mouth bar island in the estuarine part of the Bay of Bengal, Bhola receives major attention due to its diverse physiography and potential coastal resources. The area demands ample importance because of economically beneficiary prospects such as the nearby Shahbajpur gas field, shrimp farming, fisheries and agricultural production. Both fluvial and marine processes are active in this island and it emerged as a small one before attaining the present shape since 1700 century. Major sediment conduits through the Meghna estuary raise the land whereas simultaneous strong tidal waves accounts for land erosion. It is believed that the rising sea and eventual land erosion reduced the shape and size of Bhola island since 1960. However River erosion and storm surge are the two major events prompting higher level of vulnerability of this island.
The river erosion in Bhola is somewhat different in manner. Here, neither the embankments are broken off nor overflown by water. Rather, the riverbank along with the embankments is washed away gradually. The Tetulia River from the west and Meghna from the east flows along north–south through the Bhola island. The combined course of Ganges and Brahmaputra bifurcates at the north of Bhola before reaching the Bay of Bengal. Here most of the water flows through the Meghna which is variedly known as Shahbajpur channel. The water flow rate through this channel is about 200 cusec. Consequently the rate of erosion is higher in the western part. The combined effect of the downstream flow of the Meghna River and upstream pressure exerted by the sea water accentuates tremendous cyclic flow at the bed of Meghna estuary. Eventually that accounts for the river bed erosion and simultaneous bank erosion. Conversely, in rainy season, strong tidal surge leads to the submergence of the low lying lands of the island. Sudden depression generating in the Bay of Bengal may cause Tetulia and Meghna River to flow over danger level and contribute to worsen the situation. Excessive flow of water damages the embankments causing rush of water in the villages and subsequent water logging. Kilometers of roads, highways and constructions like culverts and bridges are flawed. Agricultural land and fish cultivation is blemished. If the river bank erosion continues consistently the island may disappear in the long run. So the current situation is alarming enough to be cautious about defending it.
Population density of Bhola is 522/km2 according to population census 2011 (BBS 2011) living within 2–3 m elevation above sea level. Loss of life and property caused by flooding due to spring tide and tidal surge during devastating cyclones is common in Bhola island. For instance, the 1970 cyclone with a wind speed 185 km/h, accompanied by a 6 m storm surge killed about 167,000 people belonging mostly from Tazumuddin upazila. Apart from that number of strong cyclone hitting Bhola island results in serious casualties and property loss. Land erosion is prime concern of Bhola island which has caused severe plights to approximately 15,000 poor families of 14 unions of BholaSadar, Daulatkhan, Burhanuddin, Tazumuddin, Char Fasson and Monpura upazila. Ultimately losing their homesteads and cultivable lands,
Methodology
The present computing method for coastal vulnerability index (CVI) was adopted (Thieler and Hammar-Klose 1999, Doukakis 2005 and Diez et all 2007) where they analyzed the square root of the product of the ranking factors (1 to 5 for each parameters) divided by the number of parameters considered (formula 1). Seven parameters together with population density as socioeconomic variable were used in the present analysis to measure the coastal vulnerability index. Most of these parameters are dynamic in nature and gathered from different sources (Table 1). They are (a) geomorphology,(b) slope, (c) relative sea level change, (d) mean tide range (e) shoreline erosion and accretion, (f) population, (g) bathymetry and (h) coastal flooding. The formula for CVI calculation is given as
Where, (a) Geomorphology, (b) Slope, (c) Relative sea level change rate, (d) Mean tide range, (e) Shoreline erosion and accretion, (f) Population (g) Bathymetry and (h) Coastal flooding.
A number of geospatial techniques were adopted for the present analysis. Slope map were generated using spatial analysis tool of ArcGIS10. Before that corrections were conducted using median filter since the dem file having few artifacts. Geomorphology map was generated by visual interpretation and converted to shape file by digitization using recent Landsat ETM + (2013). Whereas a great challenge was faced to delineate shorelines for erosion and accretion estimation. Imagery of 10 years interval gap was taken. However high water time imagery pertaining to change detection was collected to avoid misinterpretation of land water boundary. To accomplish this particular task, initially number of imagery were selected randomly (mostly winter season) having a considerable temporal gap with the recent image i.e., 2013. All the pre-selected imagery were cross checked with the tide data (high tide) being collected from Bangladesh Inland water development board (BIWTA). Finally the selection of prior image was made having a good synchronization of satellite passing time and high tide. The Band ratios techniques normalized difference vegetation index (NDVI) was created for distinct land water boundary. After that the NDVI map was converted to binary raster and then polygon shapefile. At the last stage the two polygons were overlaid by union tool and finally the erosion and accretion were calculated. On the other hand the relative sea level change rate and mean tide range values were calculated from 30 year tide gauge data. Union level population data was collected from the population census 2011 (BBS 2011) and interpolated with Inverse distance method. Bathymetric attribute was collected from WMS-enabled client application i.e., GeoMappp® (http://www.geomapapp.org) which offers global multi-resolution topographic (GMRT) data as synthesis of a hierarchy of tiles is a compilation that hosts high resolution (~100 m node spacing) bathymetry information from multi-beam data for ocean areas.(Ryan et al. 2009). Coastal flooding data were downloaded from GeoMapApp (http://www.geomapapp.org) and eSurge (http://www.storm-surge.info/sites/storm) respectively.
For analyzing the vulnerability of the study area in an efficient way a 1 km*1 km of grid (Fig. 1) was generated over the present shoreline of Bhola island based on Landsat ETM + 2013 image. The data for each parameter was used to assign grids of the study area to vulnerability classes ranging from 1 to 5, with rank 1 indicating very low vulnerability and rank 5 as very high vulnerability. Zonal statistics tool was used to collect mean values of slope, population and near-shore bathymetry. However values for the other parameters were assigned manually for each grid and subsequently the vulnerability scale (1 to 5) was assigned for each class according to their vulnerability probability. Once each grid of the coast line was assigned the vulnerability scale for each specific variable, the final CVI was calculated as the square root of the product of the ranked variables divided by the total number of variables.
Parameters and Their Ranking
Quantitative analysis for final CVI was done using the eight parameters which were ranked according to the potential magnitude of its contribution to physical changes on the shoreline as the sea-level rises. The whole shoreline was segmented and assigned vulnerability ranks (Table 2) ranging from 1 (very low), 2 (low), 3 (moderate), 4 (high) and 5 (very high) as detailed in the following sections.
-
(a)
Geomorphology
Morphology of the coastal plain has got to play vital role in determining the impact of sea-level rise (Nageswara Rao et al. 2008). It also reflects relative resistance to land erosion from strong wave energy (Thieler and Hammar-Klose 1999). Since all the geomorphic units of the study area are composed of Holocene coastal sediments, therefore, soft sandy and muddy fluviotidal, supratidal and intertidal plains offer least resistance to erosion. The main coastal landforms (from very high to very low vulnerability) are fluviotidal plains/lateral bars, supratidal plains, intertidal plain. All the map units were mapped from the visual interpretation of satellite image Landsat ETM + (2013) of 30 m spatial resolution along with field experience. Northern portion of this island is found to comprise fluviotidal plains having complex network of ridges and swales with small channel shifting which is lithologically characterized by slightly oxidized silt and sand. This zone is not inundated recurrently by high waves due to its higher elevation than the adjacent areas. However central portion of the island show evidence of relatively higher elevation >3 m distinguished by well-developed natural levees and abandoned channels composed dominantly of silty clay being compact in nature. This unit is engulfed by tide water during rainy season due to the back rush of excessive water in tidal inlets. Southern part of the island gradually merges to the sea with an average elevation of 1.7 m. Most of the landmass of this zone is characterized by tidal flats i.e., supratidal flats and intertidal flats, dominantly clayey in nature and drained by numerous tidal creeks. Although this portion is accreted due to the huge sediment input from upper estuary, frequent inundation however poses more vulnerability. (Fig. 2a) depicts the Bhola coastline in terms of the geomorphology variable showing 159 cells mapped as fluvio-tidal plains (53.17 %) were given a rank 3, 84 cells mapped as supratidal plain marked as rank 4 (28.07 %), 50 cells mapped as intertidal (16.72 %) marked rank 5 and six cells mapped as lateral bars (2.04 %) also marked as rank 3 (Table 2).
Fig. 2 
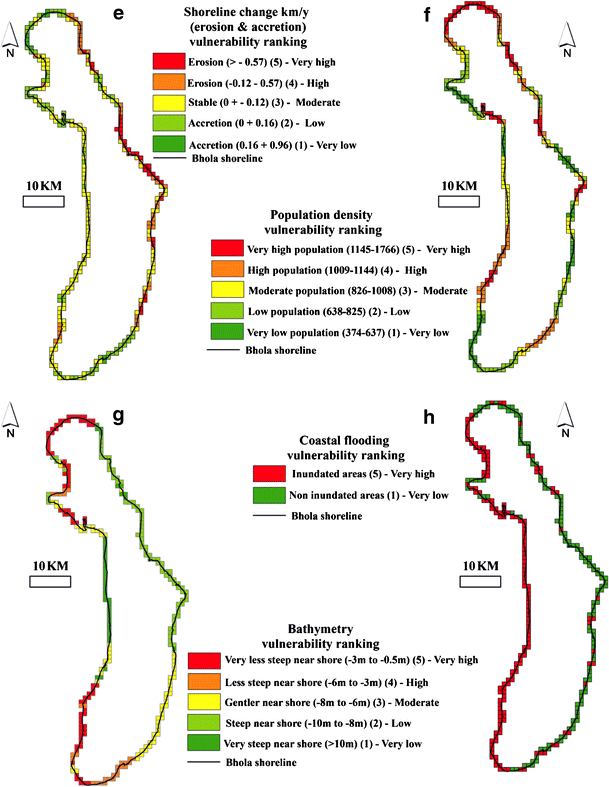
The relative ranking of the coastal vulnerability index for the Bhola Island (a) Geomorphology. (b) Slope, (c) Relative sea level change rate (d) Mean tide range (e) Shoreline erosion and accretion (f) Population density (g) Bathymetry and (h) Coastal flooding
-
(b)
Slope
General topographic gradient of an area is expressed by slope. Slope of the immediate hinterland is treated as one of the important factor for coastal vulnerability assessment (Nageswara Rao et al. 2008). Susceptibility of flooding and rapidity of shoreline erosion also depends on slope gradient. Larger extent of the coast is inundated if the slope is gentle whereas the steep slope experiences less flooding. Bhola Island, comprising of Holocene coastal deposits, are gently sloping where the high tide water rushes towards inland far from the coast. The slope map in degree was calculated using ArcGIS 10 spatial analyst extension using 30 m aster digital elevation model (DEM). Highest slope was found at north of Bhola Sadar whereas the southern portion exhibits lower gradient. (Fig. 2b) depicts the Bhola coastline in terms of the slope variable showing 59 cells mapped as very high slope (19.72 %) were given rank 1, 60 cells mapped as high slope marked as rank 2 (20.07 %), 60 cells mapped as moderate slope (20.07 %) assigned rank 3, 60 cells mapped as low slope (20.07 %) marked as rank 4 and 60 cells mapped as very low slope (20.07 %) were given rank 5.
-
(c)
Shoreline erosion and accretion
It is mentioned previously that Bhola island is losing its land due to severe erosion since 1960. Many research on coastal landform change shows that landforms near Meghna estuary have been accreted and subsequently eroded every year. About 769.4 km2 area has been added in Meghna estuary and its surroundings, is revealed by the combined analysis from 1977 to 2010 (Islam et al. 2011). This particular area being a major sediment discharger contributes to the huge landmass. In contrast, significant erosion prone areas have also been reported. Due to frequent shifting of estuarine channel mouths, the convex front of the shore, deficit supply of sediments and frequent cyclonic surges also enhance the coastal erosion (Rashid and Mahmood 2011). Tentulia River in the west, having reduced flow velocity, shows signs of low eroding capability than the east Shabazpur River. Accordingly, western part accumulates huge sediment each year; whereas eastern portion is being eroded at a significant rate (Islam et al. 2011). Analysis of images from 2003 to 2013 reveals that Bhola island has been lost significantly restricted on the north east portion. According to the present change detection approximately 45.25 km2areas has been eroded whereas the accretion is approximately 13.014 km2. (Fig. 2e) depicts the Bhola coastline in terms of the erosion and accretion variable showing 9 cells mapped as very low (accretion) (3.01 %) were given a rank 1, 78 cells mapped as low (accretion) marked as rank 2 (26.09 %), 133 cells mapped as moderate (erosion) (44.48 %) marked rank 3, 48 cells mapped as high (erosion) (16.05 %) marked as rank 4 and 31 cells mapped as very high (erosion) (10.37 %) were given a rank 5.
-
(d)
Relative sea level change rate
Tide gauge data collected from Bangladesh water development board was used as the elementary source of sea level change information. Sea level change rate was estimated using long-term (1960–2011) every day tide gauge data. Long term tide gauge data recorded for Daulatkhan station, east of Bhola coast during the aforementioned time period was used to estimate the sea level change rate (Fig. 2c(1)) The yearly mean high tide data were plotted for each year from which a best fitted linear line using least square method was calculated for predicting the rate of sea level change. But the derived relative change of sea level which is 14 mm/ year seems to be an over estimation if compared to 4–7.8 mm/year assessment of Singh (2002) whereas it seems ok if compared with Choudhury et al. (1997) who postulated a sea-level rise of 10–15 mm/year along the Bangladesh coast. Seasonal variation as well as subsidence might be responsible for such high value of change rate than the normal rate of change in ganges deltaic coast. As the sea level for a smaller region is not varying therefore the entire coastline i.e.; all the 299 grids, is classified into a single vulnerability class of very high risk with assigned rank 5 (Fig. 2c)
-
(e)
Mean tide range
The average of high and low tides infers the mean tide range and is considered an important symbol for tide intensity measurement, eventually linked to both permanent and episodic inundation hazards from sea-level rise and storm surge (Yin et al. 2012). The coast of Bhola island is microtidal (i.e., less than or ~ 2 m) and semidiurnal in nature. The measured mean tide range was found 2.05 m in the present study. Ranking the coast with respect to mean tide range has been variously practiced by different researchers. The present study adopted a scrutiny that higher the tidal range, the lower the vulnerability, the same perception included in earlier studies (Thieler and Hammar-Klose 1999; Pendleton et al. 2004). According to them, on a tide dominated coastline, there is only a 50 % chance of a storm occurring at high tide. Thus, for a macrotidal region (>4 m tide range), a storm having a 3 m surge height still remains 1 m below the elevation of high tide for half a tidal cycle. A microtidal region, on the other hand, is essentially always “near” high tide and therefore prone to greatest risk of inundation from storms. Since the study area comprises of microtidal environment as observed from mean tidal range 2.04 m, it was assigned to rank 3 in vulnerability scale (Fig. 2d).
-
(f)
Population
Vulnerability is augmented by population which is treated as one of the major socio-economic variables in the present analysis. Most of the formerly developed coastal vulnerability indices recognize that the accumulation of socio-economic variables can aid in defining vulnerable areas (McLaughlin et al. 2002). Population can be replaced for economic variables since people invest money to build infrastructures and tries to protect their properties from erosion and other calamities like storm surge and sudden flooding. (Dilley and Rasid 1990; Devoy 1992; Rivas and Cendrero 1994). Even though, many of the advance researches pertaining to CVI did not take account of population due to inherent difficulties involved in ranking socio-economic data on an interval scale (Arun and Pravin 2012). However, the present analysis was done by considering the population as one of the important parameter for final CVI. The number of population in the coastal areas of Bangladesh is noteworthy and the increasing rate of population is significant. Bhola island received major demand for habilitation because of coastal resources on rise. As a consequence large number of people inhabiting are exposed to various hazards like coastal erosion, inundation due to spring tide and cyclonic storm surge. Population data was collected union wise and then classified as quartile. Higher the population, higher the vulnerability. Total number of population density ranges from 373/ km2 to 1765/km2. Maximum population is concentrated at Bholasadar and Lalmohan upazilas whereas Char Fasson exhibits less population. According to the vulnerability classification Bhola coastline in terms of the population (Fig. 2f) showing 59 cells mapped as very high population density (19.72 %) were given rank 5, 60 cells mapped as high population density marked as rank 4 (20.07 %), 60 cells mapped as moderate population density (20.07 %) marked rank 3, 60 cells mapped as low population density (20.07 %) marked as rank 2 and 60 cells mapped as very low population density (20.07 %) were given rank 1.
-
(g)
Bathymetry
Information pertaining to the near shore morphology and depth of the seabed are noteworthy for a variety of investigations (Ryan et al. 2009). Sea bed morphology expressed as bathymetry is the underwater equivalent of contour lines on the land and is an essential baseline for all forms of hydrodynamic, wave, and inundation modeling. In the present analysis, the gradient of the land surface for the terrestrial part is described under the section ‘Slope’. Whereas underwater status, relating the slope configuration of the sea bed i.e., underwater equivalent to hypsometry or topography is titled as bathymetry which is an important parameter in deciding the degree to which the coastal land is at the risk of flooding from storm surges and during a tsunami. Thus in the coastal region underwater near-shore areas having gentle slope are considered as highly vulnerable and conversely, areas of steep slope, as areas of low vulnerability. However, subsequent land loss from inundation is simply an inverse function of slope; the lower the slope, the greater the land loss (Klein et al. 2000). For the present study a bathymetry map was downloaded from GeoMapApp (http://www.geomapapp.org) and assigned each grid to its adjacent near shore (underwater) bathymetry value in meters. Most of the shoreline exhibits shallow near shore slope whereas the north east shoreline belongs to deep near shore slope. Bhola coastline in terms of the near shore bathymetry showing (Fig. 2g) 83 cells mapped as very low (27.78 %) were given rank 1, 57 cells mapped as low marked as rank 2 (19.06 %), 51 cells mapped as moderate (17.05 %) marked rank 3, 29 cells mapped as high (9.69 %) marked as rank 4 and 79 cells mapped as very high (26.42 %) were given rank 5.
-
(h)
Coastal flooding
Coastal flooding is an uninvited event due to sea level rise in low lying coast. As sea level simply exceeds the land elevation it causes amplified level of flooding and permanent inundation of low lying land. Main cause of sudden flooding is storm surge during a violent cyclone. Besides, coastal flooding may happen due to uneven high tide level caused by normal variations in the astronomical tide cycle. In actual fact, flooding is severe if the high tide and the storm surge come about in same time. For the present study, a simulated flooding result due to the devastating cyclone named Sidr that struck the south-west coast of Bangladesh on 15 November 2007 was taken as one of the standard for vulnerability assessment. This particular storm was accompanied by waves up to 5 to 6 m high, eventually breaching coastal and river embankments, flooding low-lying areas and causing extensive physical destruction. As Sidr is considerable as the most violent cyclone in past 100 years therefore it is quite reasonable to use the coastal flooding inundation areas during Sidr which was downloaded from eSurge database (AOI-90) (http://www.storm-surge.info/sites/storm) alternatively for simulated coastal flooding map for the assessment of vulnerability in the study area, and exactly that is what done in the present analysis. For instance, entire west coast of the study area was inundated and water extended up to 5 km inland as an effect of Sidr whereas eastern coast was relatively less harmed by flooding; however the probability of flooding by future violent cyclonic storm surge cannot be overruled. Therefore, while computing vulnerability scale, west coast was ranked as 4 (high vulnerable) whereas the east coast was ranked as 3 (moderate vulnerable). (Fig. 2h) depicts the Bhola coastline in terms of the Coastal flooding showing161 cells mapped as flooded which was given a ranked of 4 (53.85 %) whereas rest of the grids 138 was given ranked as 3 (46.15 %).


Results and Discussion
The value of the coastal Vulnerability index (CVI) for each of the cells was determined using the square root of the product mean (formula 1). All the data were classified and ranked accordingly to accomplish the analyses given in (Table 2). The data for each coastal cell was processed in ArcGIS (with a unique ID), assigning specific rankings in the attribute table of the ‘shapefile’ for each variable. The calculated CVI values for Bhola Island range from 11.61 to 122.47 whereas the mean value is 42.40; the mode and the median are 30 and 37 respectively, however the calculated standard deviation is 20.90. The 25th, 50th, and 75th percentiles are 28.46, 36.74 and 53.60, respectively. Figure 3 displays a map of the coastal vulnerability index for the study area. After getting the final CVI scores, all the values are divided into low, moderate, high, and very high-vulnerability categories based on the quartile classification which indicated that the discrete index values for each cell were ranked according to their magnitude and finally checked by visual inspection of the data. Many of the earlier study were done for depiction of CVI (Thieler and Hammar-Klose 1999; Pendleton et al. 2004; Nageswara Rao et al. 2008; Abuodha and Woodroffe 2010) according to the percentile division 25th percentile showed less vulnerability, up to 50th percentile was moderate vulnerability whereas the 75th percentile was the high and very high vulnerability, CVI values below 28.46 were assigned to the low vulnerability category. Values from 28.46 to 36.74 were considered as moderate vulnerability whereas the high-vulnerability values lie between 36.74 and 53.60 CVI values above 53.60 were classified as very high vulnerability.

Coastal vulnerability index based on quartile classification, categories as low, moderate, high and very high indicating vulnerability along Bhola coast
Reckoning of all the parameters used for CVI reveals that specifically shoreline geomorphology, shoreline erosion and accretion rate, population, coastal flooding and bathymetry had significant control over the final result by virtue of a good number of variabilities. On a contrary, relative sea level change rate and the mean tide height both were assigned a constant value for the entire coast. Consequently their contribution for vulnerability assessment was same for the entire grid and was comparatively less robust.
Based on Landsat 2013, total shoreline of Bhola Island considering the main land was found to be 263.87 km. For the representation of the entire coastline accurately, vulnerability was established as a line feature which would portray the risk level at any point along the coast. To accomplish this particular task all the grids (299) and the coast line were intersected using ArcGIS intersection tool and finally the CVI value was incorporated with the line feature.
A total of 263.87 km of the shoreline in the study area is ranked. From the analysis it is revealed that 22 % of the total coast line over a length of approximately 57.23 km mostly along the north eastern coast of Bhola Sadar upzila, western coast of Daulatkhan and both eastern and western coast of Char Fasson upzaila marked as being very high vulnerable due to future sea-level rise (Fig. 3) hence is under the very high-risk category. This is because of very low elevated intertidal and supratidal flats together with higher population density, shallower near shore bathymetry as well as moderate erosion rate. On the other hand 29 % of the coast over a length of approximately 75.26 km mostly in the west coast of Lalmohan upazila and east and south coast of Char Fassion upazila marked as high vulnerability due to high risk of coastal flooding, supratidal flat with low topography, moderate population density and moderate erosion rate categorized as high risk zone. Whereas 26 % of the shoreline exhibits 67.69 km dominantly found around east coast of Tazumuddin and west coast of Bhola Sadar possess moderate vulnerable therefore moderate risk category. About 63.69 km of the coastal stretch which is about 24 % of Bhola Island covering few part of east coast of Tazumuddin, Burhanuddin and Bhola Sadar marked as the low vulnerability due to relatively resistive geomorphic units i.e., fluviotidal, higher accretion rate, higher slope than the adjacent areas and low population density.
A union wise vulnerability assessment was done from the final CVI and is given in (Table 3). Total 53 peripheral unions of the shoreline are ranked with vulnerability scale. Bhola Sadar upazila include 13 unions that encompass 87 km shorelines of which 21.69 % is very high vulnerable, 28.52 % is high vulnerable, 25.65 % is moderate vulnerable and 24.14 is less vulnerable. Shoreline comprised by Rajapur and Bhelumiah union is exposed at extreme risk. Char Fasson consists of seven unions covering 71.7 km shoreline of which 36.49 % can be categorized as very high vulnerable, 33.87 % as high vulnerable, 16.90 % as moderate vulnerable and 12.74 % as low vulnerable shoreline. Nilkamal, Nurabad, Char kalmi, Char Manika and Aslampur unions is reported to possess high to very high vulnerability. Lalmohan upazila consist of 6 unions comprises only 39.58 km shorelines where 21.75 % is cataloged as very high vulnerable, 36.79 % as high vulnerable, 30.77 % as moderate vulnerable and 10.69 % as less vulnerable. Badarpur, Paschim Char Umed and Lord Hardinje are the unions in severe danger. Burhanuddin upazila hold 8 unions and encloses 31.28 km shoreline among which 3.29 % is sort out as very high vulnerable, 31 % as high vulnerable, 30.40 % as moderate vulnerable and 35.81 % as less vulnerable. In this upazila only Sachra union is under acute threat. Tazumuddin upazila sand Daulatkhan are relatively less susceptible to hazard compared to the other three aforementioned upazilas. Only 19.41 km shoreline belongs to Tazumuddin where only 7.52 % is typified as high vulnerable zone, rest of the shoreline can be classified into moderate and low vulnerable region that embraces 51.26 and 41.22 % of the shoreline respectively. Daulatkhan includes 5 unions with not a single one showing signs of very high vulnerability. Accordingly 51.13 % of the shoreline falls in less vulnerable, 42.94 % in moderate vulnerable whereas only 5.93 % in high vulnerable expanse.
The present CVI (Fig. 3) is unlikely to provide a clear basis for predicting future recession of the coast, however the outcome of this study offer a framework for coastal managers and planners to prioritize efforts to enhance the resilience or consider adaptive measures in the Bhola island and this particular approach might be useful and effective in other parts of the Bangladesh coast.
Conclusion
The prime objective behind defining the CVI of Bhola Island is to give an insight pertaining to the degree of vulnerability, to the coastal decision makers or planners. Dynamic and significantly responsible parameters like (a) geomorphology, (b) slope, (c) relative sea level change rate, (d) mean tide range (e) shoreline erosion and accretion (f) bathymetry (g) population and (h) coastal flooding were analyzed to figure out the present status of the elements at risk for the study area. However, incorporation of few relevant parameters like storm surge, and wave height, if were possible, could have given more appropriate output as the final CVI for greater understanding of the vulnerability condition of the corresponding area which was supplemented by the bathymetry and coastal flooding data in the present analysis . The agglomeration of the aforesaid data is hindered by the fact that Bangladesh lacks proper SDI, essentially required for geospatial analysis, unlike the other developing and developed countries. Apart from this, fine resolution data like lidar for elevation information and even more numbers of tide gauge stations are desired for computing the exact rate of sea level rise and mean tide range for large scale vulnerability mapping which is also missing in the present analysis. Despite the lack of high resolution data, best possible care was taken during analysis for developing the final CVI. The geospatial techniques adopted in this study are robust tools, can handle large volume datasets and reduces the required time and money as well. With the help of this technique, the present investigation infers that 51 % of the study area majority of Bhola Sadar upazila comprises very high to high vulnerable zone and therefore is under great threat. The present vulnerability assessment would surely help to achieve a sustainable use of coastal resources by identifying main constraint i.e.; hazards for an integrated coastal zone management.
References
Abuodha, P., & Woodroffe, C. D. (2010). Assessing vulnerability to sea-level rise using a coastal sensitivity index: a case study from southeast Australia. Journal Coast Conservation, 14, 189–205.
Allen, J. C., & Kumar, P. D. (2006). Climate controls on US west coast erosion processes. Journal of Coastal Research, 22, 511–529. doi:10.2112/03-0108.1.
Arun, K. A., & Pravin, D. K. (2012). Coastal vulnerability assessment for Chennai, east coast of India using geospatial techniques. Natural Hazards. doi:10.1007/s11069-012-0276-4.
BBS (2011). Population and housing census 2011 Bangladesh Bureau of Statistics (BBS), Ministry of Planning, Government of the People’s Republic of Bangladesh, Dhaka Available via http://www.bbs.gov.bd/PageWebMenuContent.aspx?MenuKey=423 accessed on 29 November 2013.
Choudhury, A. M., Haque, M. A., & Quadir, D. A. (1997). Consequences of global warming and sea level rise in Bangladesh. Mar Geodes, 20, 13–31.
Cruz, R. V., Harasawa, H., Lal, M., Wu, S., Anokhin, Y., Punsalmaa, B., Honda, Y., Jafari, M., Li, C., Ninh, N. H. (2007). Asia. In: Parry ML, Canziani OF, Palutikof JP, von der Linden PJ, Hanson CE (eds) Climate change 2007: impacts, adaptation and vulnerability. Contribution of working group II to the Fourth Assessment Report of the Intergovernmental Panel on Climate Change. Cambridge University Press, Cambridge, pp 469–506
Devoy, R. J. N. (1992). Questions of coastal protection and the human response to sea-level rise in Ireland and Britain. Irish Geography, 25(1), 1–22.
Diez, P. G., Perillo, G. M. E., Piccolo, M. C. (2007). Vulnerability to sea-level rise on the coast of Buenos Aires province. Journal of Coastal Research 23, 119– 126. doi:10.2112/04-0205.1
Dilley, R. S., & Rasid, H. (1990). Human response to coastal erosion: Thunder bay, Lake superior. Journal of Coastal Research, 6(4), 779–788.
Doukakis, E. (2005). Coastal vulnerability and risk parameters. Eur Water, 11(12), 3–7.
Gornitz, V. (1991). Global coastal hazards from future sea level rise. Palaeogeography Palaeoclimatology Palaeoecology, 89, 379–398. doi:10.1016/ 0031-0182(91)90173-O.
Hansen, J., Ruedy, R., Sato, M., et al. (2001). A closer look at United States and global surface temperature change. Journal of Geophysical Research, 106, 23947–23963. doi:10.1029/2001JD000354.
Hansen, J., Sato, M., Ruedy, R., Ken, L., David, W. L., Martin, M-E. (2006). Global temperature change. Proceedings of the National Academy of Sciences of the United States of America, 103, 14288–14293. doi:10.1073/ pnas.0606291103.
IPCC Summary for Policymakers. In: Soloman, S. D., Manning, Q.M., Chen. Z. & Miller, H. L. (ed) Climate Change 2007: the PhysicalScience Basis. Contribution of Working Group I to the Fourth Assessment Report of the Intergovernmental Panel on Climate Change. Cambridge University Press, Cambridge pp 1–18.
Islam, M. A., Majlis, A. B. K., & Rashid, M. B. (2011). Changing face of Bangladesh coast. The Journal of NOAMI, 28(1), 1–13.
Klein, R.J.T., Reese, S., & Sterr, H. (2000). Climate change and coastal zones: an overview of the state-of-the-art on regional and local vulnerability. In: Giupponi C, Shechther M (eds) Climate change in the mediterranean: socio-economic perspective of impacts, vulnerability and adaptation. Edward Elgar Publishing, Camberley, pp 245–278.
Pendleton, E.A., Thieler, E. R. & Williams, S. J. (2004). Coastal vulnerability assessment of Cape Hettaras National Seashore (CAHA) to sea level rise. USGS Open File Report 2004–1064.
McLaughlin S, McKenna J, Cooper JAG (2002) Socio-economic data in coastal vulnerability indices: constraints and opportunities. Journal of Coastal Research 36, 487–497.
Nageswara Rao, K., Subraelu, P., Venkateswara Rao, T., Hema Malini, B., Ratheesh, R., Bhattacharya, S., Rajawat, AS., & Ajai. (2008). Sea-level rise and coastal vulnerability: an assessment of Andhra Pradesh coast India through remote sensing and GIS. Journal of Coastal Conservation, 12, 195–207. doi:10.1007/s11852-009-0042-2.
Rashid, M. B., & Mahmood, A. (2011). Longshore currents and its effect on Kuakata beach, Bangladesh, national seminar on Bangladesh coast: Geology hazards and resources, 29–30 July, 2011. People’s Republic of Bangladesh: Organized by Geological Survey of Bangladesh.
Rivas, V., & Cendrero, A. (1994). Human influence in a low-hazard coastal area: An approach to risk assessment and proposal of mitigation strategies. In C. W. Finkl (Ed.), Coastal hazards: Perception, susceptibility and M i t i g a t i o n (pp. 289–298). Fort Lauderdale: The Coastal Education and Research Foundation.
Rosenzweig, C., Koroly, D., Vicarelli, M., Peter, N., Qigang, W., Gino, C. et al. (2008). Attributing physical and biological impacts to anthropogenic climate change. Nature, 453, 353–357. doi:10.1038/nature06937.
Ryan, W. B. F., Carbotte, S. M., Coplan, J. O., O'Hara, S., Melkunian, A., Arko, R. et al. (2009). Global multi-resolution topography synthesis. Geochemistry, Geophysics, Geosystems, 10, Q03014. doi:10.1029/2008GC002332.
Sarwar, G. M. (2013). Sea-Level Rise Along the Coast of Bangladesh. R. Shaw et al. (eds.), Disaster Risk Reduction Approaches in Bangladesh, Disaster Risk Reduction, doi:10.1007/978-4-431-54252-0_10, © Springer Japan 2013.
Singh, O. P. (2002). Spatial variation of sea level trend along the Bangladesh coast. Mar Geodes, 25, 205–212.
Thieler, E. R. & Hammar-Klose, E. S. (1999). National assessment of coastal vulnerability to future sea-sevel rise: Preliminary results for the U.S. Atlantic Coast: U.S. Geological Survey. Open-File Report 99–593 URL.
Trenberth, K. E., Jones, P. D., Ambenje, P., Bojariu R., Easterling D., Klein T., Parker D., Renwick J., Rusticucci M., Soden B., & Zhai P. (2007). Climate change 2007. In S. Solomon, D. Qin, M. Manning, et al. (Eds.), The physical science basis (pp. 235–336). Cambridge: Contribution of WG 1 to the Fourth Assessment Report of the Intergovernmental Panel on Climate Change Cambridge University Press.
Wood, R. (2008). Natural ups and downs. Nature, 453, 43–45. doi:10.1038/453043a.
Yin, J., Yin, Z., Wang, J., & Xu, S. (2012). National assessment of coastal vulnerability to sea-level rise for the Chinese coast. Journal of Coastal Conservation, 16, 123–133. doi:10.1007/s11852-012-0180-9.
Author information
Authors and Affiliations
Corresponding author
About this article

Cite this article
Islam, M., Hossain, M. & Murshed, S. Assessment of Coastal Vulnerability Due to Sea Level Change at Bhola Island, Bangladesh: Using Geospatial Techniques. J Indian Soc Remote Sens 43, 625–637 (2015). https://doi.org/10.1007/s12524-014-0426-0
Received:
Accepted:
Published:
Issue Date:
DOI: https://doi.org/10.1007/s12524-014-0426-0