
Abstract
Wadi El Khariq has a vast area that can be reclaimed. Upper Jurassic carbonates represent the main aquifer. The Desert Research Center has a pilot station in Wadi El Khariq that suffers from water deficiency. Therefore, the drilling of new wells is needed. As fault zones make fracture conduits for groundwater, detecting these faults is a vital process. Therefore, this study aims to trace the existing subsurface structures and their impact on groundwater occurrence. The interpretation of the results of the vertical electrical soundings leads to the detection of five geoelectrical layers. The third and fourth layers correspond to fractures and argillaceous limestone represents the water-bearing layers. The interpretation of the results of the eight 2D electrical resistivity tomography profiles gave more illustrative information about the lateral facies changes, the structures effect along the study area, distribution of the different types of water-bearing limestone, and the depth to their top. The deduced structures from electrical study are represented by the faults F1–F6. The faults F1 and F2 are confirmed from both 1D and 2D imaging profiles. The fault plains of F1, F2, F5, and F6 are continuous between the measured imaging profiles. The 2D imaging profiles revealed that the clay content increase eastwards. The correlation results of the natural gamma and lithological logs of the drilled wells as well as the constructed hydrogeological profiles revealed that the area of study affected by another group of faults (F6–F12). These faults affect on the groundwater occurrence and quality. These faults lead to the formation of graben and horst structures, lateral facies changes, variation in layers thickness, and the occurrence of the fractured limestone layer lying beneath the calcareous clay at variable depths. Most of the detected faults in the study area have NW–SE trends coinciding with the lineation analyses of the faults and fractures of El Khariq basin.
The fractured limestone aquifer in the study area is recharged via the percolation of the surface runoff water of local precipitation on Gable El Maghara catchment area through the fracture lines, fault planes and bedding planes besides paleowater of the paleo-rainy seasons. The depth to water varies from 60 to 114 m. The groundwater salinity of the wells drilled in El Khariq plain varies greatly due to the effect of the lithological nature of the water-bearing formation and the well design. It varies from 2335 to 12548 mg/l. The discharge value (Q) varies from 60 to 12 m3/h. This variation is related to the extension and type of the effective fracture system affecting the concerned aquifer.
Introduction
The area of Wadi El Khariq basin is located northwest El Maghara area in central Sinai. It has a vast land area suitable for agricultural development in addition to the presence of a good stock of raw coal as a source of energy. These reasons all qualify for the establishment of new societies. A research station constructed by the Desert Research Center (DRC) was selected for carrying out this paper as a pilot area in the region. This research station depends on the groundwater produced from a well tapping the karst aquifer to irrigate agricultural experiments and other activities of manufacturing-based crops. The amount of groundwater supply is not sufficient. Therefore, some additional wells are needed to face this demand.
Twenty-five percent of the world’s population use karst aquifers for drinking water resources and karst aquifers comprise around 40 % of the groundwater in the USA (Ford and Williams 2007). While karst aquifers provide important water resources worldwide (e.g., southeastern Appalachian Mountains; Midwestern USA; Yucatan Peninsula; southwestern China; circum-Mediterranean region), they are generally poorly understood due to the spatial and temporal complexity of the flow patterns caused by widely varying porosity and permeability and the organization of the conduit and matrix system. Hydrogeophysics has been a growing field in karst hydrology that has been used in part to improve the understanding of the distribution of secondary porosity (Jardani et al. 2007; Legchenko et al. 2008; McGrath et al. 2002; Sumanovac and Weisser 2001; van Schoor 2002). The highly irregular soil and subsurface bedrock complexity in karst systems has been suggested to limit electrical resistivity tomography (Chalikakis et al. 2011; Thomas and Roth 1999). Dunscomb and Rehwold (1999) used 2D resistivity in a variety of karst terrains with a good deal of success in locating known cave and sinkhole features, as well as confirming suspected fault zones or clay-filled cavities. Faulting may have an effect on groundwater flow paths. The amount of displacement along any particular fault tends to vary, and thus the effectiveness of the fault as a barrier to flow probably changes along the fault plane. Because fault zones can serve as fracture conduits for groundwater flow, characterizing and mapping the structure features in the study area is vital for detecting suitable sites for drilling wells. Therefore, the present study aims to trace the existing subsurface structures and their impact on groundwater occurrence, and finally to locate the most suitable sites for drilling productive wells.
The area of study lies in Wadi El Khariq. This wadi is located west Gabel El Maghara and considered as a circular erosion (half circle)-patterned area. The area of Wadi El Khariq is about 21 km2 (about 5000 Fadden) with a maximum length of about 9 km and maximum width of about 3.4 km. The Gabel El Maghara folded belt is one of the famous and large NE–SW folded belts in north Sinai. (Fig. 1). The study area is bounded by latitudes 30° 42′ and 30° 44′ N, and longitudes 33° 18′ and 33° 20′ E.

The location map of the study area
Climatic condition
The area of study occupies a portion of the arid belt, which dominates north Egypt and is locally affected by the Mediterranean climate. Records about the present climatic records are obtained from El Maghara meteorological stations. Before the present arid nature of the climate, Sinai was affected by less arid climatic conditions (Butzer 1960). In view of the climatic records of the period 1978–1993, the following data is of importance:
Precipitation
The most effective type is rainfall which is common especially in January and February. The average mean annual rain fall is 103.4 mm/year. The rainy months are between October and April. The maximum amount of daily rainfall (storm) ranges between 37.5 mm/day. Sinai is occasionally affected during autumn by sudden rain storms (once every 5 years). When rainfall exceeds 10 mm/day, surface runoff and active recharge of the aquifer systems take place. The amount of rainfall of the paleo-climate before the present nature of aridity of Sinai (5000 YBP) was >150 mm/year. The minimum air temperature is recorded during the winter months (October–March, inclusive). The minimum temperature is 5.9 °C in March and the annual mean is 17.5 ° C. The maximum air temperature is recorded in the summer months (April–September, inclusive) and the annual mean is 29.3 ° C and the maximum temperature is 36.2 ° C in July. The amount of water vapor in the atmosphere is directly related to the air temperature. It is higher in winter than in summer. The annual mean value is 49.6 %. Evaporation and evapotranspiration play a principal role with regard to the groundwater regime. These affect both the groundwater quantity and quality. Evaporation intensity is generally affected by air temperature, air humidity, wind speed, and solar radiation. It includes evaporation from the ground surface, the open water surfaces, water table, and from the existing vegetation cover. The mean daily value is about 11.7 mm/day in June. The annual mean is about 4189 mm/year.
Hydrogeological studies
In the literature, available information essential to the hydrogeology of Sinai is limited and is found in the work of Shata (1956), Geofizika company (1963), Hammad (1980), EGSMA (1985, 1986), EI Ghazawi (1989), Jica (1992), Yehia (1994), and Hassanein (1997) El Abd (2000), (EL Ghazawy 1999).
Geomorphological aspect
The area of study displays morphological features typical of the mild orogenic movements. The existing landforms are affected by strong exogenic processes, which comprise the past wet climatic conditions and the present arid nature of the climate. The main geomorphic units represented in such areas are classified into the following:
-
1.
The Structural Ridge
The Gabel El Maghara anticline is one of the strong folds occupied northern Sinai and are arranged “en echelon” in the NE–SW direction (Fig. 2). It is dissected into many small folds. The surface portion of this ridge is underlain essentially by sedimentary rock units of different hardness. It is strongly dissected by fracture lines including both the axial faults and the transversal faults (Fig. 4). Most of such faults determine the orientation of the existing drainage lines. The core of the ridge is occupied by very hard rocks and rises to higher altitudes (>500 m + MSL). Some of the land features that are associated with the structural ridge include the homoclinal slopes, the hogbacks, and the fault escarpments.
Fig. 2 
Geomorphological map Gabel El Maghara
-
2.
Structural Plateau
This plateau is represented by the Gabel Mandure synclinal fold (Fig. 2). Its surface is dominantly underlain by hard carbonate rocks belonging to the Upper Cretaceous age. In this plateau, the surface rises to >500 + MSL. Associated with this plateau are various local landforms which particularly include the questas, the hamada, and the karstification.
-
3.
Structural Plains
These structural plains occupy much of the lowland areas. They classified into two types: the first type is termed the inland plains or the intermountain plains and is located between the elevated structural features (Fig. 2). These plains are occupied by drainage lines, which originate over the fracture lines. The second type occupies the downfaulted portion and downward area of Gabel El Maghara. This plain merges with the Mediterranean plain to the northwestern direction.

Geological aspect
-
1.
Litho-stratigraph
The exposed rocks on Gabel El Maghara range from Jurassic to Quaternary rock units (Fig. 3). In this study, we will emphasize only on the Upper and Middle Jurassic where they represent the main water-bearing formations.
Fig. 3 
Geologic map of Gabel El Maghara (after Geological Survey of Egypt (G.S.E.) 1992–1994)
The Jurassic rocks are the oldest exposed rocks in the area of study. Gabel El Maghara represents the locality section type of the Jurassic in Egypt. It attains about 2000 m in thickness (Shata 1956). These deposits are unconformably overlain by Lower Cretaceous sandstone and Upper Cretaceous limestone. The Jurassic rock units are differentiated into three subdivisions which are from the base to the top (Al-Far 1966).
-
Lower Jurassic rock units: belong to the Mashabba formation at the base, which is composed of fluvial sandstone containing large wood fragments with thickness of about 100 m. It is succeeded by inter-bedded shallow marine carbonate and the near-shore marine Rajabiah (about 248 m) and Shusha (about 271 m) formations.
-
Middle Jurassic rock Units: subdivided into two units, which are the lower carbonate (Bir El Maghara Formation, 486 m) and the upper clastic (El Safa formation, about 215 m).
-
Upper Jurassic (Massagid Formation) rock units: dominated by carbonates (about 680 m thick) representing a southerly marine transgression at the end of the Bathonian–Callovian times.
-
-
2.
The Geologic Structure
El Maghara Folded Belt is elongate domal features with gentle northwest dip slopes and steep (sometimes vertical and overturned) southeast slopes. It has a length of 45 Km, a width of 20 Km and a maximum relief of 750 m (A.S.L). The folded structure is affected by axial faults (NE–SW), transverse faults (NW–SE) and basalt dikes across it at Wadi El Hamma in the NW–SE direction (Figs. 3 and 4).
Fig. 4 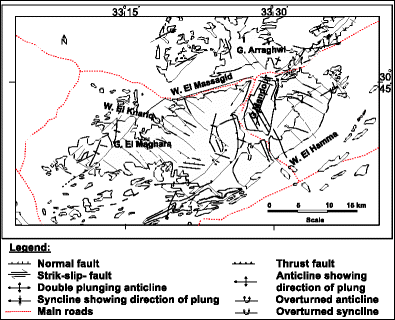
Structural map of Gable El Maghara (after Geological Survey of Egypt (G.S.E.) 1992–1994)
The middle part of Gabel El Maghara represents the highest part of the structure, which has the form of an asymmetric, east-northeast oriented doubly plunging anticline. The core of this fold is dome-like and exposes 2000 m of Jurassic. The northwest flank dips about 25°, while the southeast flank is very steep, vertical, or overturned. The latter flank is bounded by a major thrust, where the Jurassic ride over the Lower Cretaceous.


Hydrological aspect
The Jurassic aquifers include the Upper and middle Jurassic rocks. Upper Jurassic fissured carbonates dominate Wadi El Massagid and Wadi El Khariq in the northern portion of El Maghara fault-folded ridge. While Middle Jurassic rocks dominate at Wadi El Safa, Wadi El Maghara, and Wadi El Malhi.
The Upper Jurassic fractured limestone aquifer (Massagid Formation) is represented by Massagid Formation dominating the faulted blocks of the northwestern flank of Gable El Maghara anticline. These strata dip regionally due to northward (average 15°) and constitute the floor of El Massagid plain and the southern cliff of Wadi El Khariq. It overlies El Safa sandstone formation. It is composed of different types of fractured limestone (dolomitic, argillaceous, chalky, and sandy limestone) intercalated by gypsiferous shale and marl. Its surface is dissected by faults mostly of NE–SW and NW–SE trends (Fig. 4). Three wells (FW1, FW2, and FW5) are drilled by the Foster Wheeler Italian-Fosweco Division (1990) and tapping this aquifer at Wadi El Khariqe. The total depths are varies from 315 to 153 m while the depths to water are varies from 115 to 98 m from the ground surface. The rate of production of the three wells varies greatly due to the extension and type of effective fracture system affecting the concerned aquifer beside the lithologic nature of water-bearing zones. This is well illustrated in well FW5 (produce 60 m3/h) where it is drilled along the major fractured zone including the thrust fault between the Middle and Upper Jurassic formations and a set of transverse faults. This structural system facilitates and accelerates the dissolution of limestone to develop favorable karstic features. The lithologic nature of the saturated zone of the water-bearing zones is composed of 10 m cavernous limestone 6 m porous sandstone.
Geoelectrical studies
Electrical resistivity approaches are used extensively in the search for suitable groundwater sources. The ultimate aim of the resistivity survey is to determine the resistivity distribution with depth on the basis of surface measurements of the apparent resistivity and to interpret it in terms of geology or hydrogeology. The geoelectrical investigation plan in the study area revealed the groundwater occurrence, depending on the fractures and secondary porosity of limestone. These fractures mostly associate with the major structures, which may be exposed on the surface or hidden in the subsurface. The more intense the major structures, the more crowded are the associating fractures. The highly disturbed zones represent the most promising areas for groundwater accumulations. The geoelectrical resistivity survey has been conducted by applying the conventional vertical electrical sounding (VES) which measure the apparent resistivity with depth in one dimension (1D) and 2-dimension electrical resistivity tomography approaches.
Methodology and interpretation techniques
Most of the electrical resistivity techniques require injection of electrical currents into the subsurface via a pair of electrodes planted on the ground. By measuring the resulting variations in electrical potential at other pairs of electrodes, it is possible to determine the variations in resistivity (Dobrin 1988; Ozcep et al. 2009; Alile et al. 2011). It is necessary to interpret the soundings data taking parameters from other sources like geological and hydrological information into consideration (Kumar et al. 2007; Yilmaz 2011).
A conventional vertical electrical sounding (VES) survey is used for quantitative interpretation where the center point of the array remains fixed and the electrode spacing is increased for deeper penetration (Loke 1999). The Schlumberger four electrode configuration was used with current electrode half spacing (AB/2) starts from 1 to 1500 m. This electrode separation is sufficient to reach the required depth that fulfills the aim of the study in view of the geologic and hydrogeologic information. Some of these stations were measured near to the existing wells to estimate the geophysical parameters available for verifying the geoelectrical interpretation. Five vertical electrical sounding stations (VES stations) are carried out in the study area (Fig. 5) which were distributed as a grid to cover the study area. Four of them were measured in the corners of the desert research station and the last one at the center.

Geoelectrical field measurements in the study area
One of the developments in the resistivity surveying method is the use of two-dimensional (2D) electrical imaging surveys (Griffiths and Barker 1993). These techniques are recently widely used in groundwater exploration, environmental and engineering studies because of their ability to detect the variation in resistivity both vertically and horizontally with high resolution. The theory and applications of this technique were the subject of many geophysical studies (Barker 1996; Osella et al. 1999; Olayinka and Yaramanci 2000; Schoor 2002; Marescot and Loke 2003; and Sumanovac 2006). They can be used in areas with moderately complex geology where the conventional resistivity sounding method does not give sufficiently accurate results. The 2D profiling technique was used for studying the vertical and horizontal variations in electrical conductivity (resistivity) within the study area. The Wenner array, which is an attractive choice for a survey carried out in a noisy area (due to its high signal strength) and also if good vertical resolution is required (Loke 2001), was used for acquiring the field data, where measurements start at the first traverse with a unit electrode separation of a = 20 m, and increased at each traverse by one unit, i.e., 2a, 3a, 4a…, na; where n is a multiplier. The length of the profile, depth of penetration, and the required resolution determine the applied unit electrode separation. Eight two-dimensional (2D) electrical resistivity tomography (ERTs) were measured in the study area as shown in Fig. 5. The distance between electrodes is 20 m. Each profile has a length of 1420 m. The first and second profiles (P1 and P2) have nearly W–E and SW–NE directions, respectively. The other 2D imaging profiles are measured in a SW–NE direction inside the desert research station. Each of the third, fourth, and fifth profiles were measured through three stages on the same direction by using the roll along property to complete the view of the subsurface layers. The first stage of 2D ERT was measured normally (P3). In the second stage, electrodes of 240 m from the southwestern part are transferred forward and the electrodes of 1170 m are overlapped (P4). Finally, in the third stage electrodes of 240 m from the southwestern part are transferred again forward and the electrodes of 1170 m are overlapped also the sixth, seventh, and eighth profiles (P6, P7, and P8) are similarly measured parallel to the third, fourth and fifth profiles in SW–NE with the same property of measurements to complete the view of the subsurface layers.
The “Syscal Junior” resistivity meter was used for measuring the geoelectrical measurements with a high accuracy at different electrode spacings. The topographic survey is carried out to determine the locations (latitudes and longitudes) of the sounding stations on the topographic map and each electrode along different 2D imaging profile by using the GPS apparatus (Trimble type) contact with nine satellites.
The natural Gamma and lithological logs of six drilled wells in the study area (Fig. 5) are correlated through two profiles (C–C′ and D–D′) to delineate the structure faults affecting the study area and their impact on the groundwater occurrence.
The purpose of the interpretation process is to reach the subsurface setting at the investigated area. The determination of the geoelectrical parameters (the true resistivity and corresponding thickness) for the subsurface layer is a task of the interpretation of geoelectrical data. It includes correlation of these similar or nearly similar parameters in order to illustrate the horizontal continuation and structural configuration. The common features characterizing the lithologies, structural and hydrological settings in the investigated area are described in view of constructed geoelectrical cross sections.
The interpretation of vertical electrical sounding (VES) and 2D imaging profiles are discussed as follows:
-
1.
Vertical electrical sounding
-
a.
Qualitative interpretation:
It includes the comparison of the relative changes in the apparent resistivities and thicknesses of the different layers detected on the sounding curves. It gives information about the number of layers, their continuity throughout the area or in a certain direction, and reflects the degree of homogeneity or heterogeneity of the individual layer.
The qualitative interpretation represents the general changes in the sounding curves that reflect heterogeneity in resistivity values and thickness of successive layers. This is emphasizes the impact of the geologic setting on the layers and shows the verity of lithological deposits and faults. The general types of the vertical electrical sounding curves in the study area are characterized by QHK, QHA, and QHKH curve types. The variation in resistivity values on the first and second cycles of the resistivity curves represent the surface and near-surface variations. The different curve types, especially the last part, exhibited the degree of heterogeneity that terminate with H-type or K-type in going downward on the curves.
-
b.
Quantitative interpretation:
The quantitative interpretation has been done to get a multiple layer model of true resistivities and thicknesses. The true resistivities are related to lithology according to the geologic information of the nearby wells. The computer programs “RESIST” (Van Der Velpen 1988) and RESIX-PLUS, ver. 2.39 (Interpex 1996), are used for the quantitative interpretation of the vertical electrical sounding (VES) curves. The available information about the drilled well and the geologic setting of the area is taken into consideration in assigning the lithology to the resulting resistivities. The interpreted data of each curve represents the geoelectrical layers with their corresponding thicknesses and resistivities. An example of this interpretation is given in Fig. 6. The interpreted data of each curve represents the geoelectrical layers with their corresponding thicknesses and resistivities. The geologic setting and relevant information are visualized and described in view of a number of generated geoelectrical cross sections crossing the concerned sites in different directions.
Fig. 6 
Interpretation results of VES 1 near the drilled well DRC1
-
a.
-
2.
Two-dimensional electrical imaging (2D)
The resistivity changes along the vertical and lateral directions can be more accurate using the 2D model and the transition from low to high resistivity is quite possible. For the interpretation of the imaging data, the computer program RES2DINV program ver. 3.54 prepared by Loke (1998) was used to interpret the 2D resistivity imaging measurements. This program automatically determines a 2D resistivity model for the subsurface for the data obtained from electrical imaging surveys (Griffiths and Barker 1993).

Results and discussion
Vertical electrical sounding
The quantitative interpretation of the vertical electrical soundings and the three constructed geoelectrical cross sections A–A′, B–B′, and BA′ (Figs. 7, 8, and 9) revealed that the geoelectrical succession is formed out of a number of layers being grouped together in five main layers. The detailed description of the geoelectrical layers from top to bottom is as follows:

Geoelectrical cross section AA′

Geoelectrical cross section BB′

Geoelectrical cross section BA′
The first geoelectric layer represents the surface layer. The resistivity values of this layer range from 6–36 Ωm. It consists of alluvium deposits mainly from sandy clay and clay. The thickness of this layer varies from 18 to 25 m. The second geoelectrical layer consists of dry massive limestone with high resistivity values (161–330 Ωm) at VES numbers 1, 2, and 5. The massive limestone layer varies laterally into clay and marl layers at VES numbers 3 and 4. The clay varies in resistivity from 6–8 Ωm and in thickness from 48 to 50 m. On the other hand, the marl has a uniform resistivity (15–17 Ωm) and a thickness varies from 63 to 105 m. The variation in lithology of the second layer may due to the lateral facies changes and/or structure effect. The third geoelectrical layer has resistivity values ranging from 58 to 102 Ωm. This layer corresponds to water-bearing fractured limestone. The thickness of this layer varies from 25 to 40 m. The fourth geoelectrical layer has resistivity values ranging from 30 to 47 Ωm. It is equivalent to water-bearing argillaceous limestone. The thickness of this layer changes from 40 to 48 m. The last detected geoelectrical layer has resistivity values varying from 5 to 18 Ωm. This layer consists of clay to marl deposits. The bottom of this layer unreached with the used current electrode separation.
The geoelectrical cross sections illustrate the geoelectrical sequence, lateral and vertical variation of different layers along the profile direction, and the subsurface structures affecting the study area. To avoid repetition, the following can be concluded:
-
The surface alluvium layer (the first geoelectrical layer) is represented at all the cross sections.
-
The dry massive limestone (the second geoelectrical layer) changes laterally into clay and marl at VES numbers 3 and 4.
-
The water-bearing formations in the study area are represented by the fractured limestone (the third geoelectrical layer) and the argillaceous limestone (the fourth geoelectrical layer).
-
The water-bearing fractured limestone layer (the third geoelectrical layer) was not detected at VES numbers 3 and 4 due to the effect of structures which may be uplifted and eroded or go downward due to the structural impact.
-
The fifth geoelectrical layer is not detected at VES numbers 3 and 4.
-
Two normal faults (F2 and F3) are detected from the constructed geoelectrical cross sections. The downthrown side of these faults trend towards the center of the study area and lead to the formation of a basin.
Two-dimensional electrical imaging (2D)
The inverted pseudo-sections are performed using the software RES2DINV program ver. 3.54. The resulting sections display various electrical resistivities ranging from less than 5 Ωm to more than 334 Ωm (Figs. 12, 13, 14, and 15). Observing the inversion results, the resistivity values have been classified into four ranges of resistivities as follows:(5 or less to 16 Ωm) represents the conducting clay, (21 to 55 Ωm) for the water-bearing argillaceous limestone, ( ≥55 to 100 Ωm) for the fractured water-bearing limestone, and ( ≥100 to ≥334 Ωm) for the massive limestone. The inverted section of the first profile (p1) of the E–W direction (Fig. 10) generally shows the presence of a vertical structural fault (F3) near the FW1 well, with some features. It is observed that, the first conducting layer (5–16 Ωm) up to a depth of 40 m in the eastern part of the section meets limestone of different resistivities in the western part. Also, the easterly massive limestone is underlined by water-bearing fractured limestone. Finally, the massive limestone underlying the conductive layer that extends to a depth of about 150 m in the east lies against fractured limestone of less resistivity values in the western part. The depth to water in well FW1 is 104 m.

Inverted resistivity model of 2D electrical resistivity tomography (2D No.1)
The inverted section of the second profile (P2) of the NE–SW direction (Fig. 11) generally shows the presence of a structural fault (F4) south of well FW2, with a NW–SE direction. It is observed that the first conducting layer (5–16 Ωm) in the northeastern part of the section meets argillaceous limestone of different resistivities up to a depth of 100 m. This is followed by water-bearing limestone with resistivity ranging from 38 to 100 Ωm with a general increase in the southwestwards. This water-bearing layer is a massive limestone with a resistivity of more than 100 Ωm at the extreme southwestern part.

Inverted resistivity model of the second 2D electrical resistivity tomography
From the summit inverted sections of the third, fourth, and fifth profiles (P3, P4, and P5 (A, B, and C, respectively)) (Fig. 12), it is relevant that, a group of NW–SE faults (F5, F1, F2, and F6) are detected. The argillaceous limestone in the upthrown side of the fault F5 meets conductive clay in the downthrown side. The argillaceous limestone in the upthrown side of the fault F1 comes into contact with the massive and fractured limestone in the downthrown side from a depth of 45 to about 14 m. On the other hand, the fairly massive and fractured limestone in the upthrown side of the faults F1 and F6 lie against the massive limestone in the downthrown side up to a depth of 160 m followed by argillaceous limestone in the upthrown side against the fractured limestone in the downthrown side of the fault F6 but the argillaceous limestone dip in the downthrown side of the fault F1. The depth to water in the upthrown side is 120 m whereas in the downthrown side is 165 m.

Inverted resistivity model of the third, fourth, and fifth (P3, P4, and P5 ( a, b, and c, respectively)) 2D electrical resistivity tomography
From the second summit inverted sections of the sixth, seventh and eighth profiles (P6, P7, and P8 (A, B, and C respectively)), (Fig. 13,), it is relevant that the same group of NW–SE faults (F5, F1, F2, and F6) are detected indicating that these structures are continuous (Fig. 14). In the second summit inverted sections, the argillaceous limestone in the upthrown side of the fault F5 meets conductive clay in the downthrown side. The argillaceous limestone in the upthrown side of the fault F1 contacts the conductive clay in the downthrown side from a depth of 120 m to the end of the section (depth of 240 m). On the other hand, the argillaceous limestone in the upthrown side of the faults F1 meets the conductive clay in the downthrown side. The massive limestone followed by argillaceous limestone and conductive clay in the downthrown side of fault F6 meets argillaceous limestone in the upthrown side. Generally, the expected depth to water in the second summit inverted sections reach nearly to 120 m. This summit has more clay content compared with the first summit. Therefore, it is expected that the water-bearing limestone in the second summit inverted sections of the sixth, seventh, and eighth profiles (P6, P7, and P8) have a higher salinity compared with the water-bearing limestone in the first summit inverted sections (P3, P4, and P5).

Inverted resistivity model of the sixth, seventh, and eighth (P6, P7, and P8 (a, b, and c, respectively)) 2D electrical resistivity tomography

The inferred fault planes along the two summits inverted 2D sections
It can be concluded from the 2D ERT profiles that the area of study is characterized by heterogeneity for resistivity values in vertical and horizontal direction due to the effect of structural faults in the study area. The moderate resistivity values of argillaceous limestone and fractured limestone that varies from 50–100 Ωm is the most suitable for drilling exploitable water wells in the study area. The thickness of the water-bearing limestone is variable along the study area.
The correlation of the natural gamma and lithological logs
To correlate the gamma and lithological logs of the drilled wells in the study area, the marker beds of calcareous clay and clay are used as marker beds in the correlation process. The correlation results of the first profile C–C′ (Fig. 15) connecting between the wells of FW1, WX1, and FW5 revealed that well WX1 represents a graben-like structure between the two-sided wells FW1 and FW5. The wells FW5 and FW1 represent the best wells in the study area. These wells produce from the fractured limestone beneath the calcareous clay. The upper part of this layer is penetrated in well WX1 such that the productivity of this well is very low. Therefore, it is recommended to penetrate the full layer in the location of well WX1.

Natural gamma and lithological logs correlation along profile C–C′
The correlation results of the second profile D–D′ connecting between the wells of DRC2, DRC1 and FW2 (Fig. 16) revealed that well DRC1 represents a horst-like structure between the two-sided wells FW2 and DRC2. Well DRC2 is the highest salinity well in the study area as this well produces from the argillaceous limestone with a high clay content. The upper part of the water-bearing limestone lying beneath the calcareous clay in profile C–C′ is represented with a small thickness in the lower most part of well DRC2. A larger thickness of this layer is reached in well DRC1. This layer was not reached in well FW2 where this well is drilled with a small thickness. To enhance the water quality at well DRC2, it is recommended to penetrate the layer beneath the calcareous clay with a large thickness. Therefore, it can be concluded that the fractured limestone layer lying beneath the calcareous clay is found at variable depths in the study area due to the impact of faults affecting the study area.

Natural gamma and lithological logs correlation along profile D–D′
Groundwater condition
A karst aquifer is limestone or easily dissolved rock and formed collectively from the unconsolidated cover over the bedrock, narrow fractures in the bedrock, small conduits, and larger cave passages. The conduits and caves consist from the pore space between the limestone grains (intergranular or primary porosity) and the fractures (secondary porosity) formed by joints, bedding planes, and faults. The openings or pores may be filled partly or completely by water. The elevation where all pores are filled with water in an aquifer is the water table and it is highly irregular due to the development of conduits at various elevations. Geophysics can help identify locations for well-drilling, investigate subsurface cavities, and obtain other information on the aquifer structure.
The fractured limestone aquifer in the study area is recharged by the percolation of the surface runoff water of local precipitation on Gable El Maghara catchment area through the fracture lines, fault planes, and bedding planes besides paleowater of the paleo-rainy seasons (El Abd 2000). The groundwater salinity of the wells drilled in El Khariq plain varies greatly due to the effect of the lithological nature of the water-bearing formation and the well design. It varies from 2335 mg/l (well FW1) to 12548 mg/l (well DRC2). High salinity of (well DRC2) is attributed to high content of gypsiferous shale, marl and argillaceous limestone within the water-bearing formation (El Abd and Sadek 2010) and as shown in correlation lithological wells (Fig. 17).

Hydrogeological cross sections of the Wadi El Khariq plain
The hydraulic parameters of this limestone aquifer have been determined by RIWR (1984, 1988), EGSMA (1985, 1986) 1990 and they found that the transmissivity (T) values vary from 6 × 10⁻⁵ to 2 × 10⁻² m2/s. The transmissivity (T) values are low reflecting the effect of the lateral facies changes and/or fractures system. The storativity (S) values vary from 4.3 × 10⁻¹ to 5 × 10⁻³. The discharge value (Q) varies from 60 to 12 m3/h (Table 1 and 2). The rates of production of the wells vary greatly due to the extension and type of the effective fracture system affecting the concerned aquifer.
Structural impact on the groundwater occurrence
The interpretation results of the vertical electrical soundings (VESes) and 2D ERT profiles revealed that the area of study is affected by six faults F1 to F6 (Fig. 18). The faults F1 and F2 were detected from both VESes and 2D electrical tomography profiles and form a local basin in between. Most of these faults have a NW–SE trend with different degrees. The faults F1, F4, and F6 have downthrown side northeastward whereas the fault F2 and F5 have downthrown side southwestward. The fault F3 has a nearly N–S direction and its downthrown side towards the east direction. It is relevant that the group of NW–SE faults (F1, F2, F5, and F6) are continuous with the 2D ERT of P3, P4 and P5 and P6, P7 and P8 (Fig. 19).

Inferred structure from electrical studies, natural gamma and lithological logs correlation and hydrogeological cross sections

Rose diagram of faults and fractures of the Wadi El Khariq plain
According to the throw of faults, the study area of Desert Research Station is located in a basin whereas the clay deposit is a concentrate. The structure effect causes the lower geoelectrical layers (limestone) changed eastwards into argillaceous limestone and clay. This affects the potentiality of the water-bearing layer due to the low permeability and the exploited water from the drilled well becomes more saline. The structure effect is also reflected on the changeable thickness of these layers. The faults play an important role in the existing groundwater whereas the fractures concentrate on the sides of faults that increase according to type of rocks. These fractures act as the best locations for storing the groundwater. The best sites for drilling productive wells with good quality of groundwater will be detected according to the location of faults and the type of rock around it. The first and second priority for drilling water well (Fig. 18) are determined beneath the electrode locations of 870 and 300 m, respectively, at the 2D ERT profile P5 (C in Fig. 12).
The deduced structure from the correlated gamma and lithological logs (Figs.15 and 16) as well as the hydrogeological cross sections (Fig. 17) is represented by the faults F7 to F12. Most of these faults have NW–SE trend with different degree (F7, F8, and 12). The fault F7 and F12 have downthrown side southwestwards whereas the fault F8 has downthrown side northeastwards. The faults F9 and F10 have near E–W and WNW–ESE trends, respectively. The fault F9 has downthrown side northwards but the fault F10 has downthrown side southwards. The fault F11 has NE–SW trend with downthrown side southeastwards. Fault F7 and F8 form a graben in between so, the water-bearing fractured limestone layer at the two limbs of the graben is found at a greater depth in the graben. On the other hand, faults F9 and F10 form a horst structure between them. These structures play an immense role in facies changes laterally and variation in layers thickness. The fault F5 detected from the 2D ERT coincides with the fault F7 that detected from gamma ray correlation in the trend and throw. Therefore, these two faults may be the same fault.
The lineation analyses for the faults and fracture systems affected on Wadi El Khariq plain from the geological map (Fig. 4) is shown in Fig. 18a. The main fracture azimuths are N 40–50°W with L % 26.83 and N % 28.07, followed by N 50–60°W with L % 16.78 and N % 15.79, and followed by N 30–40°E with L % 11.35 and N % 8.78. The fracture azimuths of the faults detected from the 2D imaging profiles of the geoelectrical field measurements (Fig. 18b) are N 50–60°W with L % 34.38 and N % 33.33, followed by N 70–80°W with L % 32.09 and N % 33.33, and followed by N 0–10°E with L % 16.04 and N % 16.66. Also fracture azimuths of the faults detected from gamma log correlation and the constructed hydrogeological cross sections (Fig. 18c) are N 40–50°W with N % 33.33, followed by N 20–30°W with N % 16.17, N 70–80°W with N % 16.17, N 80–90°W with N % 16.17and N 20–30°E with N % 16.17. Therefore, the main fracture azimuths of the geological map nearly have the same azimuths of the faults detected from the 2D imaging profiles and the gamma log correlation and the constructed hydrogeological cross sections.
Conclusions and recommendation
The interpretation of the vertical electrical soundings revealed that the water-bearing formation in the study area is represented by the fractured limestone (the third geoelectrical layer) and the argillaceous limestone (the fourth geoelectrical layer). The water-bearing fractured limestone layer was not detected at some VESes due to the effect of structures and changes laterally into argillaceous limestone. Two normal faults (F1 and F2) are detected from the constructed geoelectrical cross sections. The interpretation results of the two-dimension geoelectrical resistivity tomography show that the area of study is characterized by heterogeneity for resistivity values in vertical and horizontal direction due to the effect of structural faults in the study area. The faults F1 and F2 were confirmed with that detected from VES. The 2D ERT profiles revealed that the clay content increase at the eastern part of the study area (2D P6, P7, and P8). Therefore, the water-bearing argillaceous limestone is characterized by high salinity. On the other hand, the fractured limestone of moderate resistivity values (>55–100 Ωm) and the argillaceous limestone (21–55 Ωm) represent the water-bearing layers at the other 2D ERT profiles. In addition to F1 and F2 four other faults (F3–F6) were detected. The correlation results of the natural gamma and lithological logs of the drilled wells as well as the constructed hydrogeological cross sections revealed that the area of study affected by another group of faults (F6–F12). These faults have impact on the groundwater occurrence and quality of groundwater as these structures lead to lateral facies changes and variation in layers thickness. These fractures lead to the formation of graben and horst structures and these cause the fractured limestone layer lying beneath the calcareous clay is found at variable depths in the study area due to the impact of faults affecting the study area.
Most of the detected faults in the study area have NW–SE trends. This trend coincides with the lineation analyses for the faults and fracture systems affected on the Wadi El Khariq plain. The fractured limestone in the study area is recharged by the percolation of the surface runoff water of local precipitation on the Gable El Maghara catchment area through the fracture lines, fault planes and bedding planes besides paleowater of the paleo-rainy seasons. The groundwater salinity of the drilled wells in El Khariq plain varies from 2335 to 12548 mg/l. The discharge value (Q) varies from 60 to 12 m3/h. This variation is related to the extension and type of the effective fracture system affecting the concerned aquifer.
Although the 1D profile (VES) gives information about resistivity and structure in both vertical and horizontal directions, the 2D profiles give more precise details about the vertical and horizontal variations in resistivity values, vertical and horizontal lithological facies changes, the depth to water, and the exact structures locations. The use of the 2D ERT technique is recommended in dealing with karst aquifers.
References
Al-Far DA (1966) Geology and coal deposits of Gebel El Maghara, northern Sinai. Geol.Surv Egypt:59
Alile OM, Ujuanbi O, Evbuomwan IA (2011) Geoelectric investigation of groundwater in Obaretin-Iyanomon locality, Edo state, Nigeria. J G Min Res 3(1):13–20
Barker RD (1996) The application of electrical tomography in groundwater contamination studies. EAGE 58th Conference and Technical Exhibition Extended Abstracts, P082
Butzer KW (1960) Environment and human ecology in Egypt during pre-dynastic and early dynastic times. Bull Soc Geogr Egypt 32:42–88
Chalikakis K, Plagnes V, Guerin R, Valois R, Bosch FP (2011) Contribution of geophysical methods to karst-system exploration: an overview. Hydrogeol J 19:1169–1180. doi:10.1007/s10040-011-0746-x
Dobrin MB (1988) Introduction to geophysical prospecting. McGraw-Hill, New York, p 867
Dunscomb M, Rehwold E (1999) Two-dimensional resistivity profiling; geophysical weapon of choice in karst terrain for engineering applications, in Seventh Multidisciplinary Conference on Sinkholes and the Engineering and Environmental Impacts of Karst, Harrisburg-Hershey, PA, p. 478
Egyptian Geological Survey and Mining Authority EGSMA (1985) Hydrogeological Tests at the exploratory water well WX-2 El Maghara Coalfield
Egyptian Geological Survey and Mining Authority EGSMA (1986) Hydrogeological investigations at El Maghara area; Progressive Report No.4
EI Ghazawi MM (1989) Hydrogeological studies in northeast Sinai, Egypt. Thesis submitted for the Degree of Ph. D. Fac Sci Mansoura Uni:290 p
El Abd EA (2000) Contribution to the hydrogeology of northwest Sinai, Egypt. M. Sc. Thesis, Fac Sci Minufiya Univ Egypt:165p
El Abd EA, Sadek AA (2010) Geochemistry of Middle and Upper Jurassic water bearing formations in Gabal El Maghara, northwest Sinai, Egypt. Bull Soc Sedimentology Egypt 18:147–160
EL Ghazawy MM (1999) A simulation model for groundwater exploration in fractured carbonate aquifers in El Maghara, north Sinai, Egypt. J Environ Sci 18:47–60
Ford DC, Williams P (2007) Karst hydrogeology and geomorphology. Wiley, Chichester
Foster Wheeler Italian-Fosweco Division (1990) Gebel El Maghara Rural Development Project Final Report, submitted to the Governorate of north Sinai, Five Volumes
Geofizika Co (1963) Report on Investigation of Water and Soil Resources in the North and Central Part of Sinai Peninsula, report submitted to General Desert Development Authority, pp. 186
Geological Survey of Egypt (G.S.E.) (1992–1994) Geologic Maps of Sinai. Scale 1:250,000 Sheets 3 and 5. Geol. Surv Egypt, Cairo, Egypt
Griffiths DH, Barker RD (1993) Two-dimensional resistivity imaging and modeling in areas of complex geology. J Appl Geophys 29, Elsevier Science Publishers, B.V., Amsterdam, p 211–226
Hammad FA (1980) Geomorphological and hydrogeological aspects of Sinai Peninsula. 5th Africa conference, A.R.E. Ann Geol Surv Egypt 10:807–817
Hassanein AM (1997) Geological and Geomorphological impacts on the water resources in the central Sinai, Egypt. Ph. D. Thesis. Fac Sci. Ain Shams Univ:373 p
Interpex Lim (1996) RESIX-plus V.2.39, Resistivity data interpretation program software. Golden, Colorado, USA
Japan International Cooperation Agency (Jica) (1992) North Sinai Groundwater Resources study in the Arab Republic of Egypt. Final Report Submitted to the Research Institute For Water Resources Ministry of Public Works and Water Resources, Cairo, Egypt:207p
Jardani A, Revil A, Santos F, Fauchard C, Dupont JP (2007) Detection of referential infiltration pathways in sinkholes using joint inversion of self-potential and EM-34 conductivity data. Geophys Prospect 55:749–760. doi:10.1111/j.1365-2478.2007.00638.x
Kumar D, Ahmed S, Krishnamurthy NS, Dewandel B (2007) Reducing ambiguities in vertical electrical sounding interpretations: a geostatistical application. J A Geophys 62:16–32
Legchenko A, Ezersky M, Camerlynck C, Al-Zoubi A, Chalikakis K, Girard JF (2008) Locating water-filled karst caverns and estimating their volume using magnetic resonance soundings. Geophysics 73(5):G51–G61. doi:10.1190/1.2958007
Loke MH (1998) RES2DINV V. 3.4, rapid 2D resistivity inversion using the least square method. ABEM instrument AB, Bromma, Sweden
Loke MH (1999) Electrical imaging surveys for environmental and engineering studies. A practical guide to 2D and 3D surveys. Advanced Geosciences Inc., Austin, p 57
Loke MH (2001) Electrical imaging surveys for environmental and engineering studies: a practical guide to 2D and 3D surveys, 62 pp
Marescot L, Loke MH (2003) Using the depth of investigation index method in 2D resistivity imaging for civil engineering surveys. SAGEEP 2003. Denver, USA
McGrath RJ, Styles P, Thomas E, Neale S (2002) Integrated high resolution geophysical investigations as potential tools for water resource investigations in karst terrain. Enivron Geol 42:552–557. doi:10.1007/s00254-001-0519-2
Olayinka AI, Yaramanci U (2000) Use of block inversion in the 2-D interpretation of apparent resistivity data and its comparison with smooth inversion. J Appl Geophys 45:63–82
Osella A, Favetto A, Martinelli P, Cernadas D (1999) Electrical imaging of an alluvial aquifer at the Antinaco-Los Colorados tectonic valley in the Sierras Pampeanas. Argentina J Appl Geophys 41:359–368
Ozcep F, Tezel O, Asci M (2009). Correlation between electrical resistivity and soil-water content: Istanbul and Golcuk. Int J Phys Sci (4)6:362–365
Research Institute For water Resources (RIWR) (1984) Well technical report PW and PZ No. 12; Wadi El Khariq; El Maghara Area. Internal Report El-Kanater El-Khyria. WRC. Egypt
Research Institute For water Resources (RIWR) (1988) The water balance for groundwater in north Sinai, April 1988. Internal Report El Kanater El - Khyria. WRC. Egypt
Schoor VM (2002) Detection of sinkholes using 2D electrical resistivity imaging. J Appl Geophys 50:393–399
Shata A (1956) Structural development of the Sinai Peninsula, Egypt Bull Inst. Desert, Egypt 6(2):17–157
Sumanovac F (2006) Erratum to Mapping of thin sandy aquifers by using high resolution reflection seismics and 2-D electrical tomography. J Appl Geophys 59:345–346
Sumanovac F, Weisser M (2001) Evaluation of resistivity and seismic methods for hydrogeological mapping in karst terrains. J Appl Geophys 47:13–28. doi:10.1016/S0926-9851(01)00044-1
Thomas B, Roth MJS (1999) Evaluation of site characterization methods for sinkholes in Pennsylvania and New Jersey. Eng Geol Amsterdam 52:147–152. doi:10.1016/S0013-7952(98)00068-4
Van Der Velpen BPA (1988) RESIST, version 1.0, a package for the processing of the resistivity sounding data, M. Sc. Research Project, ITC, Deft, the Netherlands
Van Schoor M (2002) Detection of sinkholes using 2D electrical resistivity imaging. J Appl Geophys 50:393–399 doi: 10.1016/S0926-9851(02) 00166–0
Yehia MM (1994) Hydrogeological and Hydrochemical studies of the deep aquifers in some localities in Sinai Peninsula. Ph. D. Fac Sci. Menofia Univ:327p
Yilmaz S (2011) A case study of the application of electrical resistivity imaging for investigation of a landslide along highway. Int J Phys Sci 6(24): 5843–5849. Zaidi KF
Author information
Authors and Affiliations
Corresponding author
Rights and permissions
About this article

Cite this article
Khaled, M.A., Al Tammamy, A.M., Barseem, M.S. et al. Geoelectrical and hydrogeological study to delineate the geological structures affecting the groundwater occurrence in Wadi El Khariq Basin, Northwest El Maghara, north Sinai, Egypt. Arab J Geosci 9, 271 (2016). https://doi.org/10.1007/s12517-015-2286-5
Received:
Accepted:
Published:
DOI: https://doi.org/10.1007/s12517-015-2286-5