
Abstract
Among adults of closely related species, a trend in craniofacial evolutionary allometry (CREA) for larger taxa to be long-faced and smaller ones to have paedomorphic aspects, such as proportionally smaller snouts and larger braincases, has been demonstrated in some mammals and two bird lineages. Nevertheless, whether this may represent a ‘rule’ with few exceptions is still an open question. In this context, Felidae is a particularly interesting family to study because, although its members are short-faced, previous research did suggest relative facial elongation in larger living representatives. Using geometric morphometrics, based on two sets of anatomical landmarks, and traditional morphometrics, for comparing relative lengths of the palate and basicranium, we performed a series of standard and comparative allometric regressions in the Felidae and its two subfamilies. All analyses consistently supported the CREA pattern, with only one minor exception in the geometric morphometric analysis of Pantherinae: the genus Neofelis. With its unusually long canines, Neofelis species seem to have a relatively narrow cranium and long face, despite being smaller than other big cats. In spite of this, overall, our findings strengthen the possibility that the CREA pattern might indeed be a ‘rule’ among mammals, raising questions on the processes behind it and suggesting future directions for its study.
Introduction
The family Felidae (Carnivora) includes some of the most charismatic living animals, as well as some of the mammalian species most vulnerable to extinction (Nowell et al. 1996; Nowell 2002). With the house cat (Felis catus) as representative of the most popular domestic species, felids are of central interest for conservation biologists, ethologists and ecologists but also for palaeontologists, zooarchaelogists and evolutionary biologists interested in morphological evolution (e.g., Werdelin 1983; Sakamoto and Ruta 2012). Their evolutionary history, anatomy and biomechanics have been the subject of a multitude of studies (Werdelin et al. 2010, and references therein). Morphologists, in particular, have been interested in the evolution of the feeding apparatus in this group of almost exclusively carnivorous and highly specialized predatory mammals (Meachen-Samuels and Van Valkenburgh 2009a, b).
In terms of size, the family shows large interspecific variability, which spans almost two order of magnitudes (Nowak 2005; Sanderson and Watson 2011). Their body mass can range from just a few kilos, in small and medium size cats such as the oncilla (Leopardus tigrinus), the güiña (Leopardus guigna) or the Geoffroyi’s cat (Leopardus geoffroyi), to more than 200 kg, in large male lions and tigers. Most of the largest species belong to the subfamily Pantherinae, with overall a total of just seven living species, while all the smallest species, plus a few of the big ones, such as the cheetah and the puma, are included in the more diverse subfamily Felinae, with its more than 30 living representatives (Wilson and Reeder 2005). Molecular phylogenetics strongly supports these two subfamilies (Johnson et al. 2006; Agnarsson et al. 2010), while there are still some uncertainties about the relationships within them.
Understanding how this fascinating family radiated goes beyond the boundaries of a mere phylogenetic reconstruction, as we need to understand not only the relationships among living and extinct species but also how the extraordinary adaptations of this lineage evolved. Despite being fairly diverse as a mammalian family, as well as disparate in terms of body size, their morphology is rather conserved (see introductory paragraphs of Sicuro and Oliveira 2011, and references therein). The aspect of the head is almost unmistakable, with short and wide faces allowing strong bites to hold and kill preys (Nowak 2005; Sicuro and Oliveira 2011; Meachen-Samuels and Van Valkenburgh 2009a, b). However, even in closely related species, large differences in size are typically accompanied by differences in shape, because of allometry, or the covariation of size and shape (Klingenberg 2016). Allometry, although it may not always be present, is a pervasive aspect of morphological variation in mammals and many other animals.
A focus on craniofacial variation showed that closely related species of mammals often present a common trend, so that smallest species tend to be short-faced and largest ones have proportionally longer faces (Cardini and Polly 2013; Cardini et al. 2015a). So far, this has been shown in four lineages of placentals (African antelopes, squirrels and fruit bats, and also mongooses—Cardini and Polly 2013), belonging to different orders, as well as in kangaroos (Cardini et al. 2015a). Preliminary evidence (Cardini 2016) suggests that the pattern, named CREA, from the abbreviation of ‘cranial evolutionary allometry’, may be found also in several other orders of placentals. Recently, researchers suggested that falconiformes (Bright et al. 2016) and galliformes (Linde-Medina 2016), among birds, might also show a somewhat similar trend of craniofacial variation, although the evidence is still inconclusive in galliformes. If really widespread, and almost a rule of morphological evolution at least in mammals, the significance and explanation of this pattern is elusive and has tentatively been linked to developmental constraints and/or biomechanical requirements (Cardini and Polly 2013).
Regardless of the processes behind CREA, it is for now important to accurately assess the evidence for it in as many lineages as possible. As the putative ‘rule’ holds within a group of closely related species characterized by interspecific size differences, felids, or their subfamilies, are a promising taxon in which to test it. Indeed, if a short face is a biomechanical adaptation for an efficient predation, we might expect that a trend towards proportionally longer faces in bigger species might be absent or weak. Is that the case? Also, given the large differences in body mass and ecology, is there a difference in allometric patterns between the two subfamilies?
Previous work on cranial morphology in felids suggested that the the face grows faster than the braincase during ontogeny (Segura et al. 2013, 2016) and that larger species do tend to be long-faced (Slater and Van Valkenburgh 2008; Sicuro 2011). However, those studies did not have a specific focus on assessing the CREA pattern, and, for instance, said little on braincase size and did not test the sensitivity of results to the way relative proportions of cranial regions were measured. Also, both studies performed only univariate analyses using comparative methods, thus potentially missing important shape information, and did not test differences between subfamilies. In order to more specifically answer if CREA occurs in felids and how it may vary between subfamilies, we collected digital pictures of ventral crania of the majority of species from databases and articles available on the internet. Using these data, and both landmark-based multivariate Procrustean geometric morphometrics (PGMM; Cardini 2013; Adams et al. 2013) and traditional morphometrics (TMM; Marcus 1990) based on linear distances, we first estimated the occurrence and strength of craniofacial allometry in the entire family as well as in each of the two living felid subfamilies. We then compared allometric patterns, if present, between the two subfamilies using all sets of data. Finally, we explored whether allometric patterns were consistent with the predictions of the CREA ‘model’: the visualization of GMM allometric trajectories (i.e., the predictions of the multivariate regression model) should suggest an evident increase in prognathism in larger species at the expense of relative basicranial length. Similarly, using the length of the snout in relation to that of the cranial base, we should find a significant positive allometric relationship (i.e., the snout becoming relatively longer). In all analyses, regressions were replicated using comparative methods (Monteiro 2013), and the sensitivity of results to the choice of the evolutionary model was explored.
Materials and Methods
Materials: Specimens and Landmarks
Pictures of crania in ventral view were taken from Wilting et al. (2011), Sims (2012) and the following online sources:
-
http://1kai.dokkyomed.ac.jp/mammal/en/family/felidae.html (Takahashi et al. 2006).
All individuals were adults, as assessed by the complete dentition and the fusion of sutures (including parietals, in pictures showing dorsal views, when available).
Sample composition is detailed in Table 1. For each species, a minimum of one specimen was used and both sexes were measured when possible. When sex information was not available, specimens were only included in analyses done regardless of potential sex differences. Using a single (or a few) individual(s) to represent a species is considered adequate in a macroevolutionary analysis involving large interspecific and intergeneric differences (e.g., Drake and Klingenberg 2010; Meloro and O’Higgins 2011). When more than one specimen was available, size and shape data were averaged (within species, using pooled-sex samples, or within species and sex, in analyses with separate sexes - see below).
Corresponding (‘homologous’) anatomical landmarks were digitized on all specimens in TPSDig (2.26—Rohlf 2015) by the same person (DT). The landmark configuration is shown in Fig. 1, definitions of each landmarks are provided in Table 2, and landmark data can be downloaded as a txt file (online-only supporting information). Analyses done using all 20 landmarks and also repeated including only a subset of seven landmarks (7L configuration). The seven landmarks are one, four, six (on the midplane), and 9–10 and 17–18 (paired bilateral landmarks). This subset was selected as it captures more specifically the relative proportions of the face (landmarks one, four, 9–10) and the braincase (landmarks four, size, 17–18) in ventral view. Finally, to focus even more narrowly on the main aspect of CREA, which is the relative lengths of these two anatomical regions, the length of the palate and that of the basicranium were measured using distances between, respectively, landmarks one and four and four and six. For brevity, these interlandmark distances will be called snout/face and basicranial lengths.

Landmark configuration: left wild cat (Field Museum specimen 93,874, from http://emuweb.fieldmuseum.org/web/pages/common/imagedisplay.php?irn=722741&reftable=ecatalogue&refirn=2592744) with the total configuration wireframe; right lion (DKY_0652 from http://1kai.dokkyomed.ac.jp/mammal/images/large/panthera/DKY_0652I.jpg) with the 7L wireframe. The white bar is ca. 10 cm
Geometric Morphometrics
Size and shape data were obtained from the Cartesian coordinates of anatomical landmarks using Procrustes-based geometric morphometrics (PGMM—Adams et al. 2004, 2013; Cardini 2013). Size was estimated as centroid size, the square root of the sum of squared distances of landmarks from their centroid (or barycenter). Thus, cranial centroid size, which, for simplicity, we will often call just size, measures, in each individual, the dispersion of a specific configuration of landmarks around its bary-center: if most landmarks are distant, centroid size will be big; if most of them are close to each other, then centroid size will be small. As it is a sum of distances, it is obvious that the same centroid size can be obtained from, for instance, a long but narrow structure and a short but wide one, both measured using the same landmarks. Thus, contrary to simple TMM (Marcus 1990) measurements, such as condylo-basal length, centroid size provides an overall estimate of size, but not one that can be unequivocally and simply referred to a specific feature. However, it is the most used metric in PGMM allometric analyses (Klingenberg 2016), as it relates precisely to the same anatomical landmarks used to estimate shape.
In PGMM, shape is obtained by the standardization of size (division of the original raw landmark coordinates of each specimen by its centroid size), removal of translational variation (superimposition of centroids of all specimens) and minimization of rotational differences (least-square minimization of the sum of squared distances of corresponding landmarks in a sample). The whole procedure, known as Procrustes superimposition (Rohlf and Slice 1990), is now the main approach employed to estimate size and shape in geometric morphometrics. This is because of the desirable statistical properties of the data space it generates (Adams et al. 2004, and references therein). Since the Procrustes shape space is curved, it must be projected (using a projection similar to those employed by cartographers) into a flat Euclidean space to aid statistical analyses, most of which require that differences between any two observations (i.e., specimens) can be measured using a straight line between the two points in the multivariate data space. The goodness of fit of the Euclidean space approximation to the Procrustes shape space is assessed by computing the correlation of Euclidean distances to the original Procrustes shape distances in the curved space. If the tangent space approximation is appropriate, the distances in the two spaces should be virtually identical and the correlation almost equal to one. This computation was done in TPSSmall (version 1.32, Rohlf 2015).
PGMM also allows to partition asymmetric and symmetric components of shape variation (Klingenberg et al. 2002). Because the small asymmetries typical of mammalian crania (Cardini 2017) were not relevant for our aim, following the guidelines of Klingenberg et al. (2002), they were discarded. Thus, all main analyses focused only on the symmetric component of shape variation in felids.
The last step in a PGMM analysis is the visualization of shape differences. This can be achieved using a variety of shape diagrams (Klingenberg 2013, and references therein). In this study, we used simple wireframe diagrams built by connecting landmarks with straight lines (called links) to help seeing the structure being measured by a specific configuration of anatomical points. If lines in a wireframe are allowed to bend according to the thin-plate spline interpolation (as in our study), ‘soft-wireframes’ can be drawn, whose appearance is often more appealing than using the usual straight links (Klingenberg 2011, 2013, and references therein).
All PGMM analyses, including the visualization, were performed in MorphoJ (version 1.06d, Klingenberg 2011).
Measurement Error
Digitizing error (i.e., the repeatability or precision of the landmark configuration) was estimated and compared to species differences in the felid sample. Landmarks were digitized twice with a 1 week interval between the first and second digitization. These replicas were used to assess landmark precision following the protocol of Viscosi and Cardini (2011—see also Fruciano 2016). Differences among individuals (estimated by averaging replicas) should be much larger than measurement error (here, just digitizing error, estimated by differences between replicas). To assess the magnitude of individual differences relative to digitizing error, sum of squares of each factor were computed for size and shape using a hierarchical ANOVA in MorphoJ (Klingenberg 2011). Also, for size, the correlation between the two replicas was computed, and, for shape, replicas were analysed using a paired group cluster analysis based on Euclidean distances in PAST (Hammer et al. 2001). If differences between replicas are negligible, the expectations for size are that the correlation between centroid sizes from the first and second replicas should be very close to one, for shape, that replicas should cluster together in pairs, ‘within individuals’, with different individuals well separated.
Other components of measurement error could not be directly assessed using images taken from internet databases. These include errors related to differences in the positioning of the scale factor and the specimens in the pictures, and also the two-dimensional approximation of a 3D structure. For the scale factor, which is typically a ruler placed next to the cranium in the picture, the rulers were generally approximately placed in the same relative position. For the orientation of the specimens, pictures of mammals ventral cranial views are approximately standardized, as operators position crania so that the palate is roughly parallel to the lens of the camera.
Nevertheless, small differences may be present both in the positioning of the scale factor as well as in that of the specimens. To provide an approximate assessment of how photographic and scaling error might impact our analysis, as well as to assess if centroid size was a good proxy for a more standard measure of cranial size and for body mass, we computed correlations between average species cranial centroid size, estimated using all landmarks, and published information on cranial length (Randau et al. 2013) and body mass (Nowak 2005; Sanderson and Watson 2011). Correlations within the whole family, but also within subfamilies, were computed regardless of sex to maximize the number of species included. If the correlation were high, despite all potential sources of errors (i.e., positioning of specimens and scale factors, but also flattening of the third dimension, sampling error and the fact that both cranial length and body mass from the literature were not measured on the same specimens we had pictures of), it seems safe to conclude that those errors were also negligible relative to the magnitude of size differences among felids.
As anticipated, another source of measurement error we could not directly estimate is the loss of information because of the flattening of a 3D structure in 2D pictures (Cardini 2014). However, Cardini (2014) has shown that, as long as 2D landmarks are relatively coplanar, the flattening is likely to be negligible. As Cardini’s (2014) analyses focused on intraspecific/intrageneric differences, the inaccuracy due to the loss of information in the third dimension is most likely to be negligible in our dataset, where differences are above species and, very often, even above genus levels.
Allometric Regressions Using PGMM
For the PGMM analysis, evolutionary allometry was tested, using species means, by regressing shape coordinates onto the natural logarithm of centroid size. Using the logarithm of size is often useful when the range of size is large (Klingenberg 2016, and references therein). All regressions were performed using all landmarks and the 7L subset of landmarks. Also, regressions in the total sample regardless of sex were later replicated using separate sexes. Separate sex analyses were performed to test the sensitivity of results to the effect of sexual dimorphism, which is likely to be present especially in the largest species, although probably generally smaller than interspecific differences. Regressions were also replicated within subfamilies. These analyses were done because previous studies of CREA (Cardini and Polly 2013; Cardini et al. 2015a) were mostly done below the family level, and also because Felinae and Pantherinae are known to have some differences in cranial morphology (Sakamoto and Ruta 2012), despite the generally conserved cranial shape of all felids. Subfamilial analyses were performed without separating sexes in order to maximize taxonomic sampling by including as many species as possible.
Multivariate regressions were performed using both ordinary least squares (OLS) and comparative methods. Comparative methods take into account the non-independence of species due to the phylogenetic hierarchy (Monteiro 2013, and references therein). To estimate the phylogeny of the living species of the Felidae we used one of the most recent molecular chronograms, downloaded from the 10Ktrees website (http://10ktrees.fas.harvard.edu; Arnold et al. 2010) and based on both mitochondrial and autosomal DNA sequences.
Comparative analyses were performed using phylogenetic generalized least squares (PGLS) and a Brownian motion (BM) evolutionary model in geomorph (Adams and Otárola-Castillo 2013; Adams et al. 2016). These same regressions were also repeated in MorphoJ (Klingenberg 2011) using phylogenetic independent contrasts (PICs). The two methods, PGLS and PICs, are equivalent (Rohlf 2006), but they are implemented in the two programs using different permutational approaches to test the significance of the regressions. Adams and Collyer (2015) showed that their PGLS approach should be more correct. However, as briefly discussed by Pearson et al. (2015), differences between the two methods may also relate to slightly different ways of framing the null hypothesis. Thus, although PGLS analyses in geomorph will be used as the main source of results, PICs regressions in MorphoJ will be briefly mentioned as well, and their results emphasized if any incongruence between the two approaches is found.
A number of evolutionary models have been proposed as alternatives to the simple BM model, that assumes a proportionality between trait divergence and evolutionary time. Some of these may require very large numbers of species to be accurate (Boettiger et al. 2012; Cooper et al. 2016) and indeed it has been suggested (Jhwueng 2013) that, for less than 100 species, at least in univariate analyses, there could be little reason to explore alternatives to BMs, as they tend to perform equally well and produce congruent results. However, to provide a simple preliminary assessment of the sensitivity of results to models other than BM, we repeated PGLS regressions after modifying branch lengths either by setting all branch lengths to unit (equivalent to a punctuated equilibrium model, where change occurs only during speciation events), or, following the example of Díaz-Uriarte and Garland, (1998), by changing Grafen’s rho. As this parameter is increased, starting from an initial value close to zero, the original 10Ktrees chronogram changes its shape from a tree with an early radiation model (quasi-star radiation) to one with just a few long branches and very recent radiations of most present species (Fig. 2).

Original 10Ktrees time tree, used for the BM comparative analyses, and same topology with branch lengths modified (unit length or variable Grafen’s rho) to test the sensitivity of comparative methods to different evolutionary models
Thus, overall, the following battery of regressions was performed, which test the same hypothesis (the relationship between mean species shape and size, i.e. evolutionary allometry), while assessing the sensitivity of results to different factors (sex, taxonomy and phylogeny, and the selection of landmarks): I) total sample with pooled sexes using both an ordinary least square (OLS) and comparative methods (PIC–PGLS) on data from either the complete or the seven landmark (7L) configurations; II–V) the same four regressions (i.e., OLS or PIC–PGLS using all landmarks or the 7L dataset) using only females (II), males (III) or, regardless of sex, species in the Felinae (IV) and in the Pantherinae (V). Overall, therefore, 20 regressions were run and their significance assessed using both a conventional 0.05 threshold, as well as a much more conservative 0.05/20 = 0.0025 Bonferroni-corrected one. In the first case, tests will be said to be significant, and, in the second one (i.e., after Bonferroni correction), to be highly significant.
The visualization of opposite extremes of the allometric trajectories were done in MorphoJ (Klingenberg 2011) using the two main models (OLS and BM PGLS/PICs). However, to further quantitatively explore the congruence of allometric trajectories based on different regressions, correlations between the BM PGLS vector of regression slopes (chosen as a ‘reference’) and those of all other regression models were computed in R (2016). For the two subfamilies, whose samples are independent, as they include mutually exclusive sets of species, the magnitude of the divergence of allometric trajectories was also tested using the OLS and BM PICs models (i.e., Felinae OLS slopes vs. Pantherinae OLS slopes, and similarly for the PICs slopes). This was done in MorphoJ (Klingenberg 2011) using an exact test for the null hypothesis that vectors have random directions in the tangent shape space, as in Cardini and Polly (2013). Because overall the same hypothesis (random direction of vectors) was tested four times, in this case the Bonferroni corrected threshold for high significance was 0.0125 = 0.05/4.
Allometric Regressions Using Snout Versus Basicranium Lengths
Finally, narrowing the focus even more specifically than in the 7L configuration, we regressed the length of the snout onto that of the ventral view of the braincase (i.e., the basicranial length) to assess their relative variation using the simple traditional morphometric approach of Huxley–Jolicoeur (Klingenberg 2016, and references therein). These two lengths capture the main aspect of CREA, as described in ventral cranial views. Another important aspect of CREA, the propensity of the braincase in smaller species to become more globular and less dolichocephalic (Cardini and Polly 2013) could not be measured in ventral view, as this feature cannot be quantified without landmarks, and possibly semi-landmarks, on the cranial vault.
Thus, interlandmark distances between landmarks one and four (snout/face length) and four and six (basicranial length) were computed from raw data and log-transformed, and the former was regressed onto the latter using a major axis (MA) regression (Warton et al. 2006). The analysis was done using species means regardless of sex, to increase power by including all species, and repeated within subfamilies using both a simple ‘non-comparative’ MA regression, as well as one which takes phylogeny into account using PICs and the same range of evolutionary models as in the PGMM analyses. The MA regression was selected as the relationship between the two variables is symmetrical, they use the same unit of measure and are both likely to have similar amount of errors (unlike geometric morphometric data, where size and shape have different units of measures and centroid size generally is more accurate than shape both in terms of sample mean estimates and measurement error—Cardini et al. 2015b).
PICs were computed using ape (Paradis et al. 2004) and MA regressions using smatr (Warton et al. 2012). smatr was used also to test if slopes of the regressions within subfamilies were equal. This test was performed in smatr without taking phylogeny into account (‘non comparative’ MA), because a comparative test was not available, and could not be done using PICs, as in the within taxon analyses. However, results are likely to be similar using slopes estimated with comparative methods, as regression coefficients of the two subfamilies were on average the same (see “Results”).
Results
Preliminary Analyses
The tangent shape space approximation was excellent, with a correlation between distances in the tangent and Procrustes spaces virtually equal to one. Asymmetry accounted for only 2% of total shape variation (1.3% using the seven landmarks configuration), and was thus discarded in all main analyses, which only employed symmetric data.
Landmarks were generally precise. The percentage of total sum of squares accounted for by digitizing error was less than 0.1% for size regardless of the configuration (total or 7L) and 5% (all landmarks) or less (7L) for shape, with individual differences across species always being highly significantly larger than error. The correlation of centroid size between replicas was virtually 1 (>0.999). Out of 59 specimens digitized twice, 53 individuals (90% of total) clustered together with their replicas in a UPGMA cluster analysis (81% using the 7L configuration). If the same analysis was repeated after computing species mean shapes (species means of the first replicas versus those from the second replicas), 26 out of 27 (96% of total; 85% using the 7L configuration) of species means correctly clustered ‘within species’.
Species mean centroid size (pooled sexes, all landmarks) was highly correlated with data from the literature for both cranial length (r = 0.978) and body mass (r = 0.944). High correlations for these variables were found also within subfamilies (centroid size vs. respectively cranial length and body mass: Felinae r = 0.957–0.927; Pantherinae r = 0.921–0.941), and using the natural logarithm did not appreciably changed the correlations (r ≥ 0.939).
Evolutionary Allometry: Geometric Morphometrics
Results of OLS and BM PGLS regressions of species means (Table 3) using pooled sexes in the whole family or its two subfamilies, as well as using separate sexes, were largely congruent and mostly significant (80%) or highly significant (50%). These percentages refer to results using geomorph’s PGLS permutation tests, but were generally in very good agreement with MorphoJ’s permutations based on PICs. Non-significance was mostly limited to some of the regressions in the smallest samples (within sex analyses and Pantherinae sample).
R2s of OLS were generally higher (mean: 31%; range: 23–44%) than those of comparative analyses using the BM model (mean: 22%; range: 12–38%). However, within dataset (i.e., a given sample with its specific landmark configuration), the visualization (Fig. 3, as an example, using all species, pooled sexes and both the total and reduced landmark configurations analysed with OLS and BM comparative methods) suggested highly congruent patterns of allometric shape change, regardless of whether ordinary or comparative methods were employed. This was supported by the results of the sensitivity analyses in relation to the choice of regression model (OLS and comparative methods based on BM or other evolutionary models). Findings within each dataset were robust with a modest variation in R2 estimates (Fig. 4). For instance, in the total pooled-sex sample using all landmarks, the average R2 of all regressions was 26% with a minimum of 21% and a maximum of 34%, whereas in the total male sample, which showed the largest range of R2 variation relative to the mean, the average was 18%, the minimum 10% and the maximum 28%. Vectors of slope regression coefficients were also highly correlated, as indicated by the small angles (Fig. 5) they formed relative to the BM—PGLS vector, used as a reference (within dataset mean angles—corresponding to the solid line in Fig. 5—minimum to maximum range: 13–23°). Thus, regardless of the regression model, allometric trajectories estimated for a given dataset all pointed in similar directions and therefore suggested congruent patterns.

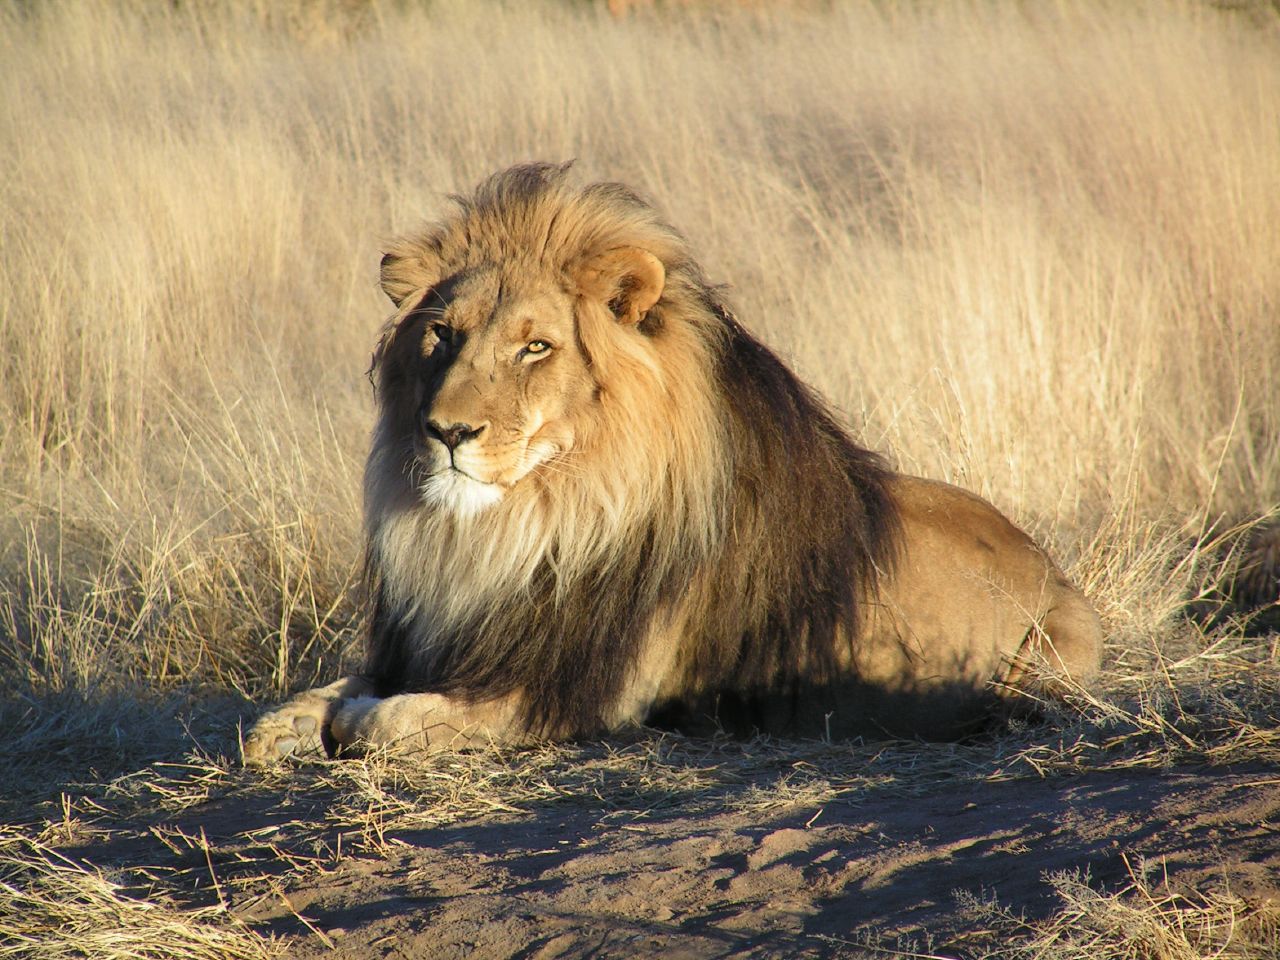
Pattern of allometric shape variation in the pooled-sex total sample using OLS and BM comparative methods and both configurations (opposite extremes of the allometric trajectories visualized using soft wireframes magnified ca. three times and exemplified using cropped pictures of a lion by Kevin Pluck and a Geoffroy’s cat by Arjan Haverkamp, licensed under the Creative Commons Attribution and downloaded from respectively https://upload.wikimedia.org/wikipedia/commons/7/73/Lion_waiting_in_Namibia.jpg and https://commons.wikimedia.org/wiki/File:Geoffroy's_cat,_female.jpg). In this and the next figures (6–7) on allometric patterns, the scatterplot of shape regression scores versus centroid size values (Klingenberg 2011) is shown only for the OLS regression using all landmarks, as an example

Profile plot showing the sensitivity of multivariate R2 estimates (mean, solid line, and minimum–maximum range, dotted lines) to the type of regression model being used (OLS or comparative using different evolutionary models) for the PGMM analyses

Same type of profile plot as in Fig. 4 but now used for showing the sensitivity of allometric patterns to the type of regression model: the variability in patterns is quantified using the correlations (expressed as angles in degrees) between the BM–PGLS vector of regression coefficients and those of any other model (OLS, and comparative ones using evolutionary models other than BM)
If results are compared across datasets (samples and landmark configurations), with the exception of the Pantherinae, allometric patterns were largely congruent and suggested the type of trend predicted by CREA: as exemplified by the diagrams for the whole family, which were very similar to those of the Felinae (not shown), smallest species tended to be short-faced while largest ones showed longer faces and proportionally shorter basicrania (Fig. 3). The congruence of patterns in all datasets of the Felidae and Felinae, was supported also by the small angles (average: 23°; range: 13–33°; Table 3) of slope regression vectors of each dataset compared to the total pooled-sex sample. The Pantherinae represented an exception to the general pattern. In Fig. 6, CREA no longer seems as obvious as in the analyses of the family as a whole or in those of the Felinae. This is especially evident in the OLS wireframe diagrams for the opposite extremes of the allometric trajectory using all landmarks, which showed apparently longer faces in the smaller Neofelis species compared to the much larger leopard, tiger and lion. This appearance was largely a consequence of the longer maxilla in the smallest Pantherinae. In fact, in the largest species, the palate was about as long as in the smallest ones but contributed less to making the face look longer, because almost a third of its length was due to a prominent backward extension of the palatines, well beyond the posterior end of the toothrow.

Pattern of allometric shape variation in the Pantherinae using OLS and BM comparative methods, and both configurations (opposite extremes of the allometric trajectories visualized using soft wireframes magnified ca. three times and exemplified using cropped pictures of a lion, as in Fig. 3, and a clouded leopard by Vearl Brown, licensed under the Creative Commons Attribution and downloaded from https://en.wikipedia.org/wiki/Clouded_leopard#/media/File:Clouded_leopard.jpg)
That the allometric pattern of the Pantherinae somewhat deviates from a simple CREA pattern was also confirmed by comparing the Pantherinae slope regression vectors with those of either the total felid sample (both subfamilies, pooled-sexes) or the Felinae alone. In the first case (Felidae vs. Pantherinae), angles were fairly large (average: 45°; range: 30–57°; Table 3) and definitely larger than between felids as a whole and the Felinae, whose largest angle was 33°. In the second case, the comparison of Pantherinae and Felinae, angles were even larger (range: 42–62°), despite showing less divergence than expected by chance in three out of four dataset comparisons. Overall, this indicated some correlation but also a degree of divergence in the evolutionary allometric patterns, as already suggested by the visualization (Fig. 6).
Evolutionary Allometry: Traditional Morphometrics
All (family and subfamilies) MA regressions were significant (Table 4) and all but one still significant after an over-conservative (P < 0.0013) Bonferroni correction for 39 tests (i.a., MAs at all taxonomic levels and using all evolutionary models). R2 ranged between ca. 84 and 96%, with small differences in relation to the taxonomic level of the analysis.
Slopes were always larger than 1 (minimum to maximum range: 1.17–1.31). In the Felidae, all slopes were significantly larger than 1 and in little less than 50% of the regressions they were significant even if Bonferroni corrected using the 0.0013 significance threshold. In the Felinae, ca. 60% of regressions were significant, but none if Bonferroni corrected. Finally, in the Pantherinae, no regression was significant.
The average MA slope (averaged over all 13 regressions within each subfamily) in both the Felinae and Pantherinae was 1.17. Using the simple ‘non-comparative’ MA, slopes were respectively 1.18 and 1.19, and the null hypothesis of equal slopes in the two subfamilies was not rejected (likelihood ratio = 0.00257, with one degree of freedom, P = 0.9596).
Discussion
The main aim of this study was to specifically test whether craniofacial evolutionary allometry in the felids follows the CREA ‘rule’ suggested by previous studies in lineages of placentals, as well as in kangaroos and birds (Cardini and Polly 2013; Cardini et al. 2015a; Bright et al. 2016; Linde-Medina 2016). Felids are relevant not only because they are a charismatic group, and the focus of a great number of evolutionary studies, but also because they are short-faced if compared to most other Carnivora and, more generally, most other mammals. Thus, besides testing the validity of the ‘rule’ (or the lack of it) in another taxonomic group, assessing CREA in felids is particularly interesting as the lineage, with its fairly homogeneous head morphology, may have evolved under a strong pressure to keep the face short and thus maintain a biomechanical advantage in delivering powerful bites to hold and kill their preys. This pressure could have limited the putative propensity of larger species to have relatively longer faces, because in fact larger species (defined as those bigger than 21.5 kg, sensu Carbone et al. 1999) often take proportionally bigger preys (Sicuro and Oliveira 2011), and may therefore need even more robust skulls (Slater and Van Valkenburgh 2009).
Preliminary Considerations on Accuracy
Cranial centroid size estimated using landmarks on ventral view pictures has proven to be an excellent proxy at family and subfamily levels for both cranial length and body mass reported in the literature. This happened despite a number of potential sources of errors such as the loss of information in the third dimension (Cardini 2014), the heterogeneity of the photographic sources and possible mistakes in taxonomic identification, small differences in the orientation of the crania and different positions of the scale factor in the pictures, as well as the small sample sizes. Besides, heterogeneity in sex composition, as well as variability related to the geographic provenance of the specimens, also likely contributed to inflate inaccuracy in species estimates. Indeed, all these issues, if they really had important consequences at the macroevolutionary level of our study, should make highly unlikely that we find very good correlations between our estimates of size (using ventral crania centroid size) and those based on cranial length and body mass taken from the literature. However, we did find high correlations, showing that size is accurately captured by the data.
Shape accuracy is also likely to be good. Estimates of species mean shapes can be strongly affected by sampling error (Cardini and Elton 2007; Cardini et al. 2015b). However, as for size, in a macroevolutionary analysis at familial/subfamilial levels, with 13 different genera out of a total of 27 species available for the study, and a range of sizes spanning two orders of magnitude, interspecific shape differences are likely to be mostly so large to be fairly accurately described by using just one or a few specimens per species. In this respect, the analysis of the Pantherinae may have to be interpreted with more caution, because the subfamily is composed of only seven living species and just two genera.
Although results seem robust and are largely congruent, we decided to further explore the impact of sample composition and taxonomic sampling by using a leave-one-third-out jackknife approach. This is briefly mentioned in this section of the Discussion not to distract readers from the main analyses presented before. The jackknife was designed so that potential sampling issues were made even more serious by randomly selecting only two-thirds of the species, with each species represented by a single randomly selected specimen from the original sample. The resampling procedure was repeated 1000 times within each group, but only applied to the Felidae and Felinae, as the Pantherinae comprises too few species. Each block of 1000 randomized jackknifed samples was then analysed as in the main study (i.e., by regressing shape onto log-size, using all or just seven landmarks, as well as both ‘standard’ and comparative methods; and by doing the same using snout and basicranial lengths). Thus, overall, twelve sets of 1000 jackknives were created to assess the sensitivity of regression slopes and the robustness of CREA. For major axis regressions, we summarized the results by computing the 2.5th–97.5th percentiles of the regression slopes. These ranged from 0.99 to 1.42 in the Felidae and from 0.92 to 1.46 in the Felinae, thus showing that the vast majority of regressions consistently suggest slopes bigger than 1. For geometric morphometrics, we computed the 95th‰ of the distribution of angles between the jackknifed regression vectors the the corresponding vector estimated using species means (i.e., those shown in Table 3). 95% of jackknifed angles were ≤27.0° in the Felidae and ≤39.6° in the Felinae, which suggest that allometric trajectories are approximately pointing in the same direction of the CREA pattern described using species means.
Overall, therefore, even when taxonomic sampling is reduced of one-third, and a single specimen is used for each species, analyses largely supported positive evolutionary allometry for the snout relative to the basicranium. In fact, probably even more important than the considerations on accuracy and sampling, it is useful to stress that the evidence in our study refers exclusively to the ventral view of the cranium. Thus, although we may be loosely talking about braincase and facial (or snout) morphology, in fact we are more specifically referring to the palate and basicranium. For these specific regions, we can confidently say that the CREA pattern is robust. However, whether the same patterns will be found on the dorsal side and, even more accurately, using 3D landmarks and semilandmarks over the entire cranium, is something that will have to be assessed in future studies but seems likely based on previous work, at least for facial elongation (Slater and Van Valkenburgh 2008; Sicuro 2011).
CREA Pattern: Real or Artifact?
Having clarified the main limits of our work, it seems safe to conclude that, overall, the support for CREA in the Felidae is strong: allometry is important, larger species have proportionally longer snouts and shorter basicrania, and the results are robust to the choice of the regression model (OLS or comparative, using BM or a range of other evolutionary models). Also, findings are confirmed in split-sex analyses, despite the reduction in statistical power when females and males are analysed separately. Findings are supported both using the larger landmark configuration, as well as the 7L set of landmarks, which more narrowly focuses on the relative lengths and widths of the face and braincase in ventral view. Finally, that the face becomes proportionally longer than the basicranium in bigger felids is shown in all traditional morphometric analyses, suggesting on average a relative increase in facial length of 20% or more compared to the cranial base.
This last findings is important, as Linde-Medina (2016) suggested that CREA measured using PGMM may be an artefact of the size standardization in the Procrustes superimposition. In her analyses of galliformes, she found a striking contradiction between PGMM allometric shape diagrams, supporting CREA, and her MA regression of beak onto braincase centroid size, showing the opposite (i.e., the beak becoming smaller in larger birds). In contrast, in our analysis, results from PGMM regressions and MA using snout and basicranium lengths are largely concordant, and would be so even if centroid size, instead of lengths, had been used (see below). It is possible that the discordance in the two types of analyses in galliformes arose because centroid size captures total size of the beak and braincase without a focus on the main specific aspects of CREA (relative lengths of face versus braincase, and braincase narrowing/globularity), aspects which, in contrast, are most evident in the PGMM visualization of multivariate shape allometry (Linde-Medina 2016, Fig. 3b, c, p. 1876). In this respect, it would be interesting to repeat the MA regression in galliformes using beak and braincase lengths to see if results are in agreement with geometric morphometrics analyses of shape data or in contrast support the finding using centroid size of those two anatomical regions.
Although the focus on the most salient features of CREA would be lost, one could also do the opposite and, using our data on felids, repeat MA regressions employing centroid sizes based on snout and basicranial landmarks. This would require excluding landmark 13–14, which are somewhat in between the face and braincase, while including landmark 4 in both the snout and basicranium, as it is fundamental to capture relative lengths. When we did this ‘experiment’, we found that even using these estimates of relative size of the two regions, contrary to findings of Linde-Medina (2016) in galliformes, results (not shown) were fully congruent with the interpretation of the shape diagrams for the evolutionary allometric trajectories. Analysing the whole family, the slope was consistently larger than one, confirming that overall the snout is proportionally bigger than the basicranium in larger felids (slope minimum to maximum range = 1.10–1.15). Positive allometric slopes were also found in the Felinae (range = 1.09–1.13). However, when the Pantherinae were analysed, slopes, although still larger than one (range = 1.02–1.27), became somewhat more variable and often close to one (<1.1, 61% of the times), but increased again (range = 1.14–1.26) if Panthera was analysed on its own, after excluding Neofelis. Thus, even using Linde-Medina’s (2016) approach, we can be confident that the pattern is real, although less pronounced in the Pantherinae.
Are Pantherinae Different or is it Just Neofelis to be Unusual?
Despite the general congruence in findings from all analyses, one minor discrepancy seems to be that the support for CREA in the Pantherinae is ambiguous using PGMM data but strong using traditional lengths measures. This is the opposite than predicted by Linde-Medina (2016), if CREA was an artifact of PGMM analyses. In fact, the ambiguity in the visualization is probably simply due to the fact that the palate elongation in the larger pantherines does not produce the appearance of a longer face, because it mostly occur behind the end of the toothrow. The pattern of the Pantherinae is, nevertheless, somewhat unusual and seems to be largely driven by the influential effect of the two species of Neofelis, the smallest representatives of the subfamily, as well as the only ones which do not belong to Panthera. If Neofelis is excluded, and the analyses repeated within Panthera only, CREA becomes again evident (Fig. 7), as leopards are relatively short-faced in ventral view compared to lions and tigers.

Pattern of allometric shape variation in the Panthera (i.e., after excluding Neofelis from Pantherinae) using OLS and BM comparative methods, and both configurations (opposite extremes of the allometric trajectories visualized using soft wireframes magnified ca. six times and exemplified using cropped pictures of a lion, as in Figs. 3, 6, and a leopard by Tamar Assaf, licensed under the Creative Commons Attribution and downloaded from https://commons.wikimedia.org/wiki/File:Persian_Leopard_sitting.jpg)
Neofelis is less well known than most other pantherines and certainly atypical for being the living felid with proportionally longest canines, as well as for other cranial features, including an elongated and relatively narrow skull (Werdelin 1983; Sicuro 2011; Sicuro and Oliveira 2011). Christiansen (2008) even suggested that Neofelis not only shows a clear divergence from other great cats, but actually might have some similarities with sabercats. It is therefore possible that this genus may have strongly influenced results in a subfamily that includes only seven extant species. The small number of species, and thus the low statistical power, is also the likely reason why many regressions in the Pantherinae did not reach significance despite large R2s. Especially in cases such as this, but more generally in all analyses of CREA, the inclusion of fossils might contribute to increase taxonomic sampling and make results more accurate. Besides it might help to map changes in CREA over evolutionary history and potentially relate deviations from the main pattern to specific ecological adaptations. However, with fossils, the use of comparative methods will be less simple, as their phylogenetic position needs to be accurately estimated using evidence independent on cranial morphology, and that is likely to be missing for many species.
Sensitivity Analyses, and a Few Considerations on the Other Main Aspect of CREA
In terms of methods, the general good congruence between comparative regressions using different evolutionary models is consistent with studies suggesting that comparative methods are fairly robust to violations of the Brownian motion model of evolution (Garland et al. 1999; Jhwueng 2013). Also, although the comparisons of slopes between subfamilies were done using only the main regression models (OLS and BM-PICs for PGMM, and the ‘non-comparative’ MA for snout and basicranial lengths), results are likely robust to the choice of evolutionary model, as estimates of slopes were fairly similar in all regressions. Slopes of PGMM regressions support differences in allometric patterns between Felinae and Pantherinae, accordingly with the differences seen in the visualization (especially the one using the full landmark configuration). However, the test of slope regression vectors indicates that, in most cases, similarities in allometries are still large enough to make vector angles smaller than expected by chance and, indeed, in terms of snout to basicranial lengths, slopes of MA do not differ significantly between subfamilies.
Notably, although the most evident aspect of CREA, which is the propensity of bigger species to be long-faced, is generally shown by felids, larger species do not seem dolichocephalic. In fact, they tend to have broad and long zygomatic arches in ventral views, which might contribute to make their faces look about as wide as those of smaller species and somewhat shorter than the actual length of the palate. More precisely, zygomatic arches in bigger cats almost form a straight line with the tooth-row, making almost triangular the shape of the snout from the canines all the way back to the end of the zygomatic arches. In contrast, in smaller cats, the anterior region of the zygomatic arch bulges outward forming a sharp angle with the snout, a feature which is not well captured by the landmark configuration in ventral view. Whether these differences might be adaptive is hard to say.
However, despite taking relatively smaller preys, small cats have proportionally stronger bites per unit muscle force (Slater and Van Valkenburgh 2009) and one might speculate whether their curved, and anteriorly-expanded, zygomatic arches might help in that respect by increasing the relative surface of insertion of masticatory muscles. Hartstone Rose et al. (2012) reported a positive allometry between masticatory muscle mass and body mass in medium size to large size cats: small species should have smaller muscle fibers. Such design interplays with gape. Indeed, shorter face implies smaller gapes than in turn allows to generate relatively high bite force when compared to larger taxa. Large cats sacrifice force to the ability of producing wider gapes (they also show wider muzzle and more robust canine) and compensate that with stronger forelimb apparatus (Meachen Samuels and Van Valkenburgh 2009a, b). Meloro and Slater (2012) demonstrated that relative canine length influence skull shape in catlike carnivorans as whole, although this effect is not detectable in conical toothed cats (the group we partially covered here). Size changes influence rostral shape changes more than braincase in conical toothed species (Meloro and Slater 2012, but see also Piras et al. 2013 on the influence of allometry on mandible shape), thus supporting to a certain degree the CREA pattern also when fossil felids might be included. In contrast, sabertooth cats exhibited stronger association between rostral shape and relative canine length only (Meloro and Slater 2012), thus suggesting a potential departure from CREA. The developing dentition and its function might definitely influence CREA pattern and a proper quantification of tooth size and volume might be required to address this issue not only in felids but in mammals in general.
Another issue to better characterise CREA involves the interpretation of mammalian skull in three dimensions. 3D analyses might confirm the pattern we found in 2D ventral views, as suggested by Sicuro (2011) noticing that several species of small cats are round-headed, while an elongated snout is the most typical aspect of the large species of the genus Panthera. His work, as the previous 2D analysis by Slater and Van Valkenburgh (2008), did not test differences between subfamilies. Both studies used a simpler, less accurate (Adams et al. 2011; Cardini 2013), approach based on interpretations of one PC at a time. They also tested of allometry using only one PC (the first one) of shape, instead of performing a more rigorous fully multivariate analysis (Mitteroecker et al. 2013; Klingenberg and Marugán-Lobón 2013). Despite this, and the more general focus of both papers, their findings are likely to be robust and in very good agreement with ours. Thus, Sicuro’s (2011, p. 185) conclusion that “the skull patterns ‘snouted/massive’ and ‘round-headed small cats’ co-evolved with the body size differentiation along the cat lineages” strongly supports CREA in felid crania, including the tendency of smaller species to have more globular braincases.
Open Questions and Future Directions
For the future, besides broadening the study of CREA to other mammals and birds, and maybe also reptiles and amphibians, using robust data and methods, it will be important to explore of how the slope of the allometric trajectory may have changed during evolution. Indeed, general patterns such as CREA, or, for instance, the well established Bergmann’s rule (Clauss et al. 2013, and references therein), can be supported in a general sense (‘soft version of the rule’) but might show differences in magnitude and the rate of change among lineages.
Another step to better describe CREA will be to quantify how much shape variation there can be in a lineage before it crosses the boundaries of the morphospace of a specific ‘cranial bauplan’ (Cardini et al. 2015a). Until now, the taxonomic levels, at which CREA analyses have been carried out, have been decided with a large degree of approximation and mostly corresponded to differences traditionally used to define families-subfamilies or tribes and subtribes. The concept of ‘cranial bauplan’ seems intuitive, especially in groups such as the felids, but it is still poorly defined. For instance, felids have a fairly distinctive and homogeneous cranial shape among carnivores, and are clearly different compared to mongooses, civets, canids etc. How different, however, does it have to be cranial shape for a meaningful assessment of CREA? Can we be less arbitrary in deciding the taxonomic level of the analysis? A possibility might be to start exploring the issue in a broader comparative context. Using the same landmark configuration and a large number of related groups (e.g., all main lineages in a large mammalian order or superorder), one could perform disparity analyses to quantify the magnitude of the shape space occupied by progressively more inclusive groups of taxa, until a sudden change is found which could suggest different bauplane. By doing this, boundaries could be defined more rigorously and it may also be possible to assess trends that can be related to evolutionary age, ecological divergence or other factors.
Even more importantly, if CREA is confirmed in a large number of lineages and becomes a consolidated ‘rule’ of morphological evolution, biomechanical analyses and ‘evo-devo’ studies will be necessary to understand what the processes might be behind this pattern. Cardini and Polly (2013) speculated that evolutionary constraints (developmental ones, as well as in relation to metabolic and functional requirements) might play a role, while Slater and Van Valkenburgh (2009) demonstrated that allometry in larger felids contributes to make skulls stronger. Adaptive explanations, however, seem less likely when paedomorphic traits, such as short faces and more globular braincases, arise very rapidly, as it often happens in insular dwarfs (e.g., the Zanzibar red colobus—Nowak et al. 2008 —or the Dahalk gazelle; Chiozzi et al. 2014).
Finally, even if CREA was indeed a pervasive allometric trend in mammals, the ‘exception’ to the rule might prove even more interesting than the taxa following the ‘rule’. As Cardini and Polly (2013) observed, human evolution is likely to be a remarkable exception where a general trend towards larger size has been accompanied by a massive shortening of the face and enlargement of the braincase, as the need for big teeth and large jaws decreased, thanks to cooking and tool use, and our brain grew massively larger, as we rapidly moved further and further into an ecological niche dominated by culture.
References
Adams, D. C., Cardini, A., Monteiro, L. R., O’Higgins, P., & Rohlf, F. J. (2011). Morphometrics and phylogenetics: Principal components of shape from cranial modules are neither appropriate nor effective cladistic characters. Journal of human evolution, 60, 240–243.
Adams, D. C., & Otárola-Castillo, E. (2013). Geomorph: An r package for the collection and analysis of geometric morphometric shape data. Methods in Ecology and Evolution, 4, 393–399.
Adams, D. C., & Collyer, M. L. (2015). Permutation tests for phylogenetic comparative analyses of high-dimensional shape data: What you shuffle matters. Evolution, 69, 823–829.
Adams, D. C., Rohlf, F. J., & Slice, D. E. (2004). Geometric morphometrics: Ten years of progress following the ‘revolution’. Italian Journal of Zoology, 71, 5–16.
Adams, D. C., Rohlf, F. J., & Slice, D. E. (2013). A field comes of age: geometric morphometrics in the 21st century. Hystrix, The Italian Journal of Mammalogy, 24, 7–14.
Adams, D. C., Collyer, M., Kaliontzopoulu, A., & Sherratt, E. (2016). Geomorph: Geometric morphometric analysis of 2D/3D landmark data. Version 3.0.3, Retrieved https://cran.r-project.org/web/packages/geomorph/.
Agnarsson, I., Kuntner, M., & May-Collado, L. J. (2010). Dogs, cats, and kin: A molecular species-level phylogeny of Carnivora. Molecular Phylogenetics and Evolution, 54, 726–745.
Arnold, C., Matthews L. J., & Nunn, C. L. (2010). The 10kTrees website: A new online resource for primate phylogeny. Evolutionary Anthropology: Issues, News, and Reviews 19, 114–118.
Boettiger, C., Coop, G., & Ralph, P. (2012). Is your phylogeny informative? measuring the power of comparative methods. Evolution, 66, 2240–2251.
Bright, J. A., Marugán-Lobón, J., Cobb, S. N., et al. (2016). The shapes of bird beaks are highly controlled by nondietary factors. Proceedings of the National Academy of Sciences, 113, 5352–5357.
Carbone, C., Mace, G. M., Roberts, S. C., & Macdonald, D. W. (1999). Energetic constraints on the diet of terrestrial carnivores. Nature, 402, 286–288.
Cardini, A. (2014). Missing the third dimension in geometric morphometrics: How to assess if 2D images really are a good proxy for 3D structures? Hystrix, The Italian Journal of Mammalogy, 25, 73–81.
Cardini, A. (2017). Left, right or both? Estimating and improving accuracy of one-side-only geometric morphometric analyses of cranial variation. Journal of Zoological Systematics and Evolutionary Research, 55, 1–10.
Cardini, A., & Elton, S. (2007). Sample size and sampling error in geometric morphometric studies of size and shape. Zoomorphology, 126, 121–134.
Cardini, A., & Polly, P. D. (2013). Larger mammals have longer faces because of size-related constraints on skull form. Nature Communications, 4, 2458.
Cardini, A., Polly, P. D., Dawson, R., & Milne, N. (2015a). Why the long face? Kangaroos and Wallabies follow the same ‘Rule’ of cranial evolutionary allometry (CREA) as placentals. Evolutionary Biology, 42, 169–176.
Cardini, A., Seetah, K., & Barker, G. (2015b). How many specimens do I need? Sampling error in geometric morphometrics, testing the sensitivity of means and variances in simple randomized selection experiments. Zoomorphology, 134, 149–163.
Cardini, A. (2013). Geometric morphometrics. In Encyclopedia of life support systems (EOLSS), Developed under the Auspices of the UNESCO, Eolss Publishers, Paris, Retrieved http://www.eolss.net/.
Cardini, A. (2016). Why the long face? Evidence for (or against?) a new ‘rule’ in mammalian evolution. 96th Annual Meeting of the American Society of Mammalogists, Abstract Book.
Chiozzi, G., Bardelli, G., Ricci, M., De Marchi, G., & Cardini, A. (2014). Just another island dwarf? Phenotypic distinctiveness in the poorly known Soemmerring’s Gazelle, Nanger soemmerringii (Cetartiodactyla: Bovidae), of Dahlak Kebir Island. Biological Journal of the Linnean Society, 111, 603–620.
Christiansen, P. (2008). Evolutionary convergence of primitive sabertooth craniomandibular morphology: the clouded leopard (Neofelis nebulosa) and Paramachairodus ogygia compared. Journal of Mammalian Evolution, 15, 155–179.
Clauss, M., Dittmann, M. T., Müller, D. W. H., Meloro, C., & Codron, D. (2013). Bergmann′s rule in mammals: A cross-species interspecific pattern. Oikos, 122, 1465–1472.
Cooper, N., Thomas, G. H., Venditti, C., Meade, A., & Freckleton, R. P. (2016). A cautionary note on the use of Ornstein Uhlenbeck models in macroevolutionary studies. Biological Journal of the Linnean Society, 118, 64–77.
Drake, A. G., & Klingenberg, C. P. (2010). Large-scale diversification of skull shape in domestic dogs: Disparity and modularity. The American Naturalist, 175, 289–301.
Díaz-Uriarte, R., & Garland, T. (1998). Effects of branch length errors on the performance of phylogenetically independent contrasts. Systematic Biology, 47, 654–672.
Fruciano, C. (2016). Measurement error in geometric morphometrics. Development Genes and Evolution, 226, 139–158.
Garland, T., Midford, P. E., & Ives, A. R. (1999). An introduction to phylogenetically based statistical methods, with a new method for confidence intervals on ancestral values. Integrative and Comparative Biology, 39, 374–388.
Hammer, O., Harper, D., & Ryan, P. (2001). PAST: Paleontological statistics software package for education and data analysis. Paleontologia Electron, 4(1), 1–9.
Hartstone-Rose, A., Perry, J. M., & Morrow, C. J. (2012). Bite force estimation and the fiber architecture of felid masticatory muscles. The Anatomical Record, 295, 1336–1351.
Jhwueng, D. C. (2013). Assessing the goodness of fit of phylogenetic comparative methods: A meta-analysis and simulation study. PLoS ONE, 8, e67001.
Johnson, W. E., Eizirik, E., Pecon-Slattery, J., Murphy, W. J., Antunes, A., Teeling, E., & O’Brien, S. J. (2006). The late miocene radiation of modern Felidae: A genetic assessment. Science, 311, 73–77.
Klingenberg, C. P. (2011). MorphoJ: an integrated software package for geometric morphometrics. Molecular Ecology Resources, 11, 353–357.
Klingenberg, C. P. (2013). Visualizations in geometric morphometrics: how to read and how to make graphs showing shape changes. Hystrix, The Italian Journal of Mammalogy, 24, 15–24.
Klingenberg, C. P. (2016). Size, shape, and form: concepts of allometry in geometric morphometrics. Development Genes and Evolution, 226, 113–137.
Klingenberg, C. P., Barluenga, M., & Meyer, A. (2002). Shape analysis of symmetric structures: Quantifying variation among individuals and asymmetry. Evolution, 56, 1909–1920.
Klingenberg, C. P., & Marugán-Lobón, J. (2013). Evolutionary covariation in geometric morphometric data: Analyzing integration, modularity, and allometry in a phylogenetic context. Systematic Biology, 62, 591–610.
Linde-Medina, M. (2016). Testing the cranial evolutionary allometric ‘rule’ in Galliformes. Journal of Evolutionary Biology, 29, 1873–1878.
Marcus, L. F. (1990. Traditional morphometrics. In F. J. Rohlf & F. L. Bookstein (Eds.) Proceedings of the Michigan morphometrics workshop. (pp.77–122). Ann Arbor: University of Michigan Museum of Zoology
Meachen-Samuels, J., & Van Valkenburgh, B. (2009a). Craniodental indicators of prey size preference in the Felidae. Biological Journal of the Linnean Society, 96, 784–799.
Meachen-Samuels, J., & Van Valkenburgh, B. (2009b). Forelimb indicators of prey-size preference in the Felidae. Biological Journal of the Linnean Society, 96, 729–744.
Meloro, C., & O’Higgins, P. (2011). Ecological adaptations of mandibular form in fissiped Carnivora. Journal of Mammalian Evolution, 18, 185–200.
Meloro, C., & Slater, G. J. (2012). Covariation in the skull modules of cats: The challenge of growing saber-like canines. Journal of Vertebrate Paleontology, 32, 677–685.
Mitteroecker, P., Gunz, P., & Windhager, S., et al. (2013). A brief review of shape, form, and allometry in geometric morphometrics, with applications to human facial morphology. Hystrix, The Italian Journal of Mammalogy, 24, 59–66.
Monteiro, L. (2013). Morphometrics and the comparative method: studying the evolution of biological shape. Hystrix, The Italian Journal of Mammalogy, 24, 25–32.
Nowak, R. M. (2005). Walker’s carnivores of the world. Baltimore: JHU Press.
Nowak, K., Cardini, A., & Elton, S. (2008). Evolutionary acceleration and divergence in Procolobus kirkii. International Journal of Primatology, 29, 1313.
Nowell, K. (2002). Revision of the Felidae red list of threatened species. Cat News, 37, 4–6.
Nowell, K., Jackson, P., et al. (1996). Wild cats: status survey and conservation action plan. Gland: IUCN.
Paradis, E., Claude, J., & Strimmer, K. (2004). APE: Analyses of phylogenetics and evolution in R language. Bioinformatics (Oxford, England), 20, 289–290.
Pearson, A., Groves, C., & Cardini, A. (2015). The ‘temporal effect’ in hominids: Reinvestigating the nature of support for a chimp-human clade in bone morphology. Journal of Human Evolution, 88, 146–159.
Piras, P., Maiorino, L., Teresi, L., Meloro, C., Lucci, F., Kotsakis, T., & Raia, P. (2013). Bite of the cats: Relationships between functional integration and mechanical performance as revealed by mandible geometry. Systematic Biology, 62(6), 878–900.
R Core Team. (2016). R: A language and environment for statistical computing. Vienna: R Foundation for Statistical Computing. Retrieved http://www.R-project.org.
Randau, M., Carbone, C., & Turvey, S. T. (2013). Canine evolution in sabretoothed carnivores: Natural selection or sexual selection? PLoS ONE, 8, e72868.
Rohlf, F. J. (2006). A comment on phylogenetic correction. Evolution, 60, 1509–1515.
Rohlf, F. J. (2015). The tps series of software. Hystrix, The Italian Journal of Mammalogy, 26, 9–12.
Rohlf, F. J., & Slice, D. (1990). Extensions of the procrustes method for the optimal superimposition of landmarks. Systematic Biology, 39, 40–59.
Sakamoto, M., & Ruta, M. (2012). Convergence and divergence in the evolution of cat skulls: Temporal and spatial patterns of morphological diversity. PLoS ONE, 7, e39752.
Sanderson, J. G., & Watson, P. (2011). Small wild cats: The animal answer guide. Baltimore: JHU Press.
Segura, V., Prevosti, F., & Cassini, G. (2013). Cranial ontogeny in the Puma lineage, Puma concolor, Herpailurus yagouaroundi, and Acinonyx jubatus (Carnivora: Felidae): A threedimensional geometric morphometric approach. Zoological Journal of the Linnean Society, 169, 235–250.
Segura, V., Cassini, G., & Prevosti, F. (2016). Three-dimensional cranial ontogeny in pantherines (P. leo, P. onca, P. pardus, P. tigris; Carnivora:, Felidae. Biological Journal of the Linnaean Society.
Sicuro, F. L. (2011). Evolutionary trends on extant cat skull morphology (Carnivora: Felidae): A three-dimensional geometrical approach. Biological Journal of the Linnean Society, 103, 176–190.
Sicuro, F. L., & Oliveira, L. F. B. (2011). Skull morphology and functionality of extant Felidae (Mammalia: Carnivora): A phylogenetic and evolutionary perspective. Zoological Journal of the Linnean Society, 161, 414–462.
Sims, M. E. (2012). Cranial morphology of five felids: Acinonyx jubatus, Panthera onca, Panthera pardus, Puma concolor, Uncia uncia. Russian Journal of Theriology, 11, 157–170.
Slater, G. J., & Van Valkenburgh, B. (2008). Long in the tooth: Evolution of sabertooth cat cranial shape. Paleobiology, 34, 403–419.
Slater, G. J., & Van Valkenburgh, B. (2009). Allometry and performance: the evolution of skull form and function in felids. Journal of Evolutionary Biology, 22, 2278–2287.
Takahashi, H., Yamashita, M., & Shigehara, N. (2006). Cranial photographs of mammals on the web: the Mammalian Crania Photographic Archive (MCPA2) and a comparison of bone image databases. Anthropological Science, 114, 217–222.
Viscosi, V., & Cardini, A. (2011). Leaf morphology, taxonomy and geometric morphometrics: A simplified protocol for beginners. PLoS ONE, 6, e25630.
Warton, D. I., Duursma, R. A., Falster, D. S., et al. (2012). smatr 3—An R package for estimation and inference about allometric lines. Methods in Ecology and Evolution, 3, 257–259.
Warton, D. I., Wright, I. J., Falster, D. S., et al. (2006). Bivariate line-fitting methods for allometry. Biological Reviews, 81, 259–291.
Werdelin, L. (1983). Morphological patterns in the skulls of cats. Biological Journal of the Linnean Society, 19, 375–391.
Werdelin, L., Yamaguchi, N., Johnson, W. E., et al. (2010). Phylogeny and evolution of cats (Felidae). Biology and conservation of wild felids. (pp. 59–82) Oxford: Oxford University Press.
Wilson, D. E., & Reeder, D. M. (2005). Mammal species of the world: A taxonomic and geographic reference. Baltimore: JHU Press.
Wilting, A., Christiansen, P., Kitchener, A. C., et al. (2011). Geographical variation in and evolutionary history of the Sunda clouded leopard (Neofelis diardi) (Mammalia: Carnivora: Felidae) with the description of a new subspecies from Borneo. Molecular Phylogenetics and Evolution, 58, 317–328.
Acknowledgements
We are deeply grateful to all scientists and institutions who made pictures of crania freely available on their websites, and also to Mike Collyer and Dean Adams for help with geomorph, to Marko Djurakic for suggestions on R scripts, and to Jim Rohlf and Liam Revell for their advice on MA regressions. We are in debt also to SYNTHESYS, an EC-funded Project for an integrated European infrastructure for natural history collections, for supporting both the previous study on CREA in placentals and its follow up in 2015.
Author information
Authors and Affiliations
Corresponding author
Electronic supplementary material
Below is the link to the electronic supplementary material.
Rights and permissions
About this article

Cite this article
Tamagnini, D., Meloro, C. & Cardini, A. Anyone with a Long-Face? Craniofacial Evolutionary Allometry (CREA) in a Family of Short-Faced Mammals, the Felidae. Evol Biol 44, 476–495 (2017). https://doi.org/10.1007/s11692-017-9421-z
Received:
Accepted:
Published:
Issue Date:
DOI: https://doi.org/10.1007/s11692-017-9421-z