
Abstract
Recently, there is an increasing demand for efficient and secure transreception of medical images in telemedicine applications. Though a fixed spectrum is allocated to each user, most of the time it remains unused by the concerned user. Cognitive Radio (CR) is a technology that utilizes the unused spectrum efficiently by adopting spectrum sensing concept. This paper proposes an efficient and secure transmission of medical images by adopting CR technology and image encryption technique. Firstly, the novel medical image encryption algorithm is proposed to encrypt the DICOM (Digital Imaging and Communications in Medicine) image effectively. Then, the spectrum sensing technique is carried out via Universal Software Radio Peripheral (USRP) to sense the unused frequency band to transmit the encrypted bio signal. The proposed encryption algorithm combines DNA (Deoxyribo Nucleic Acid) sequence operation and chaotic maps to successfully encrypt the DICOM image pixels. Experimental results are done and various analysis such as Unified Average Changing Intensity (UACI), Number of Pixel Changing Rate (NPCR), entropy estimation and chi-square tests are carried out to validate the sternness of the encryption algorithm.
1 Introduction
With the advancement in the field of telecommunication and medicine, the need for sharing the medical data files has increased drastically. Security is concerned to be the significant problem while transferring the medical files in real time medical applications such as telemedicine. Therefore, there is an emerging need for ensuring the security of patient data files. Cryptography is a discipline of mathematics and computer science that provides numerous security services. Advanced Encryption Standard (AES), Data Encryption Standard (DES) are the traditional encryption algorithms to encrypt the text files. These encryption schemes are less suited or less efficient to encrypt the bulk DICOM images since they require large computational overhead [24, 33].
A variety of conventional encryption schemes has been employed to encrypt the medical images [8, 10, 24, 29, 30]. Recently, chaos-based cryptography has attracted many researches to develop efficient algorithms to conceal the secret information [17, 33, 38]. A chaotic system is a nonlinear system known for its strong properties like very high dependency on the control parameters and initial condition, topological transitivity and the density of the periodic points [5, 17, 28]. Chaos is a branch of study that is highly focused on dynamic systems. This concept has been employed in information security for a variety of reasons. Highly sensitive to initial conditions, ergodicity, random progression of sequences, etc. are some of the features of such chaotic based systems. Chaotic attractors [31] and maps [3] have found a significant role in encryption of images.
Chaotic maps are governed through a single or set of mathematical equations. These maps have been constructed using single or more variables. There are many maps found in literature on one dimensional and two-dimensional platforms [3]. 1D maps yield good model of chaotic systems, where the phase plane is stretched in a one-dimensional pattern on a single axis [6]. Some of the commonly used 1D maps are a logistic map, tent map, sawtooth map, etc. These maps have a random pattern generation model based on the control parameters and initial conditions. However, a combination of 1D chaotic maps can be employed in image encryption applications to improve the keyspace.
In order to exploit the complex random behaviour of chaotic signals, multidimensional chaotic maps have been suggested [3, 6, 7, 9]. The one step ahead of the 1D chaotic map is a 2D chaotic map wherein more than one variable control the chaotic system. Some of the 2-D chaotic maps are Bakers map, Henon map, Arnolds map, etc. These chaotic maps are well suited for confusion as well as diffusion operations during the encryption of secret images [7, 9].
Similarly, DNA computing is another emerging field to store and transmit the information. DNA has the advantage of high storage and massive parallelism, and thus it matches the demand of image encryption [12, 19, 37]. Few works have been reported in the literature which combines DNA sequence and chaotic sequences to encrypt the digital and medical images [36].
Jain and Rajpal have proposed an image encryption scheme based on DNA sequence, 1D and 2D chaotic maps [13]. Two matrices are generated from 1D logistic map to perform DNA addition and complementary operation. Finally, block shuffling is performed with 2D logistic sequences. Zhen et al. have combined DNA sequence, 1D logistic and spatiotemporal system to effectively encrypt the digital image [39]. DNA coding and addition operations are based on the sequences generated from the logistic system; spatiotemporal system permutes the image before decoding. Liu et al. have developed an image encryption algorithm based on the logistic system, chen system and DNA sequence [27]. Li et al. have proposed the color image encryption scheme employing real and complex chaotic system [21]. Hamming distance generated from the plain image and key 1 are used to generate key 2 which is then utilized for scrambling the color plane pixels [26]. Guesmi et al. have projected the improved scheme to enhance the information entropy based on DNA sequence operation, Lorentz attractor and SHA 2 algorithm [11]. In [18], a noise resistive image encryption scheme based on piecewise linear chaotic map (PWLCM), logistic map and DNA sequence are proposed. 128-bit hash is calculated from the plain image to select the DNA rule and control parameters of chaotic maps [25].
The electromagnetic spectrum is a natural resource. Due to the increase in population, this natural resource has become limited and crowded. Usually, the spectrum is allocated to each user statically. Due to the static allocation, the spectrum might be unutilized by the certain users for a prolonged time. In order to efficiently utilize the unused resources, Cognitive Radio (CR) technology has come into existence [1, 2]. It has reduced the scarcity of spectrum to a greater extent by employing dynamic allocation scheme. In cognitive radio concept, by using spectrum sensing technique, sensing is done to detect the presence of secondary user [4, 35]. On the other hand, spectrum management calculates how long the user can work in the spectrum of the primary user and finally spectrum sharing is the sharing of the spectrum with the secondary user. Spectrum mobility is used to maintain the requirements of communication during transition.
Inspired from the above discussion, the cognitive radio concept can be well utilized to reuse the unused radio spectrum to transreceive the medical images efficiently in real-time telemedicine applications. However, as mentioned earlier, security will be the primary concern for achieving the efficient trans-reception of medical files [32]. Hence, this paper proposes a novel approach to combine the CR concept and image encryption algorithm to transmit the bio-inspired biomedical images efficiently and securely. The proposed approach comprises two phases namely, security phase and transreception phase. In the security phase, a Quadra layer security scheme is designed based on DNA and chaotic sequences [14,15,16, 20, 22, 23, 34, 40]. In the second phase, spectrum sensing concept is used to effectively transmit the encrypted medical image.
2 Methodology
The proposed approach has two phases namely, security phase and transreception phase. In the security phase, a four level security scheme based on DNA encoding, DNA addition and subtraction, 1D logistic map and PWLCM map is proposed [34]. In the transreception phase, the spectrum sensing concept using cognitive radio is utilized to efficiently transreceive the encrypted medical image.
2.1 Security phase
The overall working model of the encryption algorithm is shown in Fig. 1.

Block diagram of proposed image encryption algorithm
2.1.1 DNA coding
DNA sequence composes four bases namely Adenine (A), Guanine (G), Thymine (T) and Cytosine (C). Among these bases, A and T are complementary, G and C are complementary to each other. Watson and Crick [37], framed a structure in which one member of a pair of bases must always be a purine, and the other should be pyrimidine to bridge the two chains in DNA structure. Hence, the following conditions prevail:
-
Adenine can only pair with thymine, and guanine only with cytosine.
-
A and T are complementary. Similarly, G and C are complementary.
In a binary system 0 and 1 are complementary; similarly, 00 and 11, 10 and 01 are complementary to each other. By mapping the 2-bit binary system to the DNA bases, one can obtain 24 set of rules. Since the alignments of these sequences which coincide with binary complementary rule were proposed by Watson, the suggested rule was called Watsons Cricks Complementary rule. A can bond only with T and C can bond only with C.
However, among those 24 rules only 8 rules satisfy the Watson crick’s complementary rule.
Hence, the DNA-based computing ends with 8 set of encoding and decoding rules [34] as depicted in Tables 1, 2, 3, 4, 5. Using these rules the image pixel value can be encoded into equivalent DNA bases. Using Watson’s complementary rule, A can bond with T and C with G only.
Considering C = 00, A = 01, T = 10, G = 11, the encoding and decoding rules are given in Table 5.
With the advancement of DNA computing, some algebraic operations are created based on DNA bases. In order to enhance the diffusion effect, the DNA addition and subtraction rules are derived as shown in Tables 6 and 7 respectively.
2.1.2 Proposed image encryption algorithm
-
Step 1: Read the DICOM image of size 256 × 256.
-
Step 2: Logistic map is defined by,
where r is the control parameter, and X0 is the initial condition. To be chaotic the value of r should lie in the interval (3.57, 4) and X in the range of (0, 1).
Let ‘n’ be the user defined positive integer key value. Set the initial conditions and control parameters to the 1D logistic map and iterate the map upto n iterations. After n iterations, allow the chaotic system to iterate for extra 2 times.
X = {Sn+1, Sn+2}, Sn+m is mth element in the chaotic sequence X.
-
Step 3: Quantize the sequence using the following equation,
$$ Xq=\left\{\left({X}^{\ast }{10}^{14}\right)\ \mathit{\mod{}}\ 8\right\} $$ -
Step 4: Out of 8 encoding rules, select the particular rule set from Tables 1, 2, 3, 4, and 5 using the first element from the quantized chaotic sequence Xq. Encode the plain DICOM pixels into corresponding DNA bases using the selected rule as in [34].
-
Step 5: The DNA-encoded matrix of size 256 × 256 × 8 is divided into two blocks B1 and B2. DNA addition and subtraction operations are performed in B1 and B2 respectively.
-
Step 6: Few methods have employed the DNA addition/ subtraction operation to diffuse the image pixels [7, 9]. In these methods, all the bits of image pixels are employed in diffusion process which may increase the computational overload. In order to reduce the computational overhead, the proposed method diffuses only the Most Significant Bit (MSB) and Least Significant Bit (LSB). The new MSB of cipher pixel is obtained by using DNA addition/subtraction operation on MSB and LSB of DNA encoded matrix.
-
Step 7: Out of 8 decoding rules, select the particular rule set from Tables 1, 2, 3, 4 and 5 using the second element from the quantized chaotic sequence Xq. Using the selected rule, decode the DNA base into corresponding decimal value to get the diffused cipher image [34]. The process from step 1 to step 7 are explained in Fig. 2.
Fig. 2 
Illustration of proposed diffusion process
-
Step 8: The mathematical expression of PWLCM is

where x0 € (0,1), when the control parameter P0 lies in the interval (0,0.5) the system behaves chaotic.
Iterate the above equation upto 256 × 256 times, sort the obtained sequences in ascending order to get the sorted sequence. Map the pixels based on the sorted sequence to get the final encrypted image. Figure 3a and b show the 1D logistic map bifurcation diagram for 50 and 1000 iterations respectively. Similarly, Fig. 3c and d shows the 2D Henon map bifurcation diagram for 50 and 1000 iterations respectively. From the figures, it is clear that 2D map takes advantage of complexity and randomness as the number of iterations becomes more.

a 1D logistic map iterated for 50 times, b 1D logistic map iterated for 1000 times. c 2D Henon map iterated for 50 times, d 2D Henon map iterated for 1000 times
Figure 4a and b represents the bifurcation diagram of logistic map for 100 and 1000 iterations respectively for Xn Vs X(n + 1). Figure 4c and d represents the bifurcation diagram of logistic map for 100 and 1000 iterations respectively for X(n + 1) Vs r. From the figures, it is clear that randomness of the logistic map has become more complex as increasing the number of iterations.

a and b bifurcation diagram of logistic map for Xn Vs X(n + 1) for 100 and 1000 iterations respectively. c and d bifurcation diagram of logistic map for X(n + 1) Vs r for 100 and 1000 iterations respectively
For example, to generate permutation matrix of size 128 × 128, the logistic map is iterated 1000, 1500 and 2000 times. Let r = 3.989 and Xn = 0.449, then the output of the logistic map equals.
After sorting the values in ascending order, the new indices of these values will be used to fill the permutation matrix.
Figure 5(a–c) represents the permutation sequence matrix formed from the logistic chaotic sequences after iterating 1000, 1500 and 2000 times respectively. From the figure, it is clear that the randomness of the permutation matrix increases along with the iterations of the logistic map.

a–c Permutation matrix formed from chaotic sequences after 1000, 1500 and 2000 iterations
2.2 Spectrum sensing using cognitive radio
In the proposed scheme, initial spectrum sensing is done using USRP, and then the unused spectrum is identified to transmit the encrypted biomedical images. The following steps explain the spectrum sensing concept.
-
Step 1: Initially, a USRP transmitter is acting as a primary user and the receiver USRP will be performing sensing of the primary data.
-
Step 2: From the available spectrum, the unused spectrum is sensed using energy detector technique as follows:
-
The received signal is represented as y(n) = s(n) + w(n) where s (n) is the signal to be detected and w (n) is the Additive White Gaussian Noise and n is the index.
-
The metrics used in the energy detector is \( M={\sum}_{n=0}^N{\left| y(n)\right|}^2 \) where ‘N’is the size of the vector and the decision metric M is compared with the threshold value λE
-
The probability of detection PD and the probability of false alarm PF can be used to analyze the performance of the detection algorithm.
-
The probabilities are given by \( {P}_D=1-\tau \left({L}_f{L}_t,\frac{\lambda_E}{\sigma_{\omega}^2}\right) \) and \( {P}_F=1-\tau \left({L}_f{L}_t,\frac{\lambda_E}{\sigma_{\omega}^2+{\sigma}_s^2}\right) \) where λE is the threshold and τ (a, b) is the incomplete gamma function.
-
Step 3: The value of PD should be greater and the value of PF should be smaller. When the above condition is satisfied the spectrum is free to transmit the encrypted bio-inspired signal, else the sensing is done until the condition is satisfied. The whole process is explained in Fig. 6.
Fig. 6 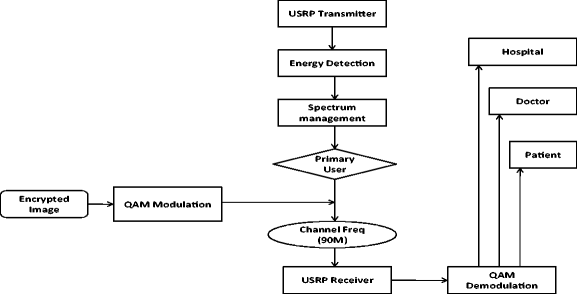
Block diagram of the proposed scheme

The RX1 antenna is used in USRP transmitter with 15 dB as gain and the frequency bandwidth of 88MHZ – 100 MHZ. The spectrum is analyzed as portrayed in Fig. 7(a and b). It shows that the primary user is present at 94 MHZ and other frequencies are considered as spectrum holes. A 98 MHZ is selected as the suitable frequency spectrum in order to avoid interference from the primary user.

a Block diagram of spectrum analyzer; b Front panel of spectrum analyzer
3 Results and discussions
This section presents and analyzes the experimental results of both medical image encryption and effective transreception. The proposed algorithm is analyzed by using five test images. The test CT and MRI DICOM images of size 256 × 256 and 512 × 512 are shown in Fig. 8(a–e). In order to validate the robustness of the proposed medical image encryption algorithm, various tests such as statistical, differential, key sensitivity, cropping, noise attack analyses have been performed.

Test images: a MR-1of size 256 × 256; b CT-2 of size 256 × 256; c CT-3 of size 256 × 256; d MR-2 of size 512 × 512; e MR-3 of size 512 × 512
MR-1 image of size 256 × 256 and the various stage outputs are shown in Fig. 9(a–d).

a Input DICOM image; b Combined image; c Encrypted image; d Decrypted image
3.1 Statistical analysis
This analysis can be proven by estimating histogram, chi-square test, and histogram deviation, deviation from ideality, entropy and correlation coefficients of the cipher image.
3.1.1 Histogram analysis
Histogram analysis is the graphical representation of the number of pixels and the gray scale level. The original image, its histogram and the histogram of the encrypted image are shown in Fig. 10 (a–c) respectively. The perfectly encrypted image should have the flat histogram. From the Fig. 10, it is clear that the histogram of the encrypted image is flat which means the pixels are uniformly distributed at all the gray levels. From this, it is evident that it is very hard to estimate the statistical relationship between the pixels.

Histogram Analysis: a Input image; b Histogram of (a); c Histogram of the encrypted image
3.1.2 Chi-square test
Chi-square test is a very important and significant non-parametric test. It is based on calculating the difference between the observed and the expected value to estimate the statistical value of the uniform distribution of pixels in the encrypted image. This can be calculated using the formula given below,
Where, O is the histogram value of the observed cipher image, and E is the histogram value of the ideally encrypted image. The chi-square distribution value of the test images of size 256 × 256 and 512 × 512 are given in Table 8. The test values with degrees of freedom equal to 255 and probability of 0.95, the theoretical, critical value is 293.2478. From Table 8, the chi-square distributions of all the test image values are below the theoretical value which confirms that the proposed encryption scheme achieves uniform distribution of cipher pixels.
3.1.3 Histogram deviation analysis
This section presents the quantitative analysis of the deviation in histogram between the original and the encrypted image. As the name implies, the deviation value should be large to achieve the better encryption standard. This analysis can be carried out by adapting the following equation,
where, D is the absolute difference of the observed cipher histogram from the original histogram of the image of size M × N.
3.1.4 Deviation from ideality analysis
Deviation from ideality measures the deviation of the encrypted image from the ideally encrypted histogram. This value should be as low as possible to achieve better encryption. The histogram deviation and the deviation from ideality values are tabulated in Table 9. From the Table 9, it is clear that the histogram deviation values are higher and the deviations from ideality values are smaller for all the test images which prove the robustness of the proposed encryption scheme.
3.1.5 Correlation analysis
The correlation between the adjacent pixels in the plain image should be equal to 1and for the encrypted image it should be equal to 0. The proposed algorithm achieves the above criterion which is shown in Table 10. Also, the correlation between the adjacent pixels is calculated in all horizontal, vertical and diagonal directions. The Fig. 11(a–c) illustrates the pixel distribution of the original plain image in all directions. Figure 11(d–f) illustrates the pixel distribution of the encrypted image. The correlation coefficient is calculated by the following formula,

Pixel distribution analysis: a Horizontal pixel distribution of original image; b Vertical pixel distribution of original image; c Diagonal pixel distribution of original image; d Horizontal pixel distribution of encrypted image; e Vertical c pixel distribution of encrypted image; f Diagonal pixel distribution of encrypted image
where E(x) is the expected value of x and σx is the standard deviation of x.
From the Fig. 11, the pixels value are concentrated in horizontal, vertical and diagonal directions for the original test image MR_1 and is uniformly distributed over the entire region for the encrypted image. The estimated table values are closer to zero which reveal that there exists no correlation between the adjacent pixels of the encrypted images in all the three directions. Hence, the statistical relationship between the neighboring pixels are totally broken which means the algorithm has high immunity to defend statistical attacks.
3.1.6 Information entropy
Global Shannon entropy is used to test the randomness and robustness of the encrypted image. It can be measured by the following equation
where p(xi) is the probability of the symbol xi. The maximum entropy is “n” for a random image with 2n symbols. The global Shannon entropy is not the perfect measure to find the randomness of the encrypted image [33]. To overcome this local Shannon entropy is calculated. It is estimated by choosing K random blocks in the encrypted image and calculating the entropy of each individual blocks and taking an average of the obtained entropies. Table 11 estimates the global, as well as local entropy considering 40 random blocks, in both the cases; the values, are closer to 8 which reveal the randomness the proposed encryption scheme.
3.2 Differential analysis
Number of Changing Pixel Rate (NPCR) and Unified Averaged Changed Intensity (UACI) are the universal measure used to validate the differential attack resistance of the encryption scheme. NPCR calculates the difference in change in number of pixels between two cipher images. It is calculated by the formula,
where, di = 0 if Xi = Yi; di = 1 if Xi ≠ Yi for any i ϵ {0,1, N-1}. Xi is the pixel of the encrypted image obtained from the original image, Yi is the pixel of the encrypted image obtained from the original image with single pixel changed. UACI calculates the difference of the gray value between two encrypted images.
where f is the largest supported pixel and T is the size of the image. The NPCR and UACI values for the test image 1 are found to be 99.88% and 33.49% respectively.
3.3 Key sensitivity analysis
Keys are the basic and the most important element in any crypto system. This analysis is to check the sensitivity of the algorithm for input key stream. Even a small change in the input key should bring a drastic change in the expected output. The key space used in the proposed scheme is 2104 thus it is highly resistant to brute force attack. The input key used is k = {a f w k y t m q l e p v z, μ = 3.99, p0 = 0.490123}. The encrypted image is decrypted with three different keys such as k1 = {b f w k y t m q l e p v z, μ = 3.99, p0 = 0.490123}, k2 = {a f c k y t m q l e p v z, μ = 3.99, p0 = 0.490123}, k3 = {a f w k d t m q l e p v z, μ = 3.99, p0 = 0.490123}. Figure 12(a–e) provides the encrypted image and the decrypted image using three different key values. From the Fig. 9, it can be understood that the algorithm is highly sensitive towards the change in key.

Key sensitivity analysis: a Encrypted image; b Decrypted image with wrong key k1; c Decrypted image with wrong key k2; d Decrypted image with wrong key k3; e Decrypted image with original correct key k
3.4 Cropping attack analysis
Nowadays hackers try to steal the information as much as possible from the encrypted image when it is transmitted through the common channel. The algorithm should be strong enough to resist these attacks. In this analysis, the encrypted images are intentionally cropped to study its effect on the decrypted image. Figure 13(a–h) portrays the cropped and the corresponding decrypted images. From the figure, it can be noticed that despite intentional cropping, the proposed algorithm is still able to retrieve the meaningful image.

Cropping attack analysis: a Encrypted image with 190 × 5 cropped; b Encrypted image with 80 × 50 cropped; c Encrypted image with 25 × 10 and 25 × 10 cropped; d Encrypted image with multiple cropping; e Decrypted image of (a); f Decrypted image of (b); g Decrypted image of (c); h Decrypted image of (d)
3.5 Noise attack analysis
It is highly essential to take care of the noise effect in the channel when the encrypted images are needed to be transmitted over the public channel. This section tends to analyse the noise effect on the cipher image. In order to study the performance of proposed algorithm against noise effects, three types of noises namely the Gaussian, salt and pepper and speckle noise are added intentionally to the cipher image. Figure 14(a–c) shows the encrypted images after adding the Gaussian, salt and pepper and speckle noises respectively. Figure 14(d–f) shows the corresponding decrypted images. From the decrypted images, it is clear that even after the addition of noise, most of the information about the original image could be retrieved.

Noise attack analysis: a Cipher image with Gaussian noise; b Cipher image with Salt and pepper noise; c Cipher image with Speckle noise; d Decrypted image of (a); e Decrypted image of (b); f Decrypted image of (c)
3.6 Complexity analysis
The proposed method involves DNA encoding, addition, subtraction, decoding and permutation. DNA mapping is carried out using one of the eight available rules. Hence the complexity is 2^8. The rules for diffusion operation are selected based on logistic chaotic sequence which depends on the control parameter and 104 bit input key. The permutation is done by PWLCM which is based on control parameter. Hence the total complexity of the proposed system is 2^8 × 2^8 × 10^104.
3.7 Performance comparison with existing work
Table 12 shows the comparison of proposed algorithm with few algorithms available in the literature. The comparison has been made based on correlation, NPCR and UACI values.
To estimate the effective decryption of the proposed algorithm, Mean Square Error (MSE), Peak Signal to Noise Ratio (PSNR), Mean Absolute Error (MAE) and correlation in horizontal, vertical and diagonal directions have been estimated. The expressions pertaining to the computation of MSE, PSNR and MAE are given below:
M × N represents the total number of pixels.
Ki,j and Ii,j represent the original and the decrypted image pixels respectively.
Here, N represents the total number of pixels. f i and y i represent the predicted and true pixel values of the images respectively.
Table 13 presents the analyses between the original and the decrypted images. It can be inferred that the results of zero obtained for the computation of MSE and MAE reiterate the worthiness of the proposed approach in the error-free recovery of original images. Further, the infinity value of PSNR proves a point on the hassle free reconstruction of the secret image back during the decryption process. The three correlation estimations in horizontal, vertical and diagonal directions yield a close to 1 coefficient which is an important metric to substantiate the secured and proper reception of medical record in the form of images.
3.8 Transmission and reception of cipher pixels using CR concept
Initially, the pixel elements of the cipher image are transformed into 16-bit binary information to achieve the efficient transmission. The block diagram and front panel of the designed bit transformation unit is shown in Fig. 15. This data is further modulated by 4-QAM modulation before transmission. The transmission is done with the help of TX1 antenna of NI USRP with the carrier frequency of 98 MHZ.

Transmission of binary bits (a) Block diagram of a transmitted information bits (b) Front panel of transmitted information bits
The receiver antenna RX1 of NI USRP is tuned to the frequency of 98MHZ at which the information needs to be transmitted. The received signal is demodulated by 4-QAM and thus the 16-bit binary information is retrieved from the signal. This is shown in Fig. 16.

Reception of binary bits (a) Block diagram of a received information bits (b) Front panel of received information bits
4 Conclusion
An efficient and secure transmission of medical images by adopting CR technology and image encryption technique has been proposed. DNA and chaos-based encryption system are used to encrypt the medical images and CR technique was utilized to sense the unused spectrum to transreceive the encrypted bio images effectively. The combination of DNA and the chaotic map has increased the algorithm’s resistance towards statistical, differential analysis, noise and cropping attacks. Hence this technique can be widely implemented in rural areas connecting ambulance, doctor and patient monitoring system in a secured manner.
References
Akyildiz I, Lee WY, Vuran MC, Mohanty S (2008) A survey on spectrum management in cognitive radio networks. IEEE Commun Mag 46:40–48. doi:10.1109/MCOM.2008.4481339
Al-Ayyoub M, Jararweh Y (2016) Virtualization-based cognitive radio networks. J Syst 117:15–29. doi:10.1016/j.jss.2016.02.014
Alsaedi, M. (2016) Colored image encryption and decryption using multi-chaos 2D quadratic strange attractors and matrix transformations. Multimed Tools Appl (2016). doi:10.1007/s11042-016-4206-4
Althunibat S, Wang Q, Granelli F (2016) Flexible channel selection mechanism for cognitive radio based last mile smart grid communications. Ad Hoc Netw 41:47–56. doi:10.1016/j.adhoc.2015.10.008
Alvarez G, Li S (2006) Some basic cryptographic requirements for chaos-based cryptosystems. Int J Bifurc Chaos 16:2129–2151. doi:10.1142/S0218127406015970
Belazi A, Abd El-Latif AA, Diaconu A-V, Rhouma R, Belghith S (2017) Chaos-based partial image encryption scheme based on linear fractional and lifting wavelet transforms. Opt Lasers Eng 88:37–50. doi:10.1016/j.optlaseng.2016.07.010
Boriga, R., Dǎscǎlescu, A.C., Diaconu, A.-V. (2014) A new one-dimensional chaotic map and its use in a novel real-time image encryption scheme (2014) advances in multimedia, 2014, art. no. 409586. doi:10.1155/2014/409586
Cedillo-Hernandez M, Garcia-Ugalde F, Nakano-Miyatake M, Perez-Meana H (2013) Robust watermarking method in DFT domain for effective management of medical imaging. Signal, Image Video Process 9:1163–1178. doi:10.1007/s11760-013-0555-x
Diaconu AV (2016) Circular inter-intra pixels bit-level permutation and chaos-based image encryption. Inf Sci 355–356:314–327. doi:10.1016/j.ins.2015.10.027
Dridi M, Bouallegue B, Mtibaa A (2014) Crypto-compression of medical image based on DCT and chaotic system. Global Summit on Computer & Information Technology (GSCIT), Sousse, pp. 1-6. doi:10.1109/GSCIT.2014.6970113
Guesmi R, Farah M, Kachouri A, Samet M (2016) A novel chaos-based image encryption using DNA sequence operation and secure hash algorithm SHA-2. Nonlinear Dyn 83:1123–1136. doi:10.1007/s11071-015-2392-7
Heider D, Barnekow A (2007) DNA-based watermarks using the DNA-crypt algorithm. BMC Bioinf 8:176. doi:10.1186/1471-2105-8-176
Jain A, Rajpal N (2015) A robust image encryption algorithm resistant to attacks using DNA and chaotic logistic maps. Multimed Tools Appl 75:5455–5472. doi:10.1007/s11042-015-2515-7
Khan MK, Zhang J (2007) An intelligent fingerprint-biometric image scrambling scheme. Advanced Intelligent Computing Theories and Applications. With Aspects of Artificial Intelligence Volume 4682 of the series Lecture Notes in Computer Science pp 1141–1151. doi:10.1007/978-3-540-74205-0_118
Khan MK, Zhang J, Tian L (2005) Protecting biometric data for personal identification. Advances in Biometric Person Authentication Volume 3338 of the series Lecture Notes in Computer Science pp 629–638 doi:10.1007/978-3-540-30548-4_72
Khan MK, Zhang J, Alghathbar K (2011) Challenge-response-based biometric image scrambling for secure personal identification. Futur Gener Comput Syst 27(4):411–418. doi:10.1016/j.future.2010.05.019
Kocarev L (2001) Chaos-based cryptography: a brief overview. IEEE Circuits Syst Mag 1:6–21. doi:10.1109/7384.963463
Kulsoom A, Xiao D, Abbas S (2016) An efficient and noise resistive selective image encryption scheme for gray images based on chaotic maps and DNA complementary rules. Multimed Tools Appl 75:1–23. doi:10.1007/s11042-014-2221-x
Leier A, Richter C, Banzhaf W, Rauhe H (2000) Cryptography with DNA binary strands. Biosystems 57:13–22. doi:10.1016/S0303-2647(00)00083-6
Li J, Li X, Yang B, Sun X (2015) Segmentation-based image copy-move forgery detection scheme. IEEE Trans Inf Forensics Secur 10(3):507–518. doi:10.1109/TIFS.2014.2381872
Li X, Wang L, Yan Y, Liu P (2016) An improvement color image encryption algorithm based on DNA operations and real and complex chaotic systems. Opt - Int J Light Electron Opt 127:2558–2565. doi:10.1016/j.ijleo.2015.11.221
Liao X, Shu C (2015) Reversible data hiding in encrypted images based on absolute mean difference of multiple neighboring pixels. J Vis Commun Image Represent 28(4):21–27. doi:10.1016/j.jvcir.2014.12.007
Liao X, Li K, Yin J (2016) Separable data hiding in encrypted image based on compressive sensing and discrete Fourier transform. Multimed Tools Appl (2016). doi:10.1007/s11042-016-3971-4
Lima JB, Madeiro F, Sales FJR (2015) Encryption of medical images based on the cosine number transform. Signal Process Image Commun 35:1–8. doi:10.1016/j.image.2015.03.005
Liu H, Wang X, kadir A (2012) Image encryption using DNA complementary rule and chaotic maps. Appl Soft Comput 12:1457–1466. doi:10.1016/j.asoc.2012.01.016
Liu L, Zhang Q, Wei X (2012) A RGB image encryption algorithm based on DNA encoding and chaos map. Comput Electr Eng 38:1240–1248. doi:10.1016/j.compeleceng.2012.02.007
Liu Y, Wang J, Fan J, Gong L (2016) Image encryption algorithm based on chaotic system and dynamic S-boxes composed of DNA sequences. Multimed Tools Appl 75:4363–4382. doi:10.1007/s11042-015-2479-7
Masuda N, Aihara K (2002) Cryptosystems with discretized chaotic maps. IEEE Trans Circuits Syst I Fundam Theory Appl 49:28–40. doi:10.1109/81.974872
Moumen A, Bouye M, Sissaoui H (2015) New secure partial encryption method for medical images using graph coloring problem. Nonlinear Dyn 82:1475–1482. doi:10.1007/s11071-015-2253-4
Nazeer M, Nargis B, Malik YM, Kim D-G (2013) A fresnelet-based encryption of medical images using arnold transform. Int J Adv Comput Sci Appl 4:131–140. doi:10.14569/IJACSA.2013.040322
Parvees MYM, Samath JA, Bose BP (2016) Secured medical images - a chaotic pixel scrambling approach. J Med Syst 40:232. doi:10.1007/s10916-016-0611-5
Praveenkumar P, Amirtharajan R, Thenmozhi K, Balaguru Rayappan JB (2015) Medical data sheet in safe havens - a tri-layer cryptic solution. Comput Biol Med 62:264–276. doi:10.1016/j.compbiomed.2015.04.031
Ravichandran D, Praveenkumar P, Balaguru Rayappan JB, Amirtharajan R (2016) Chaos based crossover and mutation for securing DICOM image. Comput Biol Med 72:170–184. doi:10.1016/j.compbiomed.2016.03.020
Rehman AU, Liao XF, Kulsoom A, Abbas SA (2015) Selective encryption for gray images based on chaos and DNA complementary rules. Multimed Tools Appl 74:4655–4677. doi:10.1007/s11042-013-1828-7
Tragos EZ, Zeadally S, Fragkiadakis AG, Siris VA (2013) Spectrum assignment in cognitive radio networks: a comprehensive survey. IEEE Commun Surveys Tuts 15:1108–1135. doi:10.1109/SURV.2012.121112.00047
Troncoso-Pastoriza JR, Katzenbeisser S, Celik M (2007) Privacy preserving error resilient DNA searching through oblivious automata. In Proceedings of the 14th ACM conference on Computer and communications security (CCS '07). ACM, New York, NY, USA, 519–528. doi:10.1145/1315245.1315309
Watson JD, Crick FHC (1953) A structure for deoxyribose nucleic acid. Nature 171:737–738 http://www.nature.com/nature/dna50/watsoncrick2.pdf
Zhang L, Liao X, Wang X (2005) An image encryption approach based on chaotic maps. Chaos, Solitons Fractals 24:759–765. doi:10.1016/j.chaos.2004.09.035
Zhen P, Zhao G, Min L, Jin X (2016) Chaos-based image encryption scheme combining DNA coding and entropy. Multimed Tools Appl 75:6303–6319. doi:10.1007/s11042-015-2573-x
Zheng Y, Jeon B, Xu D, Wu QMJ, Zhang H (2015) Image segmentation by generalized hierarchical fuzzy C-means algorithm. J Intell Fuzzy Syst 28(2):961–973. doi:10.3233/IFS-141378
Acknowledgements
Authors would like to express their sincere thanks to SASTRA University, for the financial support under R&M fund (R&M/0027/SEEE – 010/2012–13) to carry out this research work. Also, we are grateful to Dr. S. Vanoli, Medical Superintendent, Government Hospital, Ariyalur, for his valuable suggestions in carrying out this work.
Author information
Authors and Affiliations
Corresponding author
Rights and permissions
About this article

Cite this article
Praveenkumar, P., Kerthana Devi, N., Ravichandran, D. et al. Transreceiving of encrypted medical image – a cognitive approach. Multimed Tools Appl 77, 8393–8418 (2018). https://doi.org/10.1007/s11042-017-4741-7
Received:
Revised:
Accepted:
Published:
Issue Date:
DOI: https://doi.org/10.1007/s11042-017-4741-7