
Abstract
Air pollution, aeroallergens, and weather conditions can worsen health symptoms such as asthma. While studying the impact of these factors, the use of weather types (WTs) rather than individual meteorological variables (such as temperature, relative humidity, wind, cloudiness, or precipitation) is more appropriate since it is holistic and integrative. Moreover, several studies have shown that the human body responds to WTs, rather than to individual meteorological variables. In this study, the use of Sheridan’s WTs is adopted and compared with a so-called “In-House” WTs. The analysis presented here deals with the links between asthma hospitalization and the synergy among air pollution, birch tree pollen and WTs. Knowing the daily WT in a region can provide valuable information for health planning and management of asthma hospitalization, emergency visits and sub-clinical symptoms in the population. This is because air pollution and birch pollen both occur within only a few specific WTs, such as the TROWAL (trough of warm air aloft) or tropical airmasses. These specific WTs need to be more scrutinized since, in Montreal, these are often linked with higher daily mean hospitalization. The findings of this study emphasize the importance of specific WTs in determining the maximum daily concentrations of ozone, fine particles, Betula pollen concentrations and health effects such as asthma hospitalization. Moreover, the use of data filters in the analysis (for temperature and total count of hospitalization) also reveals new insights in the complex nature of asthma disease and its relationship with environmental factors.
1 Introduction
Environmental factors in the atmosphere (air pollution, aeroallergens, and weather conditions) can worsen health symptoms such as asthma (Boezen et al., 1999; Cashel et al., 2004; Dales et al., 2004, 2008; Guarnieri & Balmes, 2014; Guillam & Ségala, 2008; Hebbern & Cakmak, 2015; Robichaud, 2021; Thien et al., 2018). These factors could act as triggers for respiratory diseases and the sensitivity to them can vary from person to person (Ahlholm et al., 1998; INSPQ, 2013). Therefore, it is essential for asthma patients to identify and avoid specific triggers of respiratory disease to help manage their health condition effectively. The analysis presented in this article emphasizes the importance of environmental conditions on asthma such as (1) the level of air pollution (ozone and fine particles), (2) the abundance of atmospheric pollen such as Betula (Birch), one of the most allergenic bioaerosols according to Guérin (1993) and, (3) weather conditions. The study period focuses on the pollen tree season (mostly April and May in Montreal). Among the most abundant pollen monitored in Montreal during spring is birch pollen (Betula) (Bapikee, 2005; Robichaud & Comtois, 2017). Time series of birch phenology has been extensively studied by Robichaud and Comtois (2017) for Birch (Betula) in Montreal. Moreover, Robichaud (2021) has identified synergies between these variables and used a weather type (WT) classification which is referred to in this paper as the “In-house” weather type. This weather type classification is based on synoptic meteorology features. On the other hand, Sheridan (2002) has developed an independent WT classification related to airmasses. This weather type classification has been used to assess health outcomes in Canada (Hebbern & Cakmak, 2015; Vanos et al., 2014). However, their analysis did not include Montreal.
The importance of using a WT classification in analyzing environmental variables and its connection to other fields (including health issues other than asthma hospitalization) has previously been demonstrated in the literature over several decades (Cheng et al., 2007; Heidorn & Yap, 1986; Power et al., 2006; Robichaud, 1993; Robichaud & Comtois, 2019; Tian et al., 2020; Zhao et al., 2012) including the use of Sheridan’s weather-type classification (Lee & Sherida 2018; Sheridan, 2002; Vanos et al., 2014). However, evidence for the association between the simultaneous presence of air pollution, pollen and specific weather type and asthma hospitalization is still limited in Canada and elsewhere. One key concept associated with WTs is the idea of a holistic approach. Instead of examining individual variables in isolation, a holistic approach considers the interconnections and dependencies between various atmospheric elements and the health outcome. This approach recognizes that weather patterns emerge from the complex interactions of multiple variables, such as temperature, humidity, air pressure, wind patterns, and cloud cover (Lee &Sheridan 2018; Robichaud & Comtois, 2019; Vanos et al., 2014). This understanding is crucial for assessing the impact of weather on different aspects of the environment, including ecosystems, agriculture, water resources, and human activities. For example, knowing the daily weather situation in a region can provide valuable information for health planning and management of asthma hospitalization (Thien et al., 2018; Tian et al., 2020) and can lead to an asthma forecast based on weather types. As an example, on Nov. 21, 2016, in Melbourne, Australia, convergent environmental factors triggered a thunderstorm asthma epidemic of unprecedented magnitude, tempo, and geographical range and severity, creating a new benchmark for emergency and health service escalation (Thien et al., 2018).
Asthma is a chronic respiratory condition that affects the airways in the lungs. It causes inflammation and narrowing of the airways, making it difficult for a person to breathe. The symptoms of asthma can vary in severity and may include wheezing, coughing, shortness of breath, and chest tightness (INSPQ, 2013, 2022). The causes are multifactorial and include outdoor allergens, air pollution, weather conditions (factors of the atmospheric environment) as well as tobacco smoke, respiratory infection, and indoor allergens such as dust mites, molds, and animal dander (INSPQ, 2013). But it is recognized that the presence of airborne pollen exacerbates the symptoms of asthma (INSPQ, 2013, 2022; Knox, 1993). A large portion, approximately 80% of asthmatic patients also have allergies (Asthma Canada—htpps://asthma.ca). In the province of Québec, it has been established that about 20% of the population suffers from pollen allergy (INSPQ, 2022). On the other hand, air pollution is one of the known triggers of asthma as hundreds of studies suggest that ozone and PM2.5 are harmful to people at levels currently found in urban areas (Brauer et al., 2007; Stewart et al., 2017, To et al., 2020; EPA OAR 2015). Ozone and PM2.5 are among the most common pollutants in urban areas such as Montreal (Robichaud, 2021; Ville de Montréal 2023). Both pollutants have been shown over the past decades to affect the respiratory, cardiovascular, and central nervous system and are also linked with asthma (Brauer et al., 2007; Delfino et al., 2002; Gehring et al., 2002; Jaffe et al., 2003; McConnell et al., 2003; Rosas et al., 1998).
Pollen allergy is another cause of asthma hospitalization in Canada (Dales et al., 2004, 2008; Hebbern & Cakmak, 2015) and elsewhere (Rosas et al., 1998). However, the synergy between the triad pollen, air pollution, weather patterns deserve more attention (Robichaud, 2021; Robichaud & Comtois, 2019). Although the relation between thunderstorm and asthma has been substantially studied (D’Amato et al. 2015; Knox, 1993; Marks & Bush, 2007; Taylor & Jonsson, 2004; Thien et al., 2018), the relation between asthma and other weather situations have been little examined as discussed in Robichaud (2021). While both interior allergens and pollution are also involved in asthma (including odors and irritants such as wood stove burning), in this paper, we examine the interconnection of asthma with factors of the atmospheric factors only (outside air) and only during tree pollen season (when wood stove burning is insignificant).
Studies show that birch trees produce enormous quantity of pollen, and which is particularly allergenic (Bapikee, 2005; Guérin, 1993). Moreover, there is strong evidence indicating the importance of medium to long range transport of pollen including birch (Comtois, 1996; Damialis et al., 2005; Gregory, 1978; Hjelmroos, 1991; Oikonen et al., 2005; Rogers & Levetin, 1998; Smith et al., 2008; Wallin et al., 1991). It has been shown by numerical simulation that the Laurentides (located to the West, North-West and North quadrants with respect to the city of Montreal) can bring, under proper meteorological situation high quantity of pollen to the Montreal region and in a much more abundance than locally produced pollen (Robichaud & Comtois, 2021).
On one hand, according to the literature, contaminants directly act on specific pollens by enhancing their allergenicity. On the other hand, they affect the mucous membranes of patients, increasing their hypersensitivity and making them more susceptible to the action of allergens (Laaidi et al., 1997, 2011). Pollutants such as ozone (O3), nitrogen dioxide (NO2), carbon dioxide (CO), sulfur dioxide (SO2), and fine particles (PM2.5) impact pollen particles by degrading their structure and triggering the release of the allergens they contain (Laaidi et al., 2002). Studies have also revealed that contaminants can stimulate the synthesis of the IgE antibody (Devalia et al., 1998). In this study, the use of weather-type (WT) was chosen to examine the complex synergy pollen-pollution-WT and the impact on asthma hospitalization in Montreal. Several studies have shown that the human body responds to overall environmental conditions, rather than to individual environmental variables (Rainham et al., 2005; Vanos et al., 2014) including the triggering of some respiratory diseases such as asthma. Finally, maximum air pollution concentrations also depend not only on a specific environmental variable but on weather patterns as well (Heidorn & Yap, 1986; Robichaud, 2021; Robichaud & Comtois, 2019; Tian et al., 2020).
2 Material and methods
2.1 Study design and setting
In the study presented here, an analysis is done for Montreal which focuses on; (1) comparing the results obtained with the two WT classifications mentioned above, (2) an analysis of the WTs in relation to the temporal distribution of asthma hospitalization, and (3) a comparison of WTs versus temperature and total count of asthma hospitalizations in Montreal. Moreover, correlation matrices for all variables are produced.
This study is entirely based on past observations and is of the type called “ecological study” (see Suppl. Material S1 for a comprehensive definition). It focuses on the short-term associations between air quality, tree pollen, and weather type with asthma hospitalization. The population of the study for asthma hospitalization was the residents of Montreal Island (divided into 4 sectors: West, East, Center-North and Center-South, see supplementary material S2, Figure S2). Montreal is the largest city of the province of Quebec and the second most populous city in Canada after Toronto with a population of 1.7 million (near 4 million if all surrounding suburbs are included, https://www.statcan.gc.ca). The city of Montreal is located at about latitude 45.5° N and longitude of 73.6° W with a total land area of roughly 365 km2. Montreal is situated on the Island of Montreal, which is located at the confluence of the Saint Lawrence and Ottawa Rivers. The city is surrounded by several smaller islands, creating a unique geographical setting (https://montreal.ca/en).
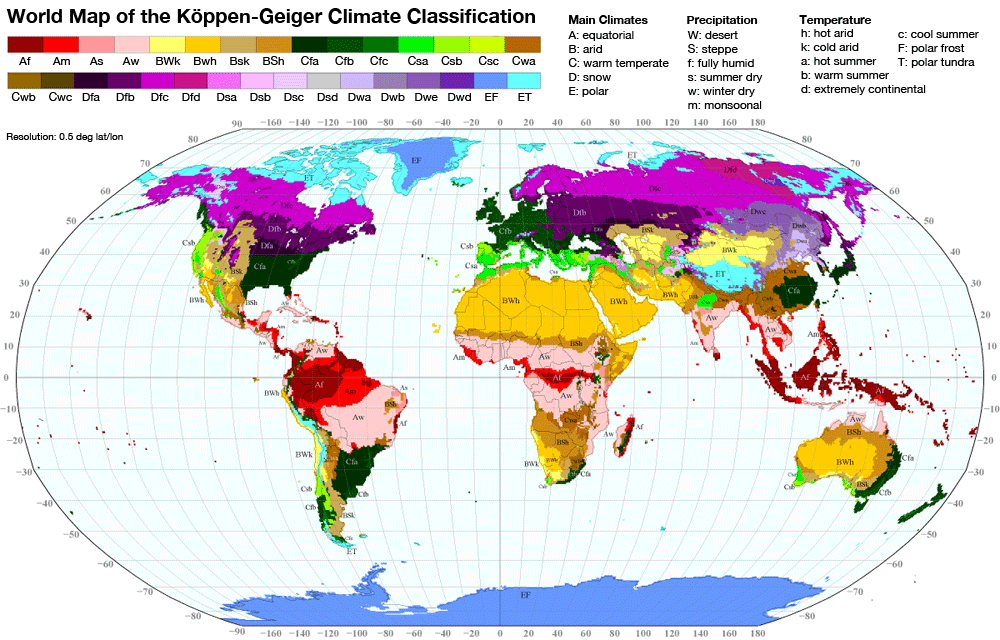
The climate of Montreal is classified as a humid continental climate according to the Köppen-Geiger climate classification system (Dfb). This climate type is characterized by four distinct seasons with warm to hot summers and cold winters with snow. The city experiences significant variations in temperature and precipitation throughout the year, which contributes to its unique and diverse weather patterns (https://www.weatherbase.com/gr/koppen.png). To study the relation among weather, atmospheric irritants, and asthma, two classification systems for weather type have been used here for the purpose of complementarity and comparison. The first one is maintained by the University of Ohio (Sheridan, 2002; Sheridan.geog.kent.edu/ssc3.html) and is based on 7 different air masses (see a description in Table 1). The second one, referred to here as the “In-House” WT, was built by the author of this paper inspired from an original study applied for the province of Ontario (Heidorn & Yap, 1986). However, it was further extended to other locations in Canada. The first version of the “In-House” WT classification is described in more detail elsewhere (Robichaud, 1993; Robichaud & Comtois, 2019). It is based on 12 different synoptic features (see Table 2 for details) rather than air mass types as in Sheridan (2002). Both classification systems in this paper use weather data taken at the Montreal-Trudeau airport for the period 2000–2017. Together, they help build a different but complementary understanding of the impact of weather patterns on several environmentally related parameters (levels of ozone, fine particles, tree pollen concentration, asthma hospitalization) and the possible connections among these variables.
2.2 Data collection
Table S2 (Supplementary material S2) summarizes the data collected for the period available for this study and the source of the data. Concentration of Betula (birch) was obtained for the period 2000–2012 from the Dept. of Geography of Université de Montréal through Dr. Paul Comtois. The method of collection uses a volumetric Hirst spore trap and is described elsewhere (Mandrioli et al., 1998). The unit for the pollen is grain per cubic meter (gr/m3). Daily asthma hospitalization for 4 sectors of the city of Montreal (Center-North, Center-South, East and West) were acquired from INSPQ (Institut National de Santé Publique du Québec) for the period 2006–2017. Concentrations of ozone and fine particles (PM2.5) were obtained from the National Air Pollutant Surveillance (NAPS) managed by Environment and Climate Change Canada (ECCC). Several sites measuring air pollution are situated on the Island of Montreal (see Fig. S2 in supplementary material S2). Note that the NAPS network has basic objective to monitor pollutants in residential areas of Canada. Therefore, pollutants having localized emission sources such as NO2 (transport) and SO2 (industry) might have less impact on the NAPS sites and, therefore, on the health impact in residential areas.
2.3 Statistical methods
The maximum daily 8-h highest mean concentrations were computed from the database for Montreal during the period 2003–2008. Statistical analysis was performed using the software SAS© (Statistical Analysis Software, SAS Institute, NC, USA). Both Pearson’s and Spearman’s coefficient of correlation are computed (Sect. 3) but only the first one is shown as Spearman’s correlation gave similar results. The coefficients of correlation were also computed for different sectors of the city and for different total count (TC) thresholds of hospitalization (A: TC > = 0, B: TC > = 1, C:TC > = 2, D: TC > = 4). Epidemic days are defined here whenever the total daily count of hospitalizations is equal or over 4 (i.e. case D, TC > = 4). The choice of this value is reasonable since it corresponds to daily values of hospitalization above 1.5 standard deviation with respect to the daily mean value. Other computations were also performed for different temperature bins revealing the driving importance of different stressors according to different temperature regimes. These different ways of computing correlation coefficients explore new possible associations which could help to solve the asthma puzzle (triad pollution, pollen, weather) and to test the overall robustness of the results of past companion papers (Robichaud, 2021; Robichaud & Comtois, 2019). In this study, following standard practice, correlations are consider statistically significant if the sample N > 30 and p < 0.05.
3 Results
3.1 Statistics for asthma hospitalization versus pollen concentration and WTs
A significant seasonal variation of asthma hospitalization in Montreal can be observed from the inspection of Fig. 1 which presents a daily mean of hospitalization counts in Montreal over about a decade (2006–2017) for each month of the year. First, during the winter months (J,F,M and D) the daily hospitalization rates remain relatively stable (average slightly below 2 per day). A significant increase of daily mean hospitalization rate is reported in the spring (A and M), corresponding to the tree pollen season in Montreal (Bapikee, 2005; Robichaud & Comtois, 2017), and pollen originating from upwind locations of the northeast parts of US (Efstathiou 2011) when the winds are blowing from that direction. In the fall (S,O,N), a second increase of asthma hospitalization coincides with the ragweed pollen season and to an increase of allergenic spores (Bapikee, 2005; Goyette-Pernot et al., 2003). During summer months (J,J,A), the counts of asthma hospitalization are the lowest. This coincides with a lower allergenic pollen load in the air in this season (Bapikee, 2005; INSPQ, 2013; Robichaud, 2021; Robichaud & Comtois, 2017). Moreover, in summer, better conditions of ventilation inside of homes, and better dilution of air pollutants in the atmosphere (outside air) due to turbulence and well mixed boundary layer are more often encountered reducing the exposure to allergens and particulate matter in the surface layer of the atmosphere.

Daily mean hospitalization for asthma in Montreal (2006–2017, N = 3373) for each month of the year. Statistical significance occurs when there are non-overlapping confidence intervals at a 95% level (i.e. empty rectangles)
The importance of weather conditions on the atmospheric abundance of Betula pollen which appears during spring in Montreal is emphasized in Fig. 2. The x-axis of the graph represents the different weather type classification (A: In-House, B: Sheridan), while the y-axis represents the concentration of birch pollen (Betula). For the case of the “In-House” WT (Fig. 2A), analyzing the period spanning April and May from the years 2000 through 2012, it becomes apparent that four weather types dominate in terms of elevated Betula pollen concentration; Trowal (WT no. 9, sometimes denoted as occlusion), Warm sector (WT no. 3), Approaching High (WT no. 6) and High-pressure system (WT no. 7). Other weather types (see Table 2 for definition of WTs) significantly display lower concentrations of Betula pollen during the specified period. In the case of Sheridan’s weather type (Fig. 2B), it becomes apparent that the Betula concentration is highest in weather type 10 (DM: dry moderate airmass weather type). Note that DM tends to be associated with seasonal or zonal circulation which brings the pollen from the main source region in the province of Quebec (i.e. Laurentides) to Montreal as demonstrated by model simulation (Robichaud & Comtois, 2021). Following weather type DM, the second highest Betula concentration is observed in weather type 60 (MT: moist tropical). MT higher concentrations seem to originate from the meridional long-range transport from US and are associated with maritime tropical air mass which picks up Betula pollen over Northeast US where it is found to be abundant (Efstathiou 2011).

Figure 3A presents the number of hospitalizations versus “In-House” weather type. Trowals and warm fronts show the highest daily mean hospitalizations in Montreal. This result confirms the finding obtained by Robichaud and Comtois (2019) who used only the years 2006–2008 (vs. 2006–2017 here). In the case of Sheridan’s WTs (Fig. 3B), the highest number of hospitalizations is found for the dry tropical airmass (DT).

3.2 Statistics on air pollution vs weather type
Figures 4 and 5 show the daily average maximum for (A) ozone and, (B) PM2.5 for each “In-House” and Sheridan’s weather type, respectively during the tree pollen season (April–May) over the period 2003–2008. In the case of “In-House” WT for the warm season period, Heat Wave (WT = 1) and Warm Sector WTs (WT = 12) display the highest daily mean maximum values of ozone (Fig. 4A). Similar results are obtained for PM2.5 (Fig. 4B). Note that differences are considered statistically significant at a level 95% or more between two WTs whenever the empty rectangles associated with two different WTs do not overlap. For Sheridan’s WT (Fig. 5A,B), the tropical weather types (30: dry or 60:moist) play a substantial role in influencing the maximum daily concentrations of ozone and fine particles. Following closely behind is the transitional weather type (WT = 70; i.e. change of airmass during the same day) which shows the next highest values for both ozone and fine particles.

Mean 8-h maximum daily of A ozone (ppbv) and B PM2.5 (micrograms per cubic meter) using “In-House” weather types during the tree pollen season (April–May) for the period 2003–2008. The empty rectangles indicate the confidence interval at a level of 95%

Same as Fig. 4 but for Sheridan’s weather type
Figure 6 shows the relationship between temperature and various environmental factors, namely the natural logarithm of the Betula pollen count (Fig. 6A), averaged 8-h maximum concentration of ozone (Fig. 6B), and fine particle levels (Fig. 6C). Both ozone and fine particles exhibit distinct patterns with respect to the behavior of asthma hospitalization counts (Fig. 6D) in Montreal during the tree pollen season. Specifically, the highest pollen count (Betula) in Montreal occurs when the temperature lies in the range between 13.5 to 23.5 °C (temperature: classes 2 and 3, Fig. 6A). Conversely, for ozone and fine particles, the maximum concentrations are found at higher temperatures (temperatures higher than 23.5 °C, Fig. 6B,C). Examining the impact of these environmental factors on counts of asthma hospitalization, it becomes evident that they all play a significant role but may become dominant for different temperature ranges. The dominance of pollen as the primary influencing factor becomes apparent in temperature classes 2 and 3 (Fig. 6A) which also corresponds to the highest asthma hospitalization counts (Fig. 6D). That suggests that pollen is the primary driven factor for asthma hospitalization. However, a synergy with ozone and PM2.5 could also be present (Robichaud, 2021; Robichaud & Comtois, 2019) since ozone and PM2.5 can interact with pollen (Cashel et al., 2004; D’Amato et al. 2015; Laaidi et al., 2011; Robichaud, 2021; Visez et al., 2023). At higher temperatures (> 23.5 °C, Fig. 6D), the dynamic significantly shifts, and the primary trigger of increased hospitalizations seems to be air pollution, specifically ozone and PM2.5 (fine particles) rather than pollen as summer accompanied with higher temperature coincides with the end of the Betula pollen season in the region.

Environmental variables and hospitalization for asthma versus temperature (TEMP) in Montreal (2003–2008: April-June) A Natural logarithm of the Betula pollen count B averaged 8-h maximum ozone concentration and, C averaged 8-h maximum fine particle levels, D asthma hospitalization counts in Montreal during the tree pollen season. The different temperature intervals are indicated at the bottom of the figure
To elucidate further the respective role of pollen and air pollution in asthma hospitalization, coefficient of correlation matrix is presented in Table 3. First, Table 3A presents the Pearson’s coefficient of correlation, illustrating the relationship between daily asthma hospitalization in Montreal during the tree pollen season (April–May, 2003–2008), versus various environmental variables for the whole database (all values of total count TC of asthma, i.e. TC > = 0). The analysis considers different sectors of Montreal, namely all sectors lumped together (TC), then center-north (CNC), center-south (CSC), east (EC), and west (WC), respectively. The analysis reveals that the Betula concentration, either with no lag (Bet) and with lag times of one (L1(Bet)) to two days (L2(Bet)), exhibits, overall, and in different sectors of the city, significant coefficient of correlation with asthma hospitalization when the total hospitalization (all sectors combined) is greater than or equal to (A) ALL, i.e. TC. > = 0 (Table 3A), (B) TC > = 1 (Table 3B), (C) TC > = 2 (Table 3C), and, (D) TC > = 4 (Table 3D). Overall, for all variables, the reported correlations range from 0.12 to 0.58, depending on the sector and the required lag time for hospitalization and the threshold value of TC. In comparison to Betula pollen, ozone and PM2.5 exhibit lower occurrence of positive correlations throughout Table 3, although they could show higher correlation for some sectors. Among all sectors combined (row TC, Table 3,A,B,C,D), ozone (with a one-day lag, L1(O3)) demonstrates a noteworthy correlation, with a maximum R value up to 0.342 (p < 0.1). This higher value occurs under epidemic conditions (TC > = 4, Table 3D). Furthermore, in the Center-North sector (second row CNC), the correlation between ozone and hospitalization strengthens to 0.57 (p < 0.01), while the West sector (row WC) shows an even higher correlation of 0.58 (p < 0.01) on the 2-days lag. On the other hand, PM2.5, displays weaker correlations with only a few significant associations depending on the sector and the value of TC. The highest coefficient of correlation between fine particles and asthma hospitalization is found for the Center-North (CNC) part of the city for the value of TC > = 4 (R = 0.347). Notice that at times, negative coefficient of correlation is found between daily asthma hospitalization and fine particulate matter (FPM). This has been also noticed in other studies (Lajoie et al., 1994 in Quebec City, Canada; Garty et al., 1998 in Israel) but the reason of this is unclear and, as things stand, not biologically intelligible. The correlation between Betula pollen and asthma hospitalization counts is also higher for the case of TC > = 4 with R = 0.4898 (p < 0.01).
4 Discussion
Few studies have categorized weather types and analyzed the interaction between the major atmospheric irritants and triggering factors and its association to asthma hospitalization. Using Sheridan’s WTs, and comparing with an already existing WT classification at ECCC (so-called “In-House” WT), several interesting graphs were presented in Sect. 3 which reveals the importance of Betula pollen but also the synergy between several environmental factors (stressors) and asthma. By computing the statistics in different sectors of the city, for different values of TC (total count for asthma hospitalization in Montreal), and using different bins of temperature, new insights have been obtained regarding the link between atmospheric stressors and asthma in Montreal.
Overall, in Table 3, the highest correlation with asthma hospitalizations total counts (TC) and environmental factors are usually found with one-day lag (for Betula, ozone or fine particles) in all geographical sectors of the city. The lag between environmental stressors and asthma hospitalization or mortality is well known in the literature (Garty et al., 1998; Gleason et al., 2014; Robichaud & Comtois, 2019; Schwartz, 2000). Note that beyond two days lag, coefficient of correlation was found to be non-significant in the present study (not shown in Table 3).
In the previous literature, the role of pollen in asthma hospitalization is not always clear and the methodology used could sometimes be questionable. For example, Gleason et al. (2014) have studied the associations between ozone, PM2.5, and four types of pollen during the warm season in New Jersey. They found stronger links between air pollution compared to pollen for emergency department pediatric asthma events and failed to obtain evidence for the role of pollen. However, the latter study included different kinds of pollen (with different allergenic power) and for the whole warm season and with no filter (such as for TC in this study here) all of which could dilute the strength of the correlation pollen-asthma as compared to that of air pollution. In the study presented here, only the months corresponding to the tree pollen season are used (April–May) and Betula pollen (the most abundant and allergenic tree pollen) was selected to conduct the study and filter for TC and temperature bins. This reduces the possibility of confounding factors and the dilution effect. This methodology applied in Sect. 3, reveals that Betula pollen presents overall the more robust association with asthma hospitalization. In fact, the coefficient of correlation is more consistently higher for Betula pollen than for air pollution in various sectors of the city.
Other interesting features of this paper are described and explained here. Figure 5 shows the average concentrations of both ozone (Fig. 5A) and PM2.5 (Fig. 5B) versus Sheridan’s WT. The maximum concentration for ozone is found in the dry tropical situation (WT = 30) whereas for PM2.5 it is observed in the moist tropical case (WT = 60). The different behavior for ozone as compared to that of PM2.5 could be explained by the fact that under dry air (high vapor pressure deficit), plants stomata tend to close (Jarvis, 1976) limiting the dry deposition of ozone over plants through stomata. Since dry deposition is considered an important sink for ozone, reducing the deposition allows more ozone accumulation in the atmosphere. For PM2.5, deposition does not depend on stomata opening and therefore is less sensitive to dry weather conditions. Note that the moist tropical WT (i.e. MT), for both ozone and PM2.5 shows high concentrations as well. This is to be expected since tropical airmasses are passing over polluted regions of the US which naturally brings a higher load of fine particles and ozone (by uplift due to turbulence and long-range transport).
4.1 Increase synergy on epidemic days (TC > = 4)
Changing the values of the threshold for TC can filter out non-epidemic days. When TC > = 4 (epidemic days only, Table 3D), the correlation matrix indicates both stronger coefficient of correlation for pollen and air pollution. During epidemic days, stronger correlations are observed with asthma hospitalization for all stressors (ozone, fine particles, and pollen) compared with the correlation matrices where epidemic days are not isolated (Table 3, A-C). This suggests some kind of synergy between air pollution and pollen with respect to asthma disease. In fact, ozone and pollen synergy have been suggested in numerous ways in the literature (Cashel et al., 2004; Laaidi et al., 2011; Newman-Taylor, 1995; Robichaud & Comtois, 2019; Visez et al., 2023). Note, finally, that in Table 3, although at times, the coefficient of correlation peaks higher for air pollutant (ozone and PM2.5) than pollen during the tree pollen season, the coefficient of correlation is positive in more numerous situations for Betula pollen than for ozone and PM2.5. This suggests that the main driver of asthma hospitalization could be Betula pollen.
4.2 Link between the trowal WT, Betula pollen and asthma hospitalization
Robichaud and Comtois (2019) showed that the risk of asthma is higher in specific WTs such as trowals and warm fronts. However, the number of cases was reduced to a shorter period in their study. Our results presented here cover a much longer period (i.e. 2006–2017 instead of 2006–2008) and thus provide stronger support to the unexpected association between trowals (an infrequent synoptic WT), and atmospheric stressors. In the literature, prior to the study mentioned above, there is no reference about the link between the presence of trowals and asthma hospitalization. According to our study, trowals have the highest values of both asthma hospitalization and Betula concentration (Figs. 2A and 3A). This synoptic feature and its relationship with respiratory health should be more scrutinized to find the reason why this is occurring.
Trowals have been studied by Schultz and Vaughan (2011). These are complex systems with atmospheric instability, with frequent embedded rain showers and isolated thunderstorms but with intermittent drier period. These latter conditions have been shown to increase the likelihood of asthma hospitalization in numerous countries and in laboratory studies (D’Amato et al. 2015; Marks & Bush, 2007; Taylor & Jonsson, 2004; Thien et al., 2018). It is becoming clear from the literature that under some rain shower conditions, pollen becomes easier to fracture via high humidity and rain by the osmotic pressure (the pollen swollens and the envelope breaks releasing tiny allergens which penetrate deeper in the lungs, see Taylor & Jonsson, 2004). Combining our results already obtained in Robichaud and Comtois (2019), and Robichaud (2021), we postulate here that the presence of thunderstorms is not necessary to obtain pollen fracture such as noted, as for example, in the Melbourne asthma epidemic thunderstorm asthma event of 2016 (Thien et al., 2018). In fact, in Montreal, the author of this paper has not been able to clearly identify a thunderstorm asthma event. But, to a lesser extent, and of more frequent occurrence, any system which produces air convergence and intermittent rain would satisfy the condition for pollen breakup by osmosis without the presence of a thunderstorm. Pollution and bioaerosols convergence in fronts and trowals (as proposed by the concept of frontal-asthma, Robichaud & Comtois, 2019) has been shown to often occur in Montreal. Interestingly enough, Mandrioli et al. (1984) found that trowals trap atmospheric pollutants which explains some of our results presented here and elsewhere (Robichaud & Comtois, 2019) as well as potentially explains the higher daily hospitalization found in trowals (Fig. 3A).
4.3 Strengths and limitations of this study
The focus of this study was limited to the spring season only. However, Fig. 1 confirms that not only spring, but also autumn during the ragweed season, are seasons particularly difficult for patients suffering of asthma or, more generally, of respiratory problems in the province of Quebec (INSPQ, 2022). The demand peak expiratory flow rate tests (a proxy for the prevalence of respiratory diseases) are also significantly higher in both spring and autumn and lower in summer (just as for asthma hospitalization) in Montreal area as well as for the whole Province of Quebec (see Fig. 2 of Robichaud, 2021). Note that the spring and autumn maximum along with a minimum in summer for asthma are features that have been observed in other studies such as Lajoie et al. (1994) for Quebec City (Canada) and West Virginia (HSC 2008). The excess of hospitalizations for spring and autumn (Fig. 1) strongly indicates a direct impact of pollen and other allergenic bioaerosols on individuals with allergies or atopic conditions for which the frequency is greater during these two periods. As a result, the hospitalization rate for asthma patients significantly rises during these seasons, underscoring the importance of considering allergenic pollen as a key contributing factor to the exacerbation of symptoms of asthma among susceptible individuals. However, during the Betula pollen tree season it is possible that pollen cross-reactivity with Alnus (Alder) could influence asthma hospitalization counts but this effect was not evaluated here. Moreover, Maple pollen season occurring before Betula in Montreal could sensitize asthma patients. More studies should therefore be performed during the tree pollen season with other allergenic bioaerosols in relation with asthma or other respiratory diseases in order to evaluate the pollen cross-reactivity and sensitization.
There are other limitations associated with this study. First, because of the ecological nature of this study, it is not possible to firmly establish a cause-and-effect relationship between atmospheric stressors and asthma hospitalization. However, strong associations shown here suggest a likely effect of pollen and a synergy with air pollutants and WTs in triggering asthma hospitalization in Montreal during the tree pollen season. Second, this study cannot be extrapolated to other cities having different socio-economic conditions and different frequency of weather types as well as different vegetation distribution. In the future, epidemiological studies should be done at the level of individual person and for many cities in Canada. This kind of study is outside the current scope of this paper which has explanatory purposes only and suggestive associations. Other limitations also include possible synergy with other pollen types such as Maple, Alder, Aspen, Poplar and few others during the spring season which have not been examined here. However, the concentrations of these pollen types are usually small compared to Betula.
A final caveat of this of this study is that since the NAPS monitoring network focuses on residential areas, pollutants associated with transport (such as NO2 and diesel) or with industrial processes (such as SO2, and volatile organic compounds) will tend to be underrepresented in this study as compared with ozone and PM2.5. This could explain the reason why correlations obtained for NOx and SO2 (not shown in this paper) were not found statistically significant in any sectors of Montreal, since their emission sources are not directly affecting residential sites. Further studies should be done to examine the role of other pollutants on asthma hospitalization with sites located near major roads and/or industries.
4.4 Recommendations and future projections
Although significant progress has been made by public health institutions on managing asthma diseases over the last few decades, climate change threatens the gains made in public health care. In the province of Quebec, more emphasis should be put on monitoring and forecasting of tree pollen season (especially birch) but also on other allergenic species such as Maple, Alder and few others in relation with weather types and air pollution. Additional monitoring and modelling of tree pollen would provide additional information for examining the link with air pollution, weather systems, and human exposure, leading to measures that could mitigate some of the risk related to tree pollen and respiratory diseases particularly in urban environments. Forecasting asthma risks based on studies presented here could be a tool to help manage risks.
Projections for the future suggest a potential increase of asthma hospitalization for the following reasons: with climate change, (1) the length of the birch pollen season is expected to increase (2.3 days/decade, see Robichaud & Comtois, 2017; Anderegg et al., 2021), (2) the birch pollen grain itself becomes more allergenic at higher temperature (Ahlholm et al., 1998), (3) frequencies of tropical airmasses (DTs and MTs) are likely to increase as well as those WTs were asthma hospitalization was found to be the highest (Fig. 4), and, (4) under higher CO2 concentration and higher temperature, the birch tree biomass is expected to increase (Oksanen, 2021) leading to higher pollen production.
5 Summary and conclusions
The use of WTs plays a crucial role in analyzing environmental variables in the atmospheric environment. Moreover, the use of data filters (for asthma total counts and temperature) in the analysis reveals new insights into the understanding of asthma, a complex disease, and its relation to environmental factors. The paper presented here reinforces previous studies (Robichaud, 2021; Robichaud & Comtois, 2019) but also shows new results: (1) by including the use of Sheridan’s weather type classification, and (2) separating total asthma hospitalization counts (TC) with different threshold values (Table 3), and (3) using temperature bins for the analysis (Fig. 6). This further helped improve the understanding and the link between environmental variables and asthma disease and its possible future evolution.
In this study, two classification systems were utilized to investigate the impact of weather types on various environmentally related parameters, including ozone levels, fine particles, birch tree pollen concentration, and asthma hospitalizations. These WT systems provided a different but complementary understanding of the complex relationships involved in the triad air pollution, pollen concentration and weather pattern. Moreover, correlation matrices were presented with different values of TC threshold (Total Count for asthma) and for different sectors of Montreal. Due to the ecological study design, the findings cannot establish a causal relationship. Therefore, further epidemiological studies are necessary to delve deeper into the significant associations uncovered in this research. However, this study strongly suggests a link between birch pollen and asthma hospitalization with potential synergy with other environmental factors. Other research in Canada has pointed to this (Dales et al., 2004, 2008; Hebbern & Cakmak, 2015) but it is the first time a study between birch tree pollen, air pollution and asthma hospitalization is conducted in Montreal and using the Sheridan’s weather type.
Among the examined parameters, pollen concentration displayed the most robust correlation with asthma hospitalizations during the months of April and May (normally coinciding with the birch tree pollen season). On the other hand, the analysis of weather types revealed that an increased risk of asthma hospitalizations was associated with specific weather types for both Sheridan’s WT (DT: dry tropical airmass) and In-House WT (maximum hospitalization was found for trowals). Although the individual impact of air pollution and tree pollen on asthma is complex, results here suggest a combined effect of atmospheric stressors on asthma outcomes. It is essential to note that this study focused solely on health outcome of asthma hospitalization counts. Less severe but more numerous effects (mostly subclinical) could have affected a broader population of asthmatic and atopic patients under similar circumstances, contributing to the overall asthma burden.
The higher coefficient of correlation for higher threshold values of TC and for various sectors of the city indicate here that the birch pollen may have a more direct link to asthma hospitalizations compared to air pollution at least during certain months of the year (pollen tree season, i.e. April–May and, likely during the ragweed season, i.e. autumn months). The anticipated rise in pollen issues globally, driven by climate change, as suggested by studies like Cecchi et al. (2010) and D’Amato et al. (2015), is likely to exacerbate the situation in the future as higher pollen load and longer pollen season could occur. Changes in pollen phenology and length of the growing season (U.S. EPA, 2012) could have significant implications for asthma exacerbations during specific times of the year where allergenic pollen is abundant.
In conclusion, understanding these relationships (possible synergy between asthma triggers) is crucial to inform the public and to help developing effective strategies to mitigate the impact of environmental factors on asthma. This includes the implementation of a numerical pollen forecast system such as described in Robichaud & Comtois, 2021) and an asthma forecast in Canada to enhance the well-being of asthma patients and atopic individuals. Finally, the findings in this paper also have potential implications for other fields, such as ecology, aerobiology, and impacts of future climate on human health.
Data availability
No datasets were generated or analysed during the current study.
References
Ahlholm, J. U., Helander, M. L., & Savolainen, J. (1998). Genetic and environmental factors affecting the allergenicity of birch pollen (Betula pubescens ssp. Czerepanobii (Orl) Hämet-Ahti). Clinical and Experimental Allergy, 28, 1384–1388.
Anderegg, W. R. L., Abatzoglou, J. T., Anderegg, L. D. L., Bielory, L., Kinney, P. L., & Ziska, L. (2021). Anthropogenic climate change is worsening North American pollen seasons. Proceedings of the National Academy of Sciences of the United States of America, 118(7), e2013284118. https://doi.org/10.1073/pnas.2013284118
Bapikee, C. (2005). Contenu pollinique atmosphérique à Montréal (Québec) et les variations climatiques interannuelles de 1985 à 1988. Mémoire de maîtrise. Département de géographie de l’Université de Montréal. Available at: https://papyrus.bib.umontreal.ca/xmlui/bitstream/handle/1866/17600/Bapikee_Chaina_2005_memoire.pdf?sequence=1.
Boezen, H. M., van der Zee, S. C., Postma, D. S., Vonk, J. M., Gerritsen, J., Hoek, G., Brunekreef, B., Rijcken, B., & Schouten, J. P. (1999). The effects of ambient air pollution on upper and lower respiratory symptoms and peak expiratory flow in children. Lancet, 353, 874–878.
Brauer, M., Hoek, G., Smit, H. A., de Jongste, J. C., Gerritsen, J., et al. (2007). Air pollution and development of asthma, allergy and infections in a birth cohort. European Respiratory Journal, 29, 879–888.
Cashel, P., Newhouse, B. S., & Levetin, E. (2004). Correlation of environmental factors with asthma and rhinitis symptoms in Tulsa, OK. Annals of Allergy, Asthma and Immunology, 92, 356–366.
Cecchi, L., D’Amato, G., Ayres, J. G., Galán, C., Forastiere, F., Forsberg, B., Gerritsen, J., Nunes, C., Behrendt, H., Akdis, C., Dahl, R., & Annesi-Maesano, I. (2010). Projections of the effects of climate change on allergic asthma: The contribution of aerobiology. Allergy, 65, 1073–1081.
Cheng, C. S., Campbell, M., Li, Q., Li, G., Auld, H., Day, N., Pengelly, D., Gingrich, S., & Yap, D. (2007). A synoptic climatological approach to assess climatic impact on air quality in south-central Canada. Part I: Historical Analysis. Water Air Soil Pollution, 182, 131–148. https://doi.org/10.1007/s11270-006-9327-3
Comtois, P. (1996). Pollen dispersal and long-distance transport: The case of thermophilic pollen in subarctic Canada. Aerobiologia, 13, 37–42. https://doi.org/10.1007/BF02694789
Dales, R. E., Cakmak, S., Judek, S., & Coates, F. (2008). Tree pollen and hospitalization for asthma in urban Canada. International Archives of Allergy and Immunology, 146, 241–247. https://doi.org/10.1159/000116360
Dales, R. E., Cakmak, S., Judek, S., Dann, T., Coates, F., Brook, J. R., & Burnett, R. T. (2004). Influence of outdoor aeroallergens on hospitalization for asthma in Canada. Environmental and Occupational Disorders. https://doi.org/10.1016/j.jaci.2003.11.016
D’Amato, G., Vitale, C., D’Amato, M., Cecchi, L., Liccardi, G., Molino, A., Vatrella, A., Sanduzzi, A., Maesano, C., & Annesi-Maesano, I. (2015). Thunderstorm-related asthma: What happens and why. Clinical and Experimental Allergy, 46(3), 390–396.
Damialis, A., Giarlekas, D., Lazopoulou, C., Balafoutis, C., & Vokou, D. (2005). Transport of airborne pollen into the city of Thessaloniki: The effects of wind direction, speed and persistence. International Journal of Biometeorology, 49(3), 139–145. https://doi.org/10.1007/s00484-004-0229z
Delfino, R. J., Zeiger, R. S., Seltzer, J. M., Street, D. H., & McLaren, C. E. (2002). Association of asthma symptoms with peak particulate air pollution and effect modification by anti-inflammatory medication use. Environmental Health Perspectives, 110, A607–A617.
Devalia, J. L., Rusznak, C., & Davies, R. J. (1998). Allergen/irritant interaction - its role in sensitization and allergic disease. Allergy, 53(4), 335–345.
Efstathiou, C., Isukapalli, S., & Georgopoulos, P. (2011). A mechanistic modeling system for estimating large-scale emissions and transport of pollen and co-allergens. Atmospheric Environment, 45(13), 2260–2276. https://doi.org/10.1016/j.atmosenv.2010.12.008
Garty, B. Z., Kosman, E., Ganor, E., Berger, V., Garty, L., Wietzen, T., Waisman, Y., Mimouni, M., & Waisel, Y. (1998). Emergency room visits of asthmatic children, relation to air pollution, weather, and airborne allergens. Annals of Allergy, Asthma and Immunology, 81, 563–570.
Gehring, U., Cyrys, J., Sedlmeir, G., Brunekreef, B., Bellander, T., et al. (2002). Traffic-related air pollution and respiratory health during the first 2 years of life. European Respiratory Journal, 19, 690–698.
Gleason, J. A., Bielory, L., & Fagliano, J. A. (2014). Associations between ozone, PM2.5, and four pollen types on emergency department pediatric asthma events during the warm season in New Jersey: a case-crossover study. Environmental Research, 132, 421–429. https://doi.org/10.1016/j.envres.2014.03.035
Goyette-Pernot, J., Muñoz-Alpizar, R., Blanchet, J.P., Goyette S., Beniston, M. (2003). Analysing ragweed pollen cloud over Montreal City Centre. In: Proceedings of the 5th International Conference on urban Climate, Lodz.
Gregory, H. P. (1978). Distribution of airborne pollen and spores and their long-distance transport. Pure and Applied Geophysics, 116, 309–315.
Guarnieri, M., & Balmes, J. R. (2014). Outdoor air pollution and asthma. The Lancet, 383, 1581–1592.
Guérin, B. (1993). Pollen et allergies. Édition Allerbio, Varennes-en-Argonne, 279 pages.
Guillam, M. T., & Ségala, C. (2008). Pollens et effets sanitaires : Synthèse des études épidémiologiques. Revue Française D’allergologie Et D’immunologie Clinique, 48(1), 14–19. https://doi.org/10.1016/j.allerg.2008.08.012
Hebbern, C., & Cakmak, S. (2015). Synoptic weather types and aeroallergens modify the effect of air pollution on hospitalization for asthma hospitalizations in Canadian cities. Environmental Pollution, 204, 9–16.
Heidorn, C., & Yap, D. (1986). A synoptic climatology for ozone in Southern Ontario 1976–1981. Atmospheric Environment, 20(4), 695–703. https://doi.org/10.1016/0004-6981(86)90184-8
Hjelmroos, M. (1991). Evidence of long-distance transport of Betula pollen. Grana, 30, 215–218.
HSC (Health Statistics Center, West Virginia Department of Health and Human Resources) (2008). Asthma hospitalizations, 1996–2006. Statistical Brief, no. 22.
INSPQ (2013). État des connaissances sur le pollen et les allergies : les assises pour une gestion efficace. Institut national de santé publique du Québec. www.inspq.qc.ca/publications/1678.
INSPQ (2022). Webinar: L’influence des changements climatiques sur le pollen et les allergies saisonnières. Institut national de santé publique du Québec. www.inspq.qc.ca/formation/evenements/jeu-10132022-1100-l-influence-changements-climatiques-sur-pollen-allergies-saisonnieres.
Jaffe, D. H., Singer, M. E., & Rimm, A. A. (2003). Air pollution and emergency department visits for asthma among Ohio Medicaid recipients, 1991–1996. Environmental Research, 91, 21–28.
Jarvis, P. G. (1976). The interpretation of the variations in leaf water potential and stomatal conductance found in canopies in the field. Philosophical Transactions of the Royal Society of London, Series B, Biological Sciences, 273(927), 593–610.
Knox, R. B. (1993). Grass pollen, thunderstorms and asthma. Clinical and Experimental Allergy, 23(5), 354–359.
Laaidi, K., Laaidi, M., & Besancenot, J. P. (1997). Pollens, pollinoses et météorologie. La Météorologie, 20(8), 41–55.
Laaidi, M., Chinet, T., & Aegerter, P. (2011). Allergies au pollen, pollution et climat : Revue de la littérature. Revue Française D’allergologie, 51(7), 622–628. https://doi.org/10.1016/j.reval.2011.05.004
Laaidi, M., Laaidi, K., & Besancenot, J. P. (2002). Synergie entre pollens et polluants chimiques de l’air : Les risques croisés. Environnement, Risques Et Santé, 1(1), 42–49.
Lajoie, P., Lebel, G., Leduc, R., Boulet, L.P., Bourbeau, J., Bernard, P.M. (1994). Étude sur la relation entre les visites à l'urgence des hôpitaux pour l'asthme, la qualité de l'air et les conditions météorologiques pour la Communauté urbaine de Québec (1990–1991) : rapport final 1992. Département de santé communautaire du Centre hospitalier de l'Université Laval, Québec : ministère de l'Environnement et de la Faune, QEN/QA94–2/6. Envirodoq EN940068. Gouvernement du Québec.
Lee, C. C., & Sheridan, S. C. (2018). Trends in weather type frequencies across North America. npj Climate and Atmospheric Science, 1, 41. https://doi.org/10.1038/s41612-018-0051-7
Mandrioli, P., Comtois, P., Levizzani, V (1998). Methods in aerobiology. Pitagora Editrice Bologna.
Mandrioli, P., Negrini, M. G., Cesari, G., & Morgan, G. (1984). Evidence for long range transport of biological and anthropogenic aerosol particles in the atmosphere. Grana, 23, 43–53.
Marks, G. B., & Bush, R. K. (2007). It’s blowing in the wind: New insights into thunderstorm-related asthma. Journal of Allergy and Clinical Immunology, 120, 530–532. https://doi.org/10.1016/j.jaci.2007.07.012
McConnell, R., Berhane, K., Gilliland, F., Molitor, J., Thomas, D., et al. (2003). Prospective study of air pollution and bronchitic symptoms in children with asthma. American Journal of Respiratory and Critical Care Medicine, 168, 790–797.
Newman-Taylor, A. (1995). Environmental determinants of asthma. The Lancet, 345, 296–297.
Oikonen, M., Hicks, S., Heino, S., & Rantio-Lehtimäki, A. (2005). Separation of long distance transported (LDT) pollen from local mountain birch pollen at the Kevo subarctic monitoring station. Finland. Grana, 44(3), 181–186.
Oksanen, E. (2021). Birch as a model species for the acclimation and adaptation of northern forest ecosystem to changing environment. Frontiers in Forests and Global Change, 4, 682512. https://doi.org/10.3389/ffgc.2021.682512
Power, H. C., Sheridan, S. C., & Senkbeil, J. C. (2006). Synoptic climatology influences on the spatial and temporal variability of aerosol over North America. International Journal of Climatology, 26, 723–741.
Rainham, D. G., Smoyer-Tomic, K. E., Sheridan, S. C., & Burnett, R. T. (2005). Synoptic weather patterns and modification of the association between air pollution and human mortality. International Journal of Environmental Health Research, 15, 347–360.
Robichaud, A. (1993). Concentrations d’ozone troposphérique sur le Québec méridional durant la période 1989–1991. Le Climat, 11(1), 7–40.
Robichaud, A. (2021). A case study of birch pollen and the synergy with environmental factors: Relation to Asthma in Montreal, Canada. Atmosphere, 12(6), 789.
Robichaud, A., & Comtois, P. (2017). Statistical modelling, forecasting and time series analysis of birch phenology in Montreal. Canada. Aerobiologia, 33(4), 529–554. https://doi.org/10.1007/s10453-017-9488-0
Robichaud, A., & Comtois, P. (2019). Environmental factors and asthma hospitalization in Montreal, Canada, during spring 2006–2008: A synergy perspective. Air Quality, Atmosphere & Health, 12, 1495–1509. https://doi.org/10.1007/s11869-019-00744-2
Robichaud, A., & Comtois, P. (2021). Numerical modelling of birch pollen dispersion in Canada. Environmental Research, 2021(194), 110554. https://doi.org/10.1016/j.envres.2020.110554
Rogers, C. A., & Levetin, E. (1998). Evidence of long-distance transport of mountain cedar pollen in Tulsa. Oklahoma. International Journal of Biometeorology, 50(6), 392–402.
Rosas, I., McCartney, H. A., Payne, R. W., Calderón, C., Lacey, J., et al. (1998). Analysis of the relationship between environmental factors (aeroallergens, air pollution and weather) and asthma emergency admissions to a hospital in Mexico City. Allergy, 53, 394–401.
Schultz, D. M., & Vaughan, G. (2011). Occluded fronts and the occlusion process: A fresh look at conventional wisdom. Bulletin of the American Meteorological Society, 92(4), 443–466.
Schwartz, J. (2000). The distributed lag between air pollution and daily deaths. Epidemiology, 11(3), 320–326.
Sheridan, S. C. (2002). The redevelopment of a weather-type classification scheme for North America. International Journal of Climatology, 22(1), 51–68.
Smith, M., Skjoth, C. A., Myszkowska, D., Uruska, A., Puc, M., et al. (2008). Long-range transport of Ambrosia pollen to Poland. Agricultural and Forest Meteorology, 148, 1402–1411.
Stewart, D. R., Saunders, E., Perea, R. A., Fitzgerald, R., Campbell, D. E., & Stockwell, W. R. (2017). Linking air quality and human health effects models: An application to the los angeles air basin. Environmental Health Insights. https://doi.org/10.1177/1178630217737551
Taylor, P. E., & Jonsson, H. (2004). Thunderstorm asthma. Current Allergy and Asthma Reports, 4(5), 409–413.
Thien, F., Beggs, P. J., Csutoros, D., Darvall, J., Hew, M., Davies, J. M., Bardin, P. G., Bannister, T., et al. (2018). The melbourne epidemic thunderstorm asthma event 2016: An investigation of environmental triggers, effect on health services, and patient risk factors. Lancet Planetary Health., 2018(2), e255–e263.
Tian, Q., Li, M., Montgomery, S., Fang, B., Wang, C., et al. (2020). Short-term associations of fine particulate matter and synoptic weather types with cardiovascular mortality: An ecological time-series study in Shanghai, China. International Journal of Environmental Research and Public Health, 17(3), 1111. https://doi.org/10.3390/ijerph17031111
To, T., Zhu, J., Stieb, D., Gray, N., Fong, I., et al. (2020). Early life exposure to air pollution and incidence of childhood asthma, allergic rhinitis, and eczema. European Respiratory Journal, 55, 1900913. https://doi.org/10.1183/13993003.00913-2019
U.S. EPA. (2012). Climate change indicators in the United States, 2012. U.S. Environmental Protection Agency. http://www.epa.gov/climatechange/pdfs/climate indicators-full-2012.pdf. Last accessed, August 7th 2023.
U.S. EPA, OAR. (2015). Health effects of ozone pollution. U.S. EPA. www.epa.gov. Last accessed, August 7th 2023.
Vanos, J. K., Hebbern, C., & Cakmak, S. (2014). Risk assessment for cardiovascular and respiratory mortality due to air pollution and synoptic meteorology in 10 Canadian cities. Environmental Pollution, 185, 322–332.
Ville de Montreal. (2023). Air Quality | Ville de Montréal. https://montreal.ca/en/topics/air-quality. Last accessed, August 7th 2023.
Visez, N., Hamzé, M., Vandenbossche, K., Occelli, F., de Nadaï, P., et al. (2023). Uptake of ozone by allergenic pollen grains. Environmental Pollution, 331, 121793. https://doi.org/10.1016/j.envpol.2023.121793
Wallin, J. E., Segerstrom, U., Rosenhall, L., Bergmann, E., & Hjelmroos, M. (1991). Allergic symptoms caused by long-distance transported birch pollen. Grana, 30, 265–268.
Zhao, T. L., Gong, S. L., Huang, P., & Lavoue, D. (2012). Hemispheric transport and influence of meteorology on global aerosol climatology. Atmospheric Chemistry and Physics, 12, 7609–7624. https://doi.org/10.5194/acp-12-7609-2012
Acknowledgements
The author is very thankful to Dr. Paul Comtois for releasing the data of birch pollen for the period 2000-2012 (collected at Université de Montréal during the same period) and to Dr. Robert Pampalon to allow the use of asthma hospitalization data for Montreal from INSPQ. Great thanks to the NAPS team of Environment and Climate Change Canada for maintaining accurate database of air pollutants in Canada and providing data of good quality. Finally, thanks are given to internal reviewers at ECCC: Rosa Wu and Kirill Semeniuk.
Funding
Open access funding provided by Environment & Climate Change Canada library. No funding was given for this study.
Author information
Authors and Affiliations
Contributions
A.R. has contributed to all aspects of the study. Since I am the only author, all the credits belong to me.
Corresponding author
Ethics declarations
Competing interest
The authors declare no competing interests.
Supplementary Information
Below is the link to the electronic supplementary material.
Rights and permissions
Open Access This article is licensed under a Creative Commons Attribution 4.0 International License, which permits use, sharing, adaptation, distribution and reproduction in any medium or format, as long as you give appropriate credit to the original author(s) and the source, provide a link to the Creative Commons licence, and indicate if changes were made. The images or other third party material in this article are included in the article's Creative Commons licence, unless indicated otherwise in a credit line to the material. If material is not included in the article's Creative Commons licence and your intended use is not permitted by statutory regulation or exceeds the permitted use, you will need to obtain permission directly from the copyright holder. To view a copy of this licence, visit http://creativecommons.org/licenses/by/4.0/.
About this article

Cite this article
Robichaud, A. Use of weather types to analyze the simultaneous abundance of ozone, PM2.5 and allergenic tree pollen: focusing on the potential impact on asthma hospitalization in Montreal, Canada. Aerobiologia (2024). https://doi.org/10.1007/s10453-024-09834-w
Received:
Accepted:
Published:
DOI: https://doi.org/10.1007/s10453-024-09834-w