
Abstract
Daily rainfall data are examined through the temporal analysis of various definitions of variable temporal units (VTUs) consisting of combinations of various starting dates and durations over mid-Ghana. These VTUs are independent of, yet encompass, the starting dates and durations of the major and minor rainy seasons. Within each VTU, total rainfall and number of rainy days are calculated to describe the rainfall characteristics of the unit. Means and variances of each variable are calculated for each unit over two 20-year periods, 1951–1970 (P1) and 1981–2000 (P2). In P2, the major and minor rainy seasons have undergone varying degrees of desiccation. This reduction in rainfall is, however, not temporally or spatially uniform. The widespread decline of mean rainfall totals and number of rainy days during the minor rainy season, often associated with greater inter-annual variability, is particularly threatening to the production of a second crop.
1 Introduction
Rainfall variability has serious implication for food production and livelihood in developing regions such as West Africa where irrigation is limited and inter-annual and multi-decadal variability occurs particularly when associated with declining rainfall total. The situation is exacerbated by the fact that more than half the population in the sub-region is directly engaged in predominantly rain-fed agriculture. Ghana, like the other parts of the sub-continent, has undergone a period of declining annual rainfall total in addition to a shifting regime since the early 1970s and is only showing signs of recovery since 2000 (Owusu et al. 2008; Paeth and Hense 2004). Increases in annual rainfall totals in many parts of Ghana after the year 2000 are evident in the spilling of the Akosombo dam on the Volta River in November 2010. This was the first time in 20 years that the dam had to be spilled due to increases in rainfall (GOG 2010). About 42 % of Ghana’s 238,540 km2 is suitable for cultivation, and only about 27 % of this is actually under cultivation (FAO 2005). In a pilot study in Wenchi, located on the northern fringe of mid-Ghana, Owusu and Waylen (unpublished) identified, in addition to an overall drying, greater reductions in the mean rainfall totals and the mean number of rainy days during the minor rainy season and a slight increase of rains in the short dry spell. This reduction in rainfall and potential diminution of the minor rainy season, if present throughout humid mid-Ghana, is likely to prevent cultivation of crops and crop varieties that have longer growing seasons, as well as the adoption of a single crop per year, instead of the current two crops, under rain-fed agriculture. Such an occurrence will negatively impact on food security. Government agencies and international organizations are currently encouraging the application of seasonal forecast information and weather index insurance as some of the adaptation measures. However, in order to develop models to predict changing rainfall patterns or to utilize available forecast information, it is important to understand both the spatial and temporal extent of the declining and shifting rainfall pattern in the agriculturally important regions in mid-Ghana.
In this study, we employ the methodology used in a pilot study to examine the rainfall regime of stations throughout mid-Ghana (5.5° to 7° N and 2° W to 1° E) to determine the spatial extent of the timing and magnitude of the changes observed at Wenchi. Daily rainfall data are examined through the temporal analysis of various definitions of variable temporal units (VTUs) consisting of combinations of various starting dates and durations. These VTUs are independent of, yet encompass, the starting dates and durations of the major and minor growing seasons as defined by farmers and the Ghana Meteorological Agency (GMet). They allow the identification, examination, and comparison of changes in rainfall regime at time periods relevant to farmers. Within each VTU, two variables are calculated to describe the rainfall characteristics of the unit: total rainfall and number of rainy days. Means and variances of each variable are calculated for each unit over two 20-year periods, 1951–1970 (P1) and 1981–2000 (P2), under the null hypothesis of no significant differences in means and variances between the two periods. A buffer decade of 1970s accounts for peculiar trends observed in West Africa and a generally accepted shift in global climate patterns over that decade (Trenberth 1990; Navarra 1999; Waylen et al. 2000; Chavez et al. 2003; Shi et al. 2007; Owusu et al. 2008). Exclusion of the buffer decade reduces noise that would be created given the multi-decadal oscillatory nature of rainfall in West Africa (Ellis and Galvin 1994; Lare and Nicholson 1994; Ward et al. 2004; Peel et al. 2005). In this way, temporal and spatial variability in the rainfall regime of mid-Ghana, which may threaten the current two crops per year rain-fed agriculture system, may be detected. The main objectives of this research, therefore, are to reveal those portions of the rainfall regime that have undergone changes to detect spatial differences in the nature of the variability across the region and to provide information about sections of the regime and the geographic areas, where traditional agricultural practices would still be sustainable.
2 Study area
The humid region of mid-Ghana runs from west to east between 5° N and 8° N roughly in accordance with the regional rainfall pattern and is bounded to the southwest by the tropical forest, to the southeast by the Coastal (Accra) Plains, and the dry sub-humid areas to the north (Fig. 1). For the purpose of this study, it comprises the administrative regions of Ashanti, Brong-Ahafo, Eastern and Volta (Fig. 1) and includes 11 meteorological stations with records of sufficient length and completeness for the study. According to the GMet classification (Fig. 2), the Brong-Ahafo region falls within agro-climatological zone C and the others form part of zone A. Mean annual rainfall totals increase from 1,000 mm in the south to a peak of 1,500 mm in Ashanti and then diminish again towards the north. The migrating inter-tropical convergence zone (ITCZ) and monsoons produce peak rains in May/June and September/October, with a long dry season (harmattan) lasting from November through March (Fig. 3). The major rainy season begins in late March/early April and runs until mid-July. This is followed by a short dry spell in July–August and the minor rainy season of September–October. The regime displays variability in the time of the onset of each rainy season and the beginning of the short dry spell (Adiku and Stone 1995; Yorke and Omotosho 2010).

Map of Ghana showing the study area

Agro-ecological zones of Ghana based on the Ghana Meteorological Agency classification

Box and whisker plot of monthly rainfall characteristics at Wenchi (1951–2000), illustrating the bi-modal rainfall regime in mid-Ghana. Dots represent 5 and 95 percentiles; whiskers, 10 and 90 %; top and bottom of boxes, 25 and 75 %; and solid line in box, 50 %. Dashed lines are the means
Agricultural production in the humid area of mid-Ghana is highly diversified, including food crops such as yams, maize, and cassava in the drier regions of Brong-Ahafo, Volta, and northern Ashanti and cash crops, such as cocoa, in the wetter portions of Ashanti and Eastern region. The study area is the nation’s breadbasket, making it crucial to the food security of Ghana despite the fact that production is almost completely rain-fed. According to the Ministry of Food and Agriculture (MOFA 2003), only 0.08 % of Ghana’s arable land is under irrigation. Rainfall variability in the study area, therefore, has a significant impact for crop yields and food security in Ghana.
3 Data and methods
Daily rainfall data are provided by the GMet for stations with extensive reliable data from 1951 to 2000. The 11 stations utilized in this study all reported at least 13 complete years of record in each of P1 and P2. Final numbers of complete years of record in both periods ranges from 33 at Agogo to 40 at Kumasi and Konongo. A VTU is a time period with a fixed starting date and prescribed duration calculated for the purpose of identifying patterns in rainfall characteristics, which otherwise would evade annual, seasonal, or monthly analyses. Forty-six starting dates are employed extending from day 30 (March 1) to day 275 (October 1) at 5-day increments, thus starting well before and ending after the traditional growing season. Each possible starting date is associated with periods of duration ranging from 30 to 90 days, at 10-day increments. This arrangement yields 172 VTUs per year of record, that is, 46 starting dates each associated with seven durations. VTUs extending beyond December 31 are excluded. This definition obviates the necessity of defining the conditions that mark the beginning and end of each season in a year, which will vary for different crops. However, it provides information at an appropriately fine temporal scale to be able to capture specific times during which agriculturally relevant characteristics of the rainfall regime might have experienced significant change between P1 and P2.
The random variables of total rainfall and number of rainy days are calculated in each VTU from 1951 to 2000. Evidence of inter-decadal, inter-, and intra-seasonal variability is sought by examining the means and variances of the two variables in the 172 VTUs during P1 and P2. Total rainfall is derived as the sum of all daily rainfall totals within a VTU, and the number of rainy days is the number of non-zero observations. Each of the 344 time series (172 cycles × two variables) is sub-divided into P1 and P2, and the mean and standard deviation in each are calculated. Numerical comparisons of the variances and means are carried out using F and t tests, respectively, at the 0.05 and 0.10 levels. Seven standard tests for normality are performed using the NCSS statistical package (Hintze 2004) on each time series, and the number of tests which reject normality at the 0.05 level is recorded in order to test the validity of the implicit assumption of normality for different starting dates and durations. The Mann–Whitney test (Lewis 1977) is also performed to compare each appropriate P1 and P2 as a non-parametric alternative to the F and t tests as suggested by Owusu and Waylen (unpublished).
4 Results and discussion
Normality cannot be rejected for most of the VTUs; however, the assumption becomes less well-founded during periods of lower rainfall in the very earliest and latest starting dates. In accordance with the central limit theorem, the assumption becomes more valid as the length of VTUs increase and in the portions of the season with larger amounts of rain. Differences in the means and standard deviations of the two derived variables are used to describe the changing rainfall regime between P1 and P2.
4.1 Total rainfall
Over the last two decades (P2) of the past century, mid-Ghana experienced diminishing rainfall totals and higher inter-annual variability as illustrated by the results for Kumasi (Fig. 4). Ten out of the 11 stations studied (Table 1) evince significant reductions in the mean total rainfall in P2 especially during the minor rainy season. In addition to the reductions in rainfall amounts, results also indicate significant intra-annual shifts in rainfall regime. Rainfall totals in most VTUs decline during both the major rainy season (late March to mid-July) and the minor rainy season (mid-August to November), while the short dry spell shows an increase in the mean rainfall totals in P2 at seven stations with one remaining unchanged. At many stations, the rainy season was shorter in P2 than in P1, with significant reductions in the mean rainfall total early in the major rainy season and towards the end of the minor rainy season. There has been a concomitant increase in the standard deviation at the beginning of the major rainy season, suggesting a delay and irregular start to the season. Similar increases in the standard deviation of rainfall totals at the end of the minor rainy season indicate a possible shortening of the season and an earlier start and extension of the long dry season (harmattan). Any rainfall reduction during the minor rainy season has serious implications for rain-fed agriculture and food security, as it is a very short season of about two and a half months. However, the second crop obtained during this time is stored against the long dry season and provide seeds for the following year.

Changes in mean (upper) and standard deviation (lower) of rainfall totals (in millimeters), period 1 minus period 2, at Kumasi. Statistically significant changes at the 0.10 and 0.05 level are indicated by open and closed circles, respectively. Diagonal dashed lines provide approximate indication of the principal seasons and their zones of influence in these diagrams
The short dry spell, however, seems to have experienced a steady (but not significant) increase in the mean rainfall total while, at the same time, experiencing a reduction in the standard deviation at seven stations in a fashion similar to that shown at Wenchi (Fig. 5). This widespread increase in rainfall totals does not benefit agricultural production in the area, as it hinders the slash-and-burn land preparation and increases the threat of losses from fungal diseases following the major rainy season’s harvest.

As in Fig. 4, except for Wenchi
4.2 Number of rainy days
Not surprisingly, the mean number of rainy days per VTU follows similar trends to those of mean rainfall totals, decreasing during both the major and the minor rainy seasons at all stations, except Nsawam located near Accra and the coast where the number has remained unchanged (Table 2). In one important regard, the number of rainy days differs from the pattern of rainfall totals. During the short dry spell, most stations experience fewer rainy days despite the rainfall totals remaining constant or increasing (Fig. 6). Decreases are mostly not significant and may be as fewer as 2–3 days for VTUs of 60-day duration. Mean number of rainy days, however, shows the most significant reduction in both major and minor rainy seasons in mid-Ghana. During the major rainy season, VTUs of 90-day duration, for instance, show reductions in the number of rainy days from 5 to 10 days in P2 as compared to P1. The reduction seems to be more marked during the minor rainy season with as many as 16 fewer days in VTUs of 90 days. Considering that the minor rainy season is about half the length of the major rainy season, there is an increased potential of crop failure. Another important observation is that most changes in the minor rainy season are statistically significant even when reductions are as few as 4 days (Fig. 6), again reflecting the generally short duration of the minor rainy season. In both rainy seasons, the standard deviations generally increase slightly and not uniformly throughout the season. The standard deviations for number of rainy days in the short dry spell remain unchanged or diminish slightly, consistent with mean rainfall total that slightly increased in P2. This signal also displays only slight regional differences among stations with only Wenchi and Berekum, in zone C, and Ho and Ejura in zone A, exhibiting a significant reduction in standard deviation.

As in Fig. 4, except the variable depicted in the change in the number of rainy days
4.3 Spatial variability
The most striking exception to these regional generalizations is Kete-Krachi, which reports increased rainfall totals in P2 as compared to P1 for both the major and the minor rainy seasons and the short dry spell (Fig. 7). Although the characteristics of the short dry spell may have changed slightly at the other stations, Kete-Krachi is the only station to show a significant increase from P1 to P2. For example, VTUs of 40–80-day duration experienced increases in mean rainfall total between 80 and 120 mm during the short dry spell (Fig. 7), and most VTUs in the minor rainy season display increases in excess of 100 mm. Simultaneously, inter-annual variability has increased throughout the rainfall regime (Fig. 7). The number of rainy days decline significantly (0.10 level) by 3–6 days in the major rainy season and by 4–10 days in the minor rainy season from P1 to P2 (Fig. 8), while mean number of rainy days increases from 2 to 4 days during the short dry spell. Inter-annual variability in the number of rainy days declines significantly towards the end of the rainy seasons.

As in Fig. 4 (rainfall total), except for Kete-Krachi

As in Fig. 6 (number of rainy days), except for Kete-Krachi
The anomalous behavior of rainfall at Kete-Krachi may only be explained by the potential impact of the Volta Lake, (which was created by the Akosombo dam in 1964), on the local climate given the location of the station and the general southwest direction of monsoon flow in the study area. The anomaly could not be traced to data error since neither instrumentation nor location of the rainfall station changed over the study period.
The changes observed at the ten remaining stations fall into three distinct spatial groupings:
-
(1)
The two stations in zone C (Wenchi and Berekum) experienced less reduction in total rainfall during the major rainy season (around 40 mm in many VTUs) (Fig. 9). The minor rainy season experienced early termination with significant reduction of around (60 mm) in VTUs of above 60-day duration. The short dry spell recorded an increase of about 20 mm in P2. Variability increased during both major and minor rainy seasons and declined or remained the same in the short dry spell. Mean number of rainy days (Fig. 10) mimics mean rainfall totals with distinct and significant reductions in the two rainy seasons for P2 compared with P1. The standard deviation of number of rainy days did not change much between the two periods. Berekum only shows a significant reduction (0.10 level) in the standard deviation in P2 during the short dry spell.
Fig. 9 
As in Fig. 4 (rainfall totals), except for Berekum
Fig. 10 
Significant reduction in mean number of rainy days during the rainy seasons in zone C. The bottom figure shows reduction inter-annual variability during the short dry spell
-
(2)
Three stations, Kumasi, Konongo and Kpeve, unlike the former grouping, exhibit declining trends, including the short dry spell (Fig. 11). Both rainy seasons had significant reductions in mean rainfall totals with declines up to 80 mm in some VTUs (Fig. 4), particularly towards the end of the minor rainy season. The standard deviation of the number of rainy days increased in the major rainy season and declined in the short dry spell. The clearest distinction of these three stations from zone C is provided by the mean number of rainy days, which declined throughout the year (Fig. 12), with reductions upwards of 6 days in VTUs of more than 60-day duration in the major rainy season and from 12 to 16 days in the minor rainy season. The standard deviation for the number of rainy days was not significantly different between the two periods.
Fig. 11 
As in Fig. 4 (rainfall totals), except for Konongo, typifying forest zone A
Fig. 12 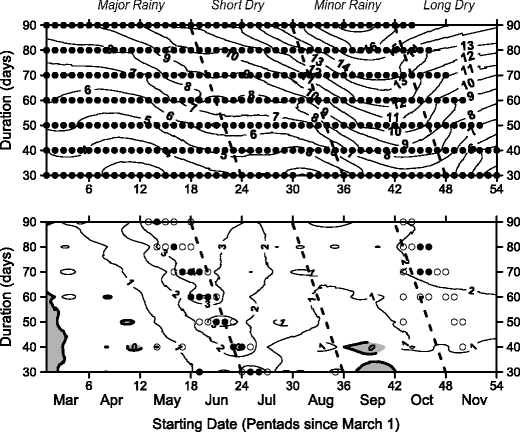
As in Fig. 11, except for the variable of the number of rainy days
-
(3)
The third group consists of the stations to the south and the east of the zone A that show minimal and less consistent reductions. Total rainfall in the major and minor rainy seasons declined from 20 to 40 mm, but differences are significant only at the end of the minor rainy season. Changes in the short dry spell are small and generally not significant. Their standard deviations show no significant change at Ho where a significant reduction was recorded in the minor rainy season. The number of rainy days declines significantly in both major and minor rainy seasons with reductions of 8 days in VTUs of above a 70-day duration, while their standard deviations only significantly increased during the minor rainy season.


Changes in rainfall regime are apparent throughout mid-Ghana and raise two climatological observations: (a) there is considerable regional agreement with the GMA classification of Agro-Ecological zoning of the country. Stations in zone C seem to behave consistently with rainfall reductions in the rainy seasons and increases in the short dry spell. Stations in zone A, however, seem to divide into two major groups: one group on the windward side of the Kwahu plateau, which has, for the most part, experienced significant reductions in both the mean rainfall totals and the number of rainy days throughout the rainy season. The second group, inland of the Plateau, exhibits inconsistent behavior with some reductions in rainfall totals for the two rainy seasons and increases in mean rainfall total during the short dry spell. (b) The influence of the Kwahu Plateau appears to be detectable at this temporal resolution, finer than in the analyses of annual totals completed by Owusu and Waylen (2009), which showed that reductions in annual rainfall were significantly greater in the forest region on the windward side of the Kwahu plateau and only minimal on the leeward side. In this daily analysis, stations in the forest region near Kumasi experience reductions in the mean number of rainy days throughout the year, while inland of the plateau reductions are mainly restricted to the two rainy seasons and, in most cases, the short dry spell has experienced slight increases in rainfall totals.
This multiple station analysis of the changing characteristics of the rainfall regime in agricultural mid-Ghana confirms earlier suggestions by Adiku and Stone (1995) and Owusu and Waylen (unpublished) that changes detected at individual stations may be widespread and have national and regional significance. The humid regions of mid-Ghana, especially the interior forest regions, had a greater reduction in both rainfall totals and number of rainy days in VTUs corresponding to the major and minor rainy seasons, as distinct from the drier regions where changes are restricted mainly to the minor rainy season.
Changes in SSTs, especially those of the Equatorial Atlantic (Opoku-Ankomah and Cordrey 1994), and positive land surface feedbacks (Shanahan et al. 2009) are linked to the north–south migration of the ITCZ and associated monsoonal system to explain changes in the rainfall climatology of the sub-region. The trends identified here are consistent with other studies at the annual scale that have concluded that West Africa and Ghana have undergone a period of reduced rains since the 1970s. The relative stability of the major rainy season and the infilling of the short dry spell that have accompanied the early termination of the minor season also suggest a shift in regime from bi-modal towards uni-modal regime, especially in the northern stations closest to the uni-modal zone D of northern Ghana (Fig. 2). Increases in both mean rainfall totals and number of rainy days during the short dry spell are not necessarily beneficial to the rain-fed agriculture of Mid-Ghana, as the break has traditionally been used for slash and burn to prepare the land for the minor rainy season. The short dry spell is also used to harvest and dry the major rainy season produce. Perhaps, the most devastating aspect of the changing rainfall climatology is reduction in rainfall amounts and early termination of the minor rainy season.
5 Conclusions
Analysis of VTUs applied to daily rainfall in mid-Ghana indicated that the declining rainfall and changing regime reported earlier for Wenchi is widespread and detectable at times and at durations crucial to the traditional rain-fed agriculture of the region. Over the last two decades of the twentieth century, the major and minor rainy seasons have undergone varying degrees of desiccation. This reduction in rainfall is not uniform, either temporally through the rainy seasons or spatially across the study area. Most locations had experienced reductions in rainfall during the minor rainy season and at the beginning of major rainy season, and often an increase in rain during the short dry spell. The universal decline of mean rainfall totals and number of rainy days during the minor rainy season, often associated with greater inter-annual variability, is particularly threatening to the production of a second crop during this time of the year. Meanwhile, increases in means of both variables and reduction in their standard deviations during the short dry spell only exacerbates these problems, as this season has traditionally been used to store the first crop and to perform slash and burn in preparation for the second crop. Humid conditions during the short dry spell increase the likelihood of losses from fungi and hinder the successful burning of cleared vegetation.
The exact nature of these changes varies spatially. Drier portions of the study area, which coincide with zone C of the GMA classification and the eastern side of Zone A, evince an increase in rainfall totals during the short dry spell and smaller reductions in the mean number of rainy days. However, the forested regions in the southwest exhibit reductions in both variables during the major and minor rainy seasons, which is consistent with earlier findings that there have been greater reductions in annual rainfall totals within the forest region than the sub-humid areas of Ghana. The study also confirms the local significance of the Kwahu Plateau in determining the type and extent of low frequency changes in rainfall characteristics as reported by Owusu and Waylen (2009). The plateau bisects the GMet zone A, northwest to southeast, and the degree of spatial variability encountered at daily and annual scales suggests that further sub-division of this zone may be appropriate. The creation of Volta Lake may also have had important local impacts on the rainfall at Kete-Krachi, which is the only station in this study to report increases in means of both variables throughout rainy seasons in P2.
Finally, application of VTU to the analysis of daily rainfall permits the objective examination and comparison of rainfall regimes that experience different changes in time and space of two agriculturally pertinent variables, without the necessity of any a priori judgments or definitions of what constitutes the beginning or end of any seasonal sub-division and over periods pertinent to agriculture. Based on these findings, stakeholders can be provided with information that may facilitate the evaluation of various seasonal solutions (agricultural alternatives) across mid-Ghana to mitigate the probable impacts of rainfall variability and the changing rainfall regime on rain-fed agriculture and other rain-dependant activities. For instance, while the main concern of the changing rainfall climatology in zone C could be the infilling of the short dry spell, the major concern in the forest regions of zone A could be the significant reductions that have occurred in the mean rainfall total and mean number of rainy days in the major rainy season, which suggests that a generalized climate forecast by zone may not be useful in mitigating the impact of rainfall variability and changes in the study area. Based on the findings of this study, farmers in mid-Ghana may reduce crop failure under rain-fed agriculture through late planting during the major rainy season. However, early planting and early-maturing crops may be needed during the minor rainy season to avoid crop failure due to early termination of rainfall.
References
Adiku SGK, Stone RC (1995) Using the Southern Oscillation index for improving prediction and agricultural water management in Ghana. Agric Water Manag 29:85–100
Chavez FP, Ryan J, Lluch-Cota SE, Niquen MC (2003) From anchovies to sardines and back: multidecadal change in the Pacific Ocean. Science 299:217–222
Ellis J, Galvin KA (1994) Climate patterns and land-use practices in the dry zones of Africa. BioScience 44:340–349
FAO (2005) Irrigation in Africa in figures. AQUASTAT Survey. FAO Water Report No. 29. Rome. http://www.fao.org/ag/agl/aglw/aquastat/main/index.stm Accessed 12 May 2010
Government of Ghana (GOG) (2010) VRA opens Akosombo Dam spillway. http://www.ghana.gov.gh/index.php/news/general-news/3781-vra-opens-akosombo-dam-spillway- Accessed 10 July 2012
Hintze JL (2004) Number cruncher statistical system. Dr. Jerry L. Hintze, Kaysville
Lare AR, Nicholson SE (1994) Contrasting conditions of surface water balance in wet years and dry years as a possible land surface-atmosphere feedback mechanism in the West Africa Sahel. J Clim 7:653–668
Lewis P (1977) Maps and statistics. Wiley, New York
Ministry of Food and Agriculture, Ghana (MOFA) (2003) Agriculture in Ghana, facts and figures. Statistics, Research and Information Directorate, Ministry of Food and Agriculture, Accra, Ghana. 2: 1–5
Navarra A (1999) Beyond El Nino: decadal and interdecadal climate variablity. Springer, Berlin
Opoku-Ankomah Y, Cordrey I (1994) Atlantic sea surface temperatures and rainfall variability in Ghana. J Clim 7:551–558
Owusu K, Waylen PR (2009) Trends in Spatio-Temporal Rainfall Variability in Ghana, (1951-2000). Weather 64(5):115–120
Owusu K, Waylen P, Qui Y (2008) Changing rainfall inputs in the Volta basin: implications for water sharing in Ghana. GeoJournal 71:201–210
Paeth H, Hense A (2004) SST versus climate change signals in West African rainfall: 20th century variations and future projections. Clim Chang 65:179–208
Peel MC, McMahon TA, Pegram GGS (2005) Global analysis of runs of annual precipitation and runoff equal to or below the median: run magnitude and severity. Int J Climatol 25:549–568
Shanahan TM et al (2009) Atlantic forcing of persistent drought in West Africa. Science. doi:10.1126/science.1166352
Shi G, Ribbie J, Cai W, Cowan T (2007) Multidecadal variability in the transmission of ENSO signal to the Indian Ocean. Geophys Res Lett. doi:10.1029/2007GL029528
Trenberth KE (1990) Recent observed interdecadal climate changes in the Northern Hemisphere. Bull Am Meteorol Soc 71:988–993
Ward MN et al (2004) Seasonal-to-decadal predictability and prediction of West African climate. CLIVAR Exch 9:14–20
Waylen PR, Compagnucci R, Caffera M (2000) Inter-annual and inter-decadal variability in stream flow from the Argentine Andes. Phys Geogr 21(5):452–465
Yorke CKA, Omotosho JM (2010) Rainfall variability in Ghana during 1961–2005 J. of Ghana Science Association, Vol. 12. No 1
Author information
Authors and Affiliations
Corresponding author
Rights and permissions
About this article
Cite this article
Owusu, K., Waylen, P.R. The changing rainy season climatology of mid-Ghana. Theor Appl Climatol 112, 419–430 (2013). https://doi.org/10.1007/s00704-012-0736-5
Received:
Accepted:
Published:
Issue Date:
DOI: https://doi.org/10.1007/s00704-012-0736-5