
Abstract
In this research paper, the [C13H16N2]5(BiCl6)3Cl compound was synthesized, by slow evaporation, at room temperature. It was analyzed by X-ray diffraction, thermal analysis and impedance spectroscopy techniques. The phase transition at T = (400 ± 5)K was evidenced by DSC measurements and confirmed by the electrical study. The electrical measurements were performed in a wide interval of frequency (40–107 Hz) and temperature (300–440 K). The AC conductivity dependence on angular frequency was found to obey the Jonscher’s universal power law described by \({\sigma }_{\mathrm{AC}}\left(\omega ,{\rm T}\right)={\sigma }_{\mathrm{DC}}({\rm T})+B{\left({\rm T}\right) \omega }^{s({\rm T},\omega )}\). Besides, the AC electrical conduction in the prepared material was explained by two theoretical models related to a hopping transport mechanism: the non-overlapping small polaron tunneling (NSPT) model in phase I and (III) and the correlated barrier hopping (CBH) mechanism in phase (II). DC data were found to obey Arrhenius law with activation energies 133 meV and 1.85 eV in agreement with AC measurements and the frequency-dependent maxima ωmax of the imaginary part of modulus. The Nyquist plots were well fitted to an equivalent circuit model taking into account the contribution of grains and grain boundaries. Furthermore, dielectric permittivities were shown to be consistent with the Havriliak–Negami relaxation model.
1 Introduction
In recent decades, organic–inorganic hybrid materials based on trivalent metal halides have been widely targeted as they represent very dynamic and promising research areas in solid-state chemistry due to their particular and interesting chemical and physical properties offered by the combination of organic and inorganic parts in the same compound [1,2,3,4,5]. In fact, the study of bismuth(III) halides are considered as one of the immense and important fields of chemistry due to their important properties such as magnetic, conductivity, optical, electrical and ferroelectric depending on the effects of different factors such as temperature and composition [6,7,8].
These materials exhibit only weak interactions such as hydrogen bonds, Van Der Waals contacts or electrostatic forces, ensuring the cohesion of the entire structure. Based on a combination of inorganic and organic structural components, they can be described as sequences of alternating organic–inorganic layers. The alkylammonium halogenobismuthates (III) of the general formula RaMbX(3b+a) (where R denotes the organic cation, M = Bi and X = Cl, Br, I) [9] have been extensively studied. They constitute the most interesting hybrid family thanks to their physical properties which lead to ferroelectric, antiferroelectric, pyroelectric, paraelectric, ferroelastic and optical properties [10,11,12,13,14,15] due to their important phase transitions which are mainly of order–disorder type [16,17,18].
Most of these complexes exhibit multiple phase transitions attributed to the reorientation dynamics of the substituted ammonium group [19, 20]. On the other hand, the group 15 element as a Bi(III) ion is characterized by its electronic lone pair ns2 which can be more or less stereochemically active. This activity can switch the energy balance to a ferroelectric state [21]. As an element of this group, salts can be acquired by mixing the amine and bismuth oxide in a solution of the appropriate HX acid (where X = Cl, Br or I). Within bismuth halides, the anionic sub-network is composed of distorted [BiX6] 3 octahedra (X = halogen) linked by isolated molecules forming edges, corners or faces. In this work, we intend to synthesize [C13H16N2]5(BiCl6)3Cl, which is possibly a proton conductor due to the existence of H bonds. In addition, the examination of these compounds is very important. to perceive the behavior of their electronic physical properties under various conditions such as changes in temperature, pressure, frequency, etc.
In this study, we are interested in X-ray powder diffraction, differential scanning calorimetry (DSC), electrical properties as well as dielectric relaxation studies of the [C13H16N2]5(BiCl6)3Cl compound at different temperatures and frequencies.
2 Experimental details
2.1 Synthesis
The synthesis of the compound penta (4,4′-Diaminiumdiphenylmethane) tris (hexachlorobismuthate (III)) chloride was achieved by mixing stoichiometric amounts of 4,4-Diaminodiphenylmethane (C13H14N2) and bismuth nitrate Bi(NO3)3 in a concentrated solution of HCl. The reaction takes place in the presence of ethanol (50 mL). After a week of evaporation at room temperature, single crystals of prismatic shape and yellow color appeared. They are dried and stored in a sealed container to carry out the planned studies. The synthesis of the sample is carried out according to the following reaction:
2.2 X-ray powder diffraction
The phase purity, space group and cell dimensions were determined by X-ray powder diffraction. XRD data were collected at room temperature and obtained using an X’pert Pro powder diffractometer with Cu-Kα radiation (λ = 1.5406 Å). The XRD pattern is realized in the 2θ range between 5° and 64° with operating conditions of 40 kV and 50 mA. The FULLPROF program based on the Rietveld method was used to perform the refinements.
2.3 Thermal analysis
DSC analysis was obtained using a Perkine Elmer DSC-7 calorimeter at a heating rate of 5 K/min with a 3.7 mg in weight powder sample placed in an hermetic aluminum cell under an inert atmosphere. (nitrogen gas). Differential scanning calorimetry was recorded in the 375–650 K range. The thermal analyzes (TGA) were carried out using a PYRIS 6 instrument in the same temperature range (from 375 to 650 K).
2.4 Impedance measurements
The finely grained [C13H16N2]5(BiCl6)3Cl sample was at first pressed into a pellet of 3 mm in diameter and 1.2 mm in thickness using a hydraulic press at a 3 t/cm2 pressure. Second, a thin layer of gold was deposited on either side of the pellet, to obtain ohmic contacts. To provide the conductance measurements, an Agilent 4294A analyzer was used in a wide frequency range (40 Hz–10 MHz) with an applied AC electrical signal having an amplitude of 50 mV. A liquid nitrogen cooled VPF-100 cryostat from Janis Corporation is used to provide the temperature variation.
3 Results and discussion
3.1 Powder X-ray diffraction analysis
Figure 1 illustrates the XRD diagrams of the studied [C13H16N2]5(BiCl6)3Cl hybrid material. The data were analyzed by means of the Rietveld method using the FULLPROOF program. After several optimizations, all the lines are indexed in the triclinic system with Pī space group. The determined unit cell parameters are: a = 14.8424(1) Å, b = 14.8221(9) Å, c = 23.1619(4) Å, α = 89.171(8)°, β = 84.216(0) and γ = 73.8345(7)°. The unit cell volume (V = 4868.67(9) Å3) was calculated using the relationship:

Powder X-ray diffraction pattern of [C13H16N2]5(BiCl6)3Cl
The obtained parameters are in agreement with those evaluated by X-ray single crystal reported by the literature, which proves the purity of our synthesized compound [22, 23].
3.2 Crystalline parameters
Single crystal X-ray diffraction analysis confirms that the penta(4,4′-Diaminiumdiphenylmethane) tris (hexachlorobismuthate (III)) chlorure crystallizes at room temperature crystallizes in the triclinic system with space group Pī. The refined parameters are confirmed to be: a = 14.7757(2) Å, b = 14.7799(2) Å, c = 23.1633(4) Å, α = 89.016(2)°, β = 84.0080(1)°, γ = 74.0400(1)°, V = 4836.57(13) Å3 and Z = 2 at 296 K. The packing of [C13H16N2]5(BiCl6)3Cl viewed along (b,c) plane is created with DIAMOND (Fig. 2). Examination of the crystal showed that the main feature of the atomic arrangement in this compound naturally forms a periodic three-dimensional structure that consists of alternating layers of organic–inorganic corrugated layers stacked along the a-axis. Moreover, the organic group was located at approximately x = 1/4 and x = 3/4 and the [BiCl6]3− anions were arranged in parallel layers separated by the (C13H16N2)+ cations.

Crystal packing of [C13H16N2]5(BiCl6)3Cl compound in the bc plane
In the studied compound, the Bi atom occupies a particular position surrounded by six Cl atoms forming a weakly distorted octahedral configuration with the Bi–Cl bond lengths ranging between 2.604(7) and 2.839(7) Å and the Cl–Bi–Cl angles are between 82.8(2) and 179.5(2)°. The [BiCl6]3− monomers are located in the [100] plane at x = 0, x = 1/2 (Fig. 2). The organic molecule exhibited a regular spatial configuration with normal C–C and C–N distances in the range between 1.29(6) and 1.53(4) Å and 1.45(3) and 1.52(6) Å, respectively, and C–C–C and C–C–N angles in the range between 114(3)° and 126(4)°, respectively.
The cationic moieties do not appear to form π–π stacking interactions. Moreover, the spaces between the inorganic entities are filled by organic cations ensuring their connection via the N–H…Cl and C–H…Cl hydrogen bonds giving rise to a three-dimensional network. The N–Cl and C–Cl distances varied between 3.08(3) and 3.64(3)Å and the angle values varied between 107.00° and 174.00°.
3.3 Thermal properties
The thermal analysis differential scanning calorimetry (DSC) and a thermogravimetric analysis (ATG) were carried out to characterize the thermal stability of the [C13H16N2]5(BiCl6)3Cl compound, whose results are reported in Fig. 3.

Simultaneous DSC and TGA scans for the [C13H16N2]5 (BiCl6)3⋅Cl crystal
The measurements were carried out in the temperature range 375–650 K on a monocrystalline sample with a mass of 3.7 mg of this material. The heating rate was set at 5 K/mn. The differential scan enthalpy analysis chart shows the existence of three peaks. The first endothermic peak observed around 405 K suggests the existence of a phase transition of this material and allows to classify it as being a second-order transition with an enthalpy value ΔH = 65.854 103 J kg−1. Indeed, no weight loss was detected on the ATG thermogram at this temperature. The second energetic endothermic peak around 563 K corresponds to the degradation of this material with a loss of mass in the ATG curve which spreads, respectively, between 527 and 548 K and which can be interpreted by the melting of the material. This confirms that our prepared compound is anhydrous and that there is no surface or structural water present. The third exothermic peak located at 572 K can be attributed to the decomposition of the product.
3.4 Impedance analysis
Complex impedance spectroscopy (CIS) is one of the most powerful experimental techniques for studying the electrical and dielectric properties of insulating and semiconductor compounds over a wide range of frequencies and temperatures. Moreover, this method allows us to separate the contributions of the electrodes, grains and grain boundaries to the conduction process and, thus, gives an idea about the properties of the material. In addition, this technique is considered a useful tool to determine bulk and grain boundary related strength and capacitance in the compound under study.
This electrical response indicates a non-Debye type of relaxation. The shape of the diagrams suggests that the relaxation is of the Cole–Cole type [24]. The existence of two contributions seems obvious. This behavior can be attributed to many reasons such as random distribution of atomic defects, grain boundaries, stress–strain phenomena [25].
Figure 4a, b shows the Nyquist plots (−Z″ vs Z′) for the [C13H16N2]5(BiCl6)3Cl compound at some representative temperatures. It is obvious that the curves obtained tend to bend towards the abscissa forming semi-circles whose centers are located below the Z' axis. This electrical response indicates a non-Debye type of relaxation. The shape of the diagrams suggests that the relaxation is of the Cole–Cole type [24]. The existence of two contributions is obvious. This behavior can be attributed to many reasons such as the random distribution of atomic defects, the presence of grain boundaries as well as stress–strain phenomena [25].

Complex impedance spectra (Nyquist plots) with electrical equivalent circuit for the [C13H16N2]5(BiCl6)3Cl compound at different temperatures: a 300 ≤ T ≤ 370 K and b 375 ≤ T ≤ 440 K
It can also be observed that the diameters of the obtained semi-circles decrease with the increase in temperature showing that the conduction mechanism in the material is thermally activated.
The obtained impedance data fitted well to an equivalent circuit which consists of two parallel circuits associated in serial reflecting the contribution of grains and grain boundaries in the conduction process [26,27,28,29]. The first circuit, describing the response of the circuit at low frequencies, is composed of a parallel combination of a resistor Rg and a constant phase element CPEg and describes the transport of charge carriers through the grains. While the second one, describing the response of the circuit at higher frequencies, is formed by a parallel combination of a resistor Rgb, a capacitor Cgb and a constant phase element CPEgb and describes the transport through the grain boundaries. It is important to note that the impedance of the fractal capacitance CPEg,gb is given by [24]:
In this expression, Qg,gb is the capacitance value of the CPE impedance and α1,2 (0 < α1,2 < 1) represents the deviation from Debey’s model. As a result, the two parts Z′ and Z″ of the complex impedance of this circuit can be given by:
As shown in Fig. 4a, b, the experimental Nyquist plots were well adjusted by the simulated data (red lines) based on relations (4) and (5), which confirms the validity of the proposed model. It is well recognized that the effect of grains and grain boundaries which is usually due to the presence of defects in the structure is crucial in controlling the electrical and dielectric properties of the compound.
Figure 5a depicts the frequency dependence of the real part of impedance (Z′) at different temperatures. As clearly seen, the magnitude of Z′ is typically higher at lower temperatures and frequencies. But, with the increase in both frequency and temperature, Z′ decreases gradually indicating an increase in AC conductivity of the compound [28]. In the high-frequency region (> 104 Hz), all these curves merge and Z′ becomes frequency independent. At high frequencies, Z′ shows lower values which may be attributed to the release of space charge polarization [30].

Frequency evolution of the real part (a) and imaginary part (b) of the impedance at various temperatures relative to the studied compound. The red solid line represents the fit of the experimental data
Besides, Fig. 5b illustrates the variation of Z″ with frequency at various temperatures. These plots are characterized by the appearance of peaks with a maximum amplitude noted (\({Z}_{\mathrm{Max}}^{"}\)) which shift to higher frequency side with the increase in temperature indicating a thermally activated relaxation phenomenon in the system. This observation indicates also the drop in the resistive properties [31]. It is worth noticing that the Z′ and Z″ spectra are well fitted by relations (4) and (5) pointing that the proposed equivalent circuit describes reasonably well the electrical response of the [C13H16N2]5(BiCl6)3Cl Compound.
3.5 AC electrical conductivity
3.5.1 Temperature and frequency evolution of the AC conductivity
The frequency dependence of alternating current (AC) conductivity at different temperatures for the [C13H16N2]5(BiCl6)3Cl hybrid compound is shown in Fig. 6. Indeed, at a fixed temperature, these curves show the presence of two regions characterizing the conductivity behavior. In the first region (at low frequencies), the AC conductivity remains almost constant and the conductivity is found to be independent of frequency. In the second region corresponding to the term BωS, the increase of the conductivity with the angular frequency shows a dispersion phenomenon. The increase of σAC with frequency represents the typical behavior of a semiconductor material. This occurs at higher frequencies with increasing temperature; this region corresponds to BωS. These results suggest that this behavior can be interpreted using Jonscher's universal power law [32]:
where ω = 2πf is the angular frequency, σDC is a constant which depends only on temperature, \(B\) is a pre-exponential factor and s, which varies between 0 and 1, represents the degree of interaction between the mobile ions and its surrounding lattices. Results of the refinement of σAC(ω) conductivity spectra at various temperatures using Jonscher’s power law are gathered in Table 1. As illustrated in Fig. 6, a good agreement is obtained between experimental data and Jonscher power law (red lines).

Frequency dependence of σAC at various temperatures for [C13H16N2]5(BiCl6)3Cl compound
The obtained results of σDC, B and s can be used to calculate the hopping frequency of charge carriers ωh in the dispersion region of the AC conductivity through the following expression [33]:
The obtained values are shown in Table 1. As a result, σAC(ω) can be expressed by the Almond–West relation [34] given by:
This conductivity can be described by the Ghosh model that normalizes ω by ωh and σAC(ω) values by σDC [33]:
The results are grouped in Fig. 7a. By examining the curves, it can be noticed that the normalized plots collapse onto a single master plot which indicates that the relaxation dynamics of charge carriers in the studied hybrid compound is independent of temperature [35]. Thus, the ωh values turn out to be the appropriate frequencies needed to scale the experimental σAC(ω) data at different temperatures. Moreover, the AC conductivity values which increases noticeably at high frequencies can be attributed to the charge carriers localized in the grains [36].

a Conductivity master curves and b evolution of ωh versus 1000/T and the determined activation energies for [C13H16N2]5(BiCl6)3Cl compound
Figure 7b displays the plot of Ln(ωh) against (1000/T) for our hybrid compound. This evolution obviously shows an Arrhenius-type behavior in the two regions below and beyond 400 K corresponding to the transition temperature. This evolution can be described by the relation:
where ω0 is a constant, kB is the Boltzmann constant and Ea1 and Ea2 are the activation energies. For T > 400 K, Ea1 = 129 meV and For T < 400 K, Ea2 = 1.061 eV. The observed difference between the activation energies in the two regions can be attributed to the motion of the anionic [BiCl6]3− and cationic (C13H16N2)+ parts with temperature.
3.5.2 Theory investigation of the conduction mechanism
To identify the conduction mechanism that governs the AC conductivity with respect to the studied hybrid material, we can select the appropriate model for the conduction mechanism based on the behavior of the exponent s as a function of temperature [8].
Several theoretical models can be attributed based on two distinct processes, namely quantum mechanical tunneling and classical hopping over a barrier. These different models are:
-
The CBH model (correlated barrier hopping) where the s values decrease with increasing temperature [37]. This model is in good agreement with the results obtained in phase II.
-
The NSPT model (non-small polaron tunnel) where the exponent s increases with increasing temperature [38].
-
The OLPT model (overlapping large-polaron tunneling) where the exponent s depends on both frequency and temperature. Moreover, with the increase in temperature, s decreases until a minimum value and then increases when the temperature increases [39].
-
The QMT (quantum mechanical tunnel effect) model in which the exponent s is independent of temperature or at the limit increases slightly with increasing temperature [40].
Figure 8a gives the evolution of the exponent “s” as a function of temperature. It is clear that with increasing temperature, the exponent s decreases in region II but increases in regions I and III. This indicates that the CBH model is the appropriate model which can describe the electrical conduction mechanism in phase II while the (NSPT) model is applicable in phase I and III.
-
Correlated barrier hopping (CBH) model (region II)
Fig. 8 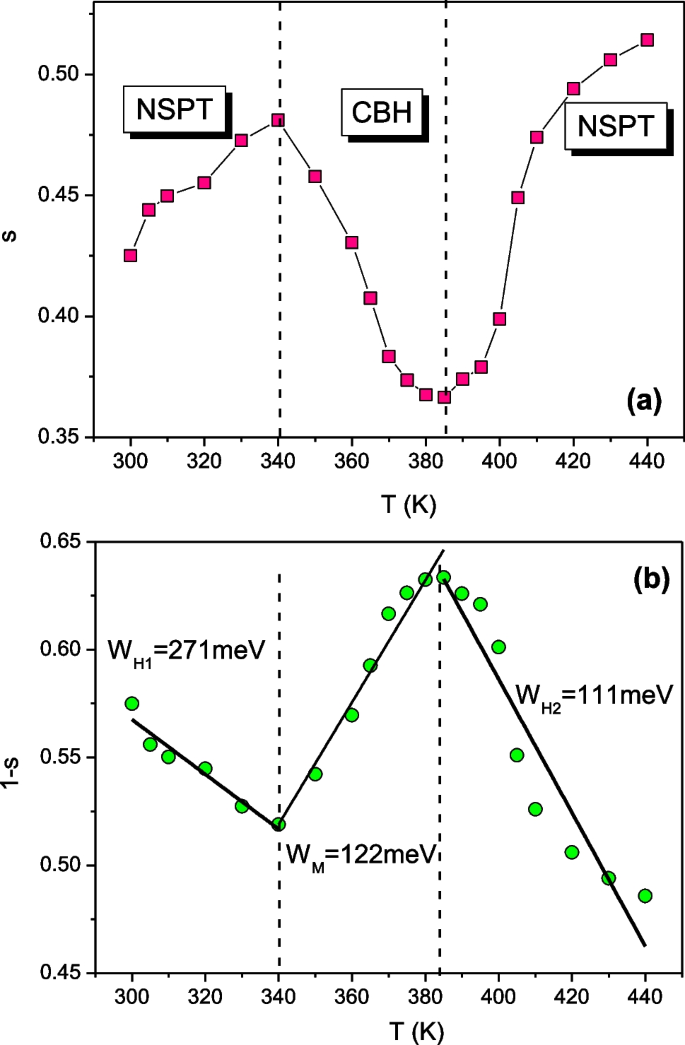
Temperature evolution of s (a) and (1 − s) parameters (b) for the [C13H16N2]5(BiCl6)3Cl compound
The correlated barrier hopping (CBH) model is used to describe the conduction mechanism in many organic–inorganic hybrid materials. According to this model, the conduction process occurs via single polaron or bipolaron hopping mechanism over the Coulomb barrier separating two adjacent defect centers. This model has been developed by Elliot [41, 42]. According to the CBH model, the exponent s obeys to the following relation:
$$s=1-\frac{{6{\rm K}}_{\mathrm{B}}{\rm T}}{{W}_{\mathrm{\rm M}}-{\rm K}_{\mathrm{B}}{\rm T} \mathrm{Ln}\left(\omega {\tau }_{0}\right)},$$(11)where τ0 is the characteristic relaxation time estimated in the order of an atom vibrational period and WM is the binding energy of charge carriers in their localized sites. For large values of WM/KBT, Eq. (11) can be written as [43]:
$$s=1-\frac{{6{\rm K}}_{\mathrm{B}}{\rm T}}{{W}_{\mathrm{\rm M}}}.$$(12)Figure 8b reveals the variation of (1 − s) as a function of temperature. The linear fit of the curve in region II permits us to determine the value of WM which equals 122 meV.
-
The small polaron tunneling (SPT) model (regions I and III)
Small polaron tunneling (NSPT) can be appointed in a covalent solid if the addition of a charge carrier to a site produces a large degree of local lattice distortion. According to the NSPT model, the exponent s could be calculated using the formula:
$$s=1-\frac{{6{\rm K}}_{\mathrm{B}}{\rm T}}{{W}_{\mathrm{H}}-{\rm K}_{\mathrm{B}}{\rm T} \,\mathrm{Ln}\left(\omega {\tau }_{0}\right)}.$$(13)In the above relation, WH is the polaron hopping energy and τ0 is the characteristic relaxation time. For large values of WH/KBT, s becomes:
$$s=1-\frac{{6{\rm K}}_{\mathrm{B}}{\rm T}}{{W}_{\mathrm{H}}}.$$(14)In graph (1 − s) (Fig. 8b), the fit of the curve in phases I and III was used to calculate the value of WH from Eq. (9). The obtained value is 271 meV in phase I and 111 meV in phase III.

3.6 DC electrical conductivity
The temperature evolution of the DC conductivity data \({\sigma }_{\mathrm{DC}}\) for [C13H16N2]5(BiCl6)3Cl compound reported at low frequencies (at 40 Hz) is illustrated in Fig. 9a. As shown, our compound shows a semiconductor behavior in the whole range temperature of study with a small anomaly around 400 K. This result confirms the phase transition observed at T = 400 K by DSC measurements. The DC conductivity is attributed to the displacement of charge carriers through the structure [44].

a Temperature evolution of σDC and b evolution of Ln(σDCT) versus 1000/T at high temperatures relative to the [C13H16N2]5 (BiCl6)3Cl compound
We report in Fig. 9b, the evolution of Ln (σDC⋅T) versus the inverse of temperature (1000/T) relative to the studied material. As shown, in the high-temperature range, this variation is linear suggesting that the hopping mechanism is thermally activated. In this case, σDC is described by the Arrhenius law given by
where σ0 is a constant and Ea2 is the activation energy evaluated at Ea1 = 133 meV for T > 400 K and Ea2 = 1.085 eV for T < 400 K. The obtained value agrees well with that obtained by AC conductivity data which proves that the charge carriers have to overcome approximately the same barrier height while applying a DC or an AC. This effect proves, particularly, that the transport phenomenon is provided by the same defects and ensured by hopping mechanism.
3.7 Electrical modulus study
It is well recognized that the complex electrical modulus formalism is an alternative approach used to study the electrical properties of the sample. It provides insight into electrical processes; thus, it is a suitable approach to extract phenomena such as conductivity relaxation times and electrode polarization [45]. Mathematically, the complex electrical modulus can be described by the following equation: (j2 = −1):
The frequency evolution of the real part of the electrical modulus M′ over the whole range of temperature of study is depicted in Fig. 10. At low frequencies, the value of M′ at all studied temperatures nearly approaches zero value suggesting the suppression of the electrode polarization. On the other side, at high frequencies, M′ reaches a maximum approaching eventually to M∞ due to the relaxation process and to the conduction phenomena characterized by short-range mobility of charge carriers.

Angular frequency dependence of the real part of electric modulus determined at different temperatures for [C13H16N2]5(BiCl6)3Cl compound
Figure 11a illustrates the variation of the imaginary part of the electrical modulus (M″) according to the frequency at several temperatures. The analysis of the results shows a broad and asymmetric vertex around the maxima. At low frequencies, the value of M″ which is close to zero confirms the non-contribution of the electrode effects [46]. From the plots, one can notice the presence of two asymmetric peaks: the first peak, observed at low frequencies, corresponds to the effects of grain boundaries and the second peak detected at high frequencies, is associated with the effects of grains. Moreover, we can see that the position of the peak \({M}_{\mathrm{max}}^{"}\) located at ωmax shifts towards higher frequencies as the temperature increases.

a Angular frequency dependence of the imaginary part M″ of electric modulus determined at various temperatures and b plot of Ln(ωmax) versus 1000/T for [C13H16N2]5(BiCl6)3Cl compound
Located in the region below the ωmax position peaks of M″, the charge carriers can be considered to be mobile over long distances. However, the frequency regions above ωmax determine the range in which carriers are confined to potential wells and mobile over short distances [8].
The imaginary part of the M″ (\(\omega\)) has been approximated as:
In this relation, ωmax and M″max represent, respectively, the peak frequency and the peak maximum of the imaginary part M″ of the modulus, and β the well-known Kohlrausch parameter. In our case, the shape of each spectrum was described by the β value which is determined by fitting the curve to Eq. (17).
The initial value of β was determined from the full width at half maximum of the M″ spectrum. The β values were taken as a free parameter in order to obtain the fit to relation (17) at each temperature. It should be noted that the best fit of the M″(ω) curves at different temperatures of the compound studied is shown in Fig. 11a. Table 2 displays the temperature dependence of β obtained from the fits. It is evident that the β value is temperature dependent and lies in the range 0 < β < 1 reflecting the importance of coupling between mobile ions in the conduction process.
The plot of Ln(ωmax) as a function of 1000/T relative to our sample conforms to Arrhenius’ law as depicted in Fig. 11b. The calculated activation energies are Ea1 = 136 meV (for T > 400 K) and Ea2 = 1.022 eV (for T < 400 K). These values are close to those obtained from the AC and DC analyses confirming that the transport of the charge carriers in the studied structure is done by the same process which is the jump mechanism [47].
3.8 Dielectric study
To analyze the dielectric results, we have used the Havriliak–Negami model [48] which is the closest method to fit our experimental data.
Indeed, according to the Havriliak–Negami equation, the complex permittivity ε*(ω) can be described by [48]:
In this expression, ε'(ω) and ε″(ω) are, respectively, the real and the imaginary parts of the dielectric permittivity. These terms describe the storage and the loss of energy while applying an external electric field. In this relation also, εs and ε∞ are the permittivities at low and high-frequency sides, α is the shape parameter which represents a symmetrical distribution of relaxation time, whereas β represents the shape parameter of an asymmetric relaxation curve. From the previous relation, ε'(ω) and ε″(ω) can be expressed by:
and
where
In fact, the Havriliak–Negami (HN) theory involves the Debye (α = β = 1), the Cole–Cole (β = 1) and the Cole–Davidson (α = 1) models.
In Fig. 12a, b, we depicted the frequency evolution of the real part ε′ of the complex dielectric permittivity at 300 ≤ T ≤ 440 K relative to the studied compound. The experimental data display, at low frequencies, high values of the dielectric constant but they decrease until they reach a constant value (εs). Figure 12b shows the fit of ε′(ω) at some selected temperatures with relation (19).

a Frequency dependence of the real part ε′ of dielectric permittivity determined at different temperatures, b fit of ε′ with the Havriliak–Negami model at some temperatures and c temperature evolution of ε′ determined at some selected frequencies for [C13H16N2]5(BiCl6)3Cl compound
Interestingly, the larger values of ε′ obtained at lower frequencies (up to 2⋅104F m−1) can be attributed to the charge accumulation of defects at the interfaces and electrodes of the compound resulting in space charge polarization. Indeed, in this frequency range, all types of polarization can contribute to the total polarization of the material such as polarization by space charge (interfacial polarization), ions, dipoles and electrons [28]. In the high-frequency range, the ions present in the structure can no longer follow the rapid evolution of the applied electric field, which leads to drops in ε′.
Regarding Fig. 13a, it shows the frequency evolution of the imaginary part ε″ of the complex dielectric permittivity at temperatures varying from 300 to 440 K for our [C13H16N2]5(BiCl6)3Cl compound. In fact, we can observe a broad and displacement of dielectric relaxations with increasing temperature. In Fig. 13b, we have shown the fit of ε″(ω) curves determined at some selected temperatures using relation (20) confirming the good choice of the Havriliak–Negami model for describing the relaxation mechanism in the structure.

a Frequency dependence of the imaginary part ε″ of dielectric permittivity determined at different temperatures, b fit of ε″ with the Havriliak–Negami model at some temperatures and c temperature evolution of ε″ determined at some selected frequencies for [C13H16N2]5(BiCl6)3Cl compound
The thermal variation of permittivity ε′ and ε″ of the studied compound, at some frequencies, is depicted in Figs. 12c, 13c. An overview of the results obviously shows the existence of one anomaly, characterized by a maximum of ε′ and a minimum of ε″ at about 400 K that can be attributed to the phase transition. This behavior confirms the results detected by the DSC method. It is clear the existence of a very large increase in permittivity around T = 400 K. Indeed, it is obvious from these figures that at low temperatures, the permittivity keeps almost constant values. This is may be explained by the restricted reorientational motions of the charge carriers at low temperatures. Indeed, the dipoles are relatively frozen in their sites and cannot orient themselves with respect to the direction of the applied electrical field. As a result, they hold a weak contribution to the polarization [8]. As the temperature rises (T > 400 K), the variation of ɛ′ and ɛ″ shows a strong dispersion. This behavior is associated with the increase of the disorder in the [C13H16N2]5(BiCl6)3Cl compound. The corresponding induced disorder weakens the Van Der Waals forces and electrostatic interaction. For this reason, the charge carriers can orient themselves with respect to the direction of the applied electric field [49].
4 Conclusion
In this study, the [C13H16N2]5(BiCl6)3Cl hybrid compound was successfully synthesized and characterized using several techniques. The X-ray diffraction of this sample, performed at room temperature, showed a triclinic system. The differential scanning calorimetric shows one phase transition at (400 ± 5)K. The impedance spectroscopy measurements were determined in the temperature and frequency ranges 300–440 K and 40–107 Hz, respectively. Moreover, the impedance data were well fitted to an equivalent circuit formed by two parallel circuits associated in serial describing the contribution of grains and grains boundary in the conduction mechanism. The variation of AC conductivity measurements σAC as a function of frequency at 300 ≤ T ≤ 440 K is found to obey Jonscher’s universal power law. The conduction mechanism in [C13H16N2]5(BiCl6)3Cl is explained by two approaches: the NSPT model was the suitable model to describe the electrical conduction mechanism in phase I and III. But, in phase II, the most suitable model is the correlated barrier hopping (CBH) mechanism.
On the one hand, the evolution of the DC conductivity σDC and ωmax, as a function of the temperature, confirms the transition phase observed in the DSC study.
On the other hand, the frequency-dependent maxima of the imaginary part of the modulus, the AC and DC data, obey Arrhenius' law with approximately the same activation energies. Moreover, we demonstrated that the Havriliak–Negami relaxation model describes the dielectric results well. Additionally, the giant dielectric values obtained with our structure allow to propose the [C13H16N2]5(BiCl6)3Cl as a new compound for electronic devices.
Data availability
The data that support the findings of this study are not openly available and are available from the corresponding author upon reasonable request.
References
K. Kahouli, A.B.J. Kharrat, M.S.M. Abdelbaky, S. Garcia-Granda, K. Khirouni, S. Chaabouni, Synthesis, crystal structure, vibrational properties, optical properties and Hirshfeld surface analysis of a new Bi (III) halide complex: (C2H8N)3BiBr6 for optoelectronic devices. Indian J. Phys. (2022). https://doi.org/10.1007/s12648-022-02407-y
A.H. Reshak, H. Kamarudin, I.V. Kityk, S. Auluck, J. Mater. Sci. 48, 5157–5162 (2013)
T.M. Brenner, D.A. Egger, L. Kronik, G. Hodes, D. Cahen, Nat. Rev. Mater. 1, 15007 (2016)
A.R. Lim, P. Bong, S. Jeong, Solid State Commun. 143, 432–436 (2007)
V. Kapustianyk, V. Rudyk, M. Partyka, Phys. Stat. Solidi 244, 2151–2158 (2007)
M. Bujak, J. Zaleski, Cryst. Eng. 4, 241–252 (2001)
M. Faghihnasiri, M. Izadifard, M.E. Ghazi, Physica B 582, 412024 (2020)
K. Kahouli, A. Kahouli, K. Khirouni, S. Chaabouni, J. Mol. Struct. 1199, 126944 (2020)
G. Xu, Y. Li, W. Zhou, G. Wang, X. Long, L. Cai, M. Wang, G. Guo, J. Huang, G. Bator, R. Jakubas, J. Mater. Chem. 19, 2179–2183 (2009)
A. Piecha, A. Gągor, R. Jakubas, A. Ciżman, R. Janicki, W. Medycki, Inorg. Chem. Front. 4, 1281–1286 (2017)
F. Lambarki, A. Ouasri, H. Zouihri, A. Rhandour, J. Mol. Struct. 1142, 275–284 (2017)
M. Essid, Z. Aloui, V. Ferretti, S. Abid, F. Lefebvre, M. Rzaigui, C.B. Nasr, Inorg. Chim. Acta 457, 122–129 (2017)
S.A. Adonin, M.I. Rakhmanova, D.G. Samsonenko, M.N. Sokolov, V.P. Fedin, Inorg. Chim. Acta 450, 232–235 (2016)
J. Zhang, S. Han, C. Ji, W. Zhang, Y. Wang, K. Tao, Z. Sun, J. Luo, J. Chem. Eur. 23, 17304–17310 (2017)
T. Singh, A. Kulkarni, M. Ikegami, T. Miyasaka, A.C.S. Appl, Mater. Interfaces 8, 14542–14547 (2016)
W. Trigui, A. Oueslati, I. Chaabane, F. Hlel, J. Ionics 20, 231–241 (2014)
M. Khelifi, I. Mkaouar, F. Hlel, A.B. Salah, R. Zouari, J. Ionics 16, 709–715 (2010)
B. Kulicka, R. Kinzhybalo, Z. Jakubas, J. Ciunik, W. Baran, Medycki. J. Phys. Condens. Matter 18, 5087–5104 (2006)
N. Hannachi, K. Guidara, A. Bulou, F. Hlel, J. Mater. Res. Bull. 45, 1754–1761 (2010)
N. Weslati, I. Chaabane, A. Bulou, F. Hlel, J. Phys. B Condens. Matter 441, 42–46 (2014)
N. Bi, N.L. Mercier, P. Auban-Senzier, C. Pasquier, J. Chem. Mater. 21, 4099–4101 (2009)
I.D. Williams, P.W. Brown, N.J. Taylor, Acta Crystallogr. C 48, 263–266 (1992)
A. Yu Oleshchuk, G.A. Kiosse, Z.A. Bobrova, L.A. Shuvalov, T.I. Malinovskii, Sov. Phys. Crystallogr. 34, 690 (1989)
R. Mguedla, A.B.J. Kharrat, N. Moutia, K. Khirouni, N. Chniba-Boudjada, W. Boujelben, J. Alloys. Compd. 836, 155186 (2020)
K. Kumari, A. Prasad, K. Prasad, Am. J. Mater. Sci. 6, 1–18 (2016)
J.R. Mac Donald, Impedance Spectroscopy: Emphasizing Solid Materials and Systems (John Wiley & Sons, New York, 1987)
A.B.J. Kharrat, K. Khirouni, W. Boujelben, Phys. Lett. A 382, 3435–3448 (2018)
A.B.J. Kharrat, N. Moutia, K. Khirouni, W. Boujelben, Mater. Res. Bull. 105, 75–83 (2018)
H.E. Sekrafi, A.B.J. Kharrat, M.A. Wederni, N. Chniba-Boudjada, K. Khirouni, W. Boujelben, J. Mater. Sci. Mater. Electron. 30, 876 (2019)
A.B.J. Kharrat, M. Bourouina, N. Moutia, K. Khirouni, W. Boujelben, J. Alloys. Compd. 741, 723–733 (2018)
M. Nadeem, M.J. Akhtar, J. Appl. Phys. 104, 1037 (2008)
A.K. Jonscher, J. Nat. 250, 191–193 (1974)
W. Ncib, A.B.J. Kharrat, M.A. Wederni, N. Chniba-Boudjada, K. Khirouni, W. Boujelben, J. Alloys. Compd. 768, 249–262 (2018)
D.P. Almond, A.R. West, Solid State Ion. 9–10, 277–282 (1983)
A. Ghosh, A. Pan, J. Phys. Rev. Lett. 84, 2188–2190 (2000)
K.S.A. Kumar, R.N. Bhowmik, Mater. Res. Expr. 4, 126105 (2017)
M.A. Fersi, I. Chaabane, M. Gargouri, Physica 444, 89–93 (2014)
H. Kchaou, K. Karoui, A.B. Rhaiem, Physica E 85, 308–315 (2017)
R.N. Bhowmik, M.C. Aswathi, Compos. Part B Eng. 1601, 457–470 (2019)
M.B. Bechir, K. Karoui, M. Tabellout, K. Guidara, A.B. Rhaiem, J. Appl. Phys. 115, 153708 (2014)
S.R. Elliott, J. Adv. Phys. 36, 135–217 (1987)
I.G. Austin, N.F. Mott, J. Adv. Phys. 18, 41 (1969)
W. Ncib, A.B.J. Kharrat, M. Saadi, K. Khirouni, N. Chniba-Boudjada, W. Boujelben, J. Mater. Sci. Mater. Electron. 30, 18391–18404 (2019)
M. Hamdi, S. Karoui, A. Oueslati, S. Kamoun, F. Hlel, J. Mol. Struct. 1154, 516 (2018)
V.A. Sarode, C.A. Kumbharkhane, J. Mol. Liq. 164, 226–232 (2011)
B. Louati, K. Guidara, M. Gargouri, J. Alloy. Compd. 472, 347–351 (2009)
A.B. Rhaiem, S. Chouaib, K. Guidara, Ionic 16, 455–463 (2010)
S. Havriliak, S. Negami, J. Polym. Sci. Part C Polym. Lett. 14, 99–117 (1966)
S. Hajlaoui, I. Chaabane, A. Oueslati, K. Guidara, Solid State Sci. 25, 134 (2013)
Acknowledgements
This work has been supported by the Tunisian Ministry of Higher Education and Scientific Research.
Author information
Authors and Affiliations
Contributions
KK and ABJK: conceived and designed the experiments; analyzed and interpreted the data; wrote the paper. KK: conceived and designed the experiments; wrote the paper. SC: analyzed and interpreted the data; contributed reagents, materials, analysis tools or data; wrote the paper.
Corresponding author
Ethics declarations
Conflict of interest
There is no conflict of interest to declare. The authors declare that they have no known competing financial interests or personal relationships that could have appeared to influence the work reported in this paper.
Additional information
Publisher's Note
Springer Nature remains neutral with regard to jurisdictional claims in published maps and institutional affiliations.
Rights and permissions
Springer Nature or its licensor (e.g. a society or other partner) holds exclusive rights to this article under a publishing agreement with the author(s) or other rightsholder(s); author self-archiving of the accepted manuscript version of this article is solely governed by the terms of such publishing agreement and applicable law.
About this article

Cite this article
Kahouli, K., Kharrat, A.B.J., Khirouni, K. et al. Electrical conduction mechanism and dielectric properties of the [C13H16N2]5(BiCl6)3Cl hybrid compound. Appl. Phys. A 129, 431 (2023). https://doi.org/10.1007/s00339-023-06697-9
Received:
Accepted:
Published:
DOI: https://doi.org/10.1007/s00339-023-06697-9