
Abstract
Water quality data from 56 wells, aquifer characteristics, soil types and land use in the city suburb of Dakar were compared to assess the effects of land use on the Thiaroye groundwater quality. The study area encompassed an unsewered densely populated zone, agricultural land, low density villages, and undeveloped land located in the sand dunes. A method similar to GIS technologies was applied to evaluate the degree of vulnerability of the different parts of the aquifer in relation to urban development, land use and aquifer characteristics. The aquifer parameters (hydraulic conductivity, groundwater level depth, recharge, soil type) were re-evaluated qualitatively into three class rankings (high, moderate and low), depending on the likelihood for contaminants reaching the water table, then combined using the two matrix Boolean logic based approaches to identify the nine classes of vulnerability assessed in the aquifer domain. An attempt was made to explain the distribution of nitrate concentration with the assessed vulnerability. In the area assessed, in the densely populated zone running from Pikine, to Thiaroye and Yeumbeul, very high nitrate concentrations correspond with the highest vulnerability index (H1). Nitrate contamination in this area is a consequence of point-source seepage from individual septic systems improperly built in this area. In the eastern part of the aquifer, high nitrate concentrations at Deni B. Ndao, Mbawane and Golam localities coincide with a moderate vulnerability assessment. The major source of nitrate in these areas is induced by agricultural activities.
Introduction
Groundwater resources in the Dakar (capital city of Senegal) region are very important because of favourable geological, hydrogeological and climatic conditions. The population of the city of nearly 2.5 million people and its expanding suburban zone depend mostly on fresh water from the local aquifers. Development of these groundwater resources has a long history. As long ago as 1925, modern wells replaced traditional dug wells as the effects of the city's growing population began to result in increasing freshwater demand. Therefore, in 1952, a new well field pumping at 15,000 m3/day was put into operation in the suburban zone of Thiaroye to supplement water needs in the capital city. In 1959, the average groundwater withdrawal was reduced to 12,000 m3/day in order to prevent saltwater contamination. Now, six wells with a total yield of about 7,000 m3/day contribute to supply the town with fresh groundwater.
Dakar is still growing and the density of the population in the Thiaroye zone has resulted in serious problems of groundwater quality. This problem has even become acute as wells are located in the vicinity of confirmed anthropogenic sources of pollution induced by poor sewer systems in the Thiaroye zone. This is evidenced by excessive water quality deterioration of the pumping well field (NO3 − up to 540 mg/l), although well-head protection areas have been set around these wells.
Studies of urban impact on the Thiaroye groundwater quality started not so long ago. Collins and Salem (1989) first compiled, in a rudimentary cartographic data base, the population density and sanitation practices in the suburban zone of Thiaroye in order to establish the correlation between urban development and groundwater quality deterioration. Since then, many studies (Gaye and others 1989; SONEES 1989; Fall 1991 and Tandia 1997) have evidenced high nitrate concentrations, indicating anthropogenic pollution in the Thiaroye suburban zone, without, however, investigating its link to human settlement.
This study was based on the premise that land use affects the quality of water in shallow aquifers. The Thiaroye suburban zone was selected because it encompasses a wide variety of land occupation that ranges from an unsewered densely populated zone, to agricultural land, low density villages, and undeveloped land located in the sand dunes. Moreover, the water table is very shallow (3–5 m below the ground surface) in the Thiaroye suburban zone, and the envisaged end of pumping due to the poor water quality in this area, is likely to provoke an inundation in the densely populated area of Thiaroye (Cissé and others 2000; Cissé Faye 2001; Cissé Faye and others 2001).
This paper evaluates the degree of vulnerability of the different parts of the aquifer in relation to urban development, land use and aquifer characteristics. It also summarises the groundwater quality at 56 wells sampled in July and October 1997 and evaluates the statistical correlation between the spatial distribution of contaminants and land use patterns.
Site description
Geomorphology
The Dakar region is located in the mid-western part of Senegal (Fig. 1). It extends as a peninsula 50 km in a W–E direction and 15 km maximum in a N–S direction, which on the Cambérène isthmus decreases to a narrow strip of 4.5 km in width (Hébrard and Elouard 1976).

Location of the study area
The morphology of the region is composed of two units: the extreme westward peninsula characterised by an uplift of the sedimentary deposits in relation to the Dakar quaternary volcanism, and the eastward depression zone centred in the Thiaroye suburban area. In this later zone, the Quaternary sand dunes are oriented SW–NE and the "Niayes" (local term used to designate interdune depressions where agricultural practices are developed) constitute the main surface features along the ocean facade. Some lakes occur beside the dunes deposits; most of them are dry except for the hypersaline Lake Retba. In the south, the marly basement of the sand dunes which outcrops in Rufisque and Bargny appears in a plateau relief 30 m high.
Hydrogeology and groundwater development
The Thiaroye unconfined aquifer is located along the Atlantic Ocean facade and extends about 300 km2 from Dakar to Kayar (Fig. 1). The aquifer reservoir is composed of unconsolidated Quaternary sands. The sediments consist largely of fine and medium grained sands with a porosity value of about 20%. The reservoir overlies a Tertiary marly basement, the elevation of which varies from +10 m in the south-eastern part (where it outcrops) to −95 m northwards at Kayar. The aquifer thickness varies correlatively in the same direction from 5 to 70 m. The ground surface relief varies between 2 and 35 m above mean sea level (Hébrard 1966).
Hydraulic conductivity (K) of the aquifer ranges from 0.5 to 9×10⁻⁴ m/s (OMS 1972; Cissé Faye 2001) and the mean storage coefficient value is 20%. High values of K (5 to 9×10⁻⁴ m/s) are located in the Thiaroye well field and along the coastal zone from Malika to Lake Retba where the sediment is composed largely of grained sands. Areas located from Keur Massar to Diender are characterised by values between 10−4 and 6×10⁻⁴ m/s. The south-eastern part of the aquifer where the tertiary marly basement of the reservoir outcrops, is characterised by clayey sediments and low hydraulic conductivities (less than 1x 10⁻⁴ m/s). Transmissivity values range between 10−3 and 10×10−3 m2/s.
The potentiometric surface map obtained from measured water levels in 59 georeferenced wells during July 1997 (Cissé Faye 2001; Fig. 2) shows heads ranging in altitude from 20 m in the southeast to about 0.5 m in the northeast along the coastal zone. The general groundwater flow is from the south-eastern to the north-eastern part of the system. The well field located in the south-western part of the aquifer is characterised by a pumping depression zone. The groundwater level depths were measured; values range from 2 m to 12 m. In the Thiaroye suburban area, the water table is less than 3 m in depth.

Potentiometric surface map
In the Dakar region, precipitation, which occurs exclusively during the three month rainy season, averages 480 mm/year (mean 1961–1990). About 1/6th of the total precipitation percolates through the sandy soils, the remainder is lost through evaporation and runs off to local depressions. In addition to direct rainfall infiltration, sewer leakage from individual septic tanks is a major contributor to groundwater replenishment.
Methodology and procedures
Vulnerability of shallow groundwater in any given area is essentially dependent on three parameters: the distance from the ground surface to the water table, the properties of the materials which contaminants have to penetrate to reach the aquifer, and the rates at which such contaminants can travel (Eaton and Zaporozec 1997). However, the distribution of groundwater contamination is more a consequence of various land use activities than any geologic and hydrogeologic factors.
Our challenge in assessing the urban impact on the Thiaroye groundwater quality is therefore to analyse and map the major factors which are considered most significant in evaluating groundwater vulnerability. These factors include soil and geological characteristics, specifically the permeability of superficial deposits, hydrogeological characteristics (water table depth, groundwater flow and groundwater recharge), hydrochemistry characteristics of the aquifer and land occupation. These high density data in the Thiaroye aquifer aimed to assess groundwater contamination potential require computerised database management techniques to sort, verify and map the different parameters. A geographical information system (GIS) analysis (PC ARC/INFO version 3.4D; ESRI 1990) was therefore used for this task.
Procedurally, to evaluate the vulnerability of the Thiaroye aquifer, we have combined two methodologies developed respectively by Klima (1996) and Eaton and Zaporozec (1997). The essence of these methodologies is similar to the GIS analysis which consists of compiling basic maps (land use, soil type, nitrate contents, water table depth, water table elevation, groundwater recharge and hydraulic conductivity) into a digital form. In developing the basic maps, we have re-evaluated hydrogeologic features in respect to their likelihood for contaminants to reach the water table, without considering the contaminant loadings nor the properties and characteristics of the contaminant. Three classes ranking high, moderate and low vulnerability were used for soil type, water table depth, hydraulic conductivity and groundwater recharge parameters. Land use features were re-evaluated into high, moderate and low ranking based on potential polluting zones.
Existing methods for assessing groundwater vulnerability, such as the DRASTIC method (Aller and others 1987) are not necessarily digitally based, but often rely on a numerical rating system to integrate the importance of different factors in evaluating sensitivity of groundwater to contamination. Numerical values with different weighting coefficients for different factors are assigned according to local conditions, and the values are summed by area to determine a final numerical index or measure of vulnerability. However, a real limitation of this method is the use of subjectively assigned weighting coefficients.
The methodology outlined in this paper seeks to overcome some of these limitations by using the Boolean logic operations which can be more readily understood as a conceptual two-step procedure using a 3×3 matrix (Eaton and Zaporozec 1997). In developing the matrix, three classes (high, moderate and low) were considered for each factor. The first matrix (Table 1) combines ranges of hydraulic conductivity with the water table depth. A qualitative rating of high (H), moderate (M) or low (L) was symmetrically distributed in the body of the matrix such that cross referencing hydraulic conductivity (left column) and the depth of the water table (top row) gave a high, moderate or low initial vulnerability rating for the aquifer. The second step uses the initial vulnerability ratings of high, moderate or low in the left column (Table 2) combined with a final factor which can be either groundwater recharge or soil typology. The three classes of the final factor constitute the top row of the second matrix. Cross-referencing the columns and rows of this matrix gives the final contamination potential ranking of high (H), moderate (M), or low (L) in the body of the matrix for each area under consideration. The digital intersections of these maps results in a new network of polygons each having four attributes corresponding to the classes of the component maps.
Data collection for each component used for assessing the Thiaroye groundwater vulnerability were obtained as followed:
-
Groundwater quality data, spatial distribution of water table depth and elevation were obtained through field work during July and October 1997. In-situ measurements (pH, electrical conductivity, dissolved oxygen and alkalinity) were made after pumping the monitoring wells. Sample analysis for major ions were performed in the laboratory of the Institute of General and Applied Geology in Munich. Major ions (Cl−, Na+, Ca2+, Mg2+, K+, SO4 2−, NO3 −) were measured using ion chromatography. Nitrite and ammonium were measured using the Hach Spectrophotometer DR/2000.
-
Annual groundwater recharge was estimated based on the precipitation rates recorded in different climatic stations in the Dakar region and the actual evapotranspiration values calculated using the Albrecht (1951) method.
-
Land use in the Thiaroye zone was established using the visual interpretation of a SPOT (XS+P) scene (23 December 1995). Land use categories were identified and digitally incorporated into the GIS.
-
Soil typology results were compiled from the study by USAID/RSI (1986) and digitised in this study for the GIS analysis.
Results
Land use
Land use in the Thiaroye zone has been described using the visual interpretation of a SPOT (XS+P) image. The land use categories (Fig. 3) defined below were digitised for the GIS analysis.

Land use map
-
A suburban area is characterised by a densely populated (4,000 inhabitants/km2) agglomeration. The population today is estimated at more than 1 million inhabitants according to the 1988 population census. This area includes settlements in Thiaroye, Pikine, Malika, Yeumbeul, Keur Massar localities. These localities are known by their non-existent sanitation system network. Most of the houses are built with an improper septic tank which allows seepage from its bottom to the water table. These areas are classified as potentially high polluting zones. The pumping well field (F15, F17, F18, F19, F21 and F22) is located in this area.
-
Rural habitations in villages and small settlements areas from Keur Massar to Diender are also present. These localities are without municipal facilities and a majority of the population in this zone uses water from traditional dug wells. They are characterised by a less important anthropogenic pressure on the water reservoir because of their relatively low population density (600 inhabitants per km2) and therefore are classified as potentially moderate polluting zones.
-
In addition, the land use map individualises uninhabited zones characterised by the sand dunes system in Cambérène, the yellow sand dunes, the coastal white dunes, the Pikine and Keur Massar ergs and the coastal zone. The total surface calculated from the GIS analysis represents 137.5 km2. These areas, where practically no impact is detected, are designated as potentially low polluting zones.
-
The land use categories for the agricultural, reforested and "Niayes" zones, which represent the green area of the region, encompass about 25 km2. These areas are classified as potentially moderate pollution zones.
Soil typology
Soil typology (Fig. 4) was mapped according to an early study (USAID/RSI, 1986). Three types of soil are identified:

Soil type map
-
The tropical ferruginous soils located in the suburban areas and in the north-eastern part of the study area include the Mbayakh, Beer Thialane, Golam and Diender localities. Clay contents in this type of soil are less than 3%. Soils in this area define a highly vulnerable zone.
-
The coastal zone from Yoff to Kayar is characterised by fine-grained sand. The homogeneous soil texture and fine grain size explain the relatively fast infiltration rate in these areas and thus the aquifer in these localities is defined as a highly vulnerable zone.
-
The soils of the Niayes zone are rich in organic matters and the clay content is estimated at 12%. The soil formations in Keur Massar, Sangalkam, Bambilor present more clay contents (20%). Soil characteristics in these areas define a moderately vulnerable zone.
-
The south-eastern part of the aquifer system, where the Tertiary marly basement of the reservoir outcrops, is covered by a clayey sand with clay contents up to 30%. This area is classified as a low vulnerability zone.
Hydraulic characteristics
-
The water table depth (Fig. 5) distribution (Cissé Faye 2001) shows the maximum depth between 12 and 16 m in the Diender zone located east of the system. A shallow depth of less than 2 m is located in the Niayes zones and in the suburban area of Thiaroye, where depths vary between 3 and 6 m. A shallow water table depth defined a highly vulnerable zone, while a depth of 6–10 m characterised a moderately vulnerable zone. Maximum depths (up to 16 m) located in the Beer-Thialane and Diender areas defined a low vulnerability zone.
Fig. 5. 
Water table depth distribution
-
Estimated values of annual groundwater recharge (Fig. 6) represent approximately 10, 11 and 14% of the annual mean precipitation, which is 357 mm/year (mean value 1976–1996). High values of recharge estimated at 50 mm/year occur in the suburban areas of Thiaroye, Pikine, Yeumbeul, Malika and in the north-eastern coastal zone. In addition to rainfall replenishment, seepage from improperly built septic tanks represents a continuous input to the groundwater resource. These areas are qualitatively rated as high (H) vulnerable zones. Recharge values estimated between 30 and 50 mm/year, occur from Mbao to the eastern part to the system. This area is characterised as a moderate (M) vulnerability zone. In the south-eastern (Kounon) and north-eastern (Kayar) part of the aquifer system, the lowest values of recharge (less than 30 mm/year) occur. The vulnerability zones of these localities are defined as low.
Fig. 6. 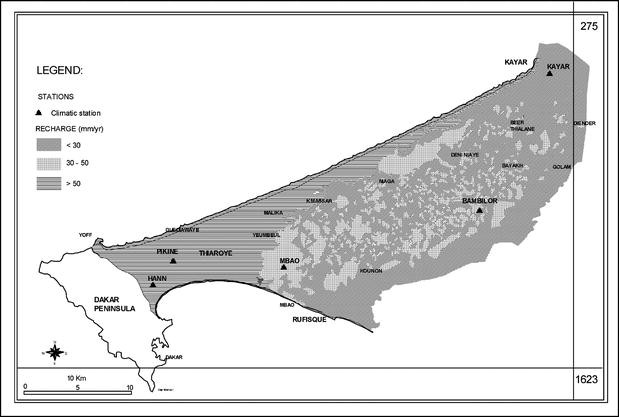
Annual groundwater recharge distribution
-
High values of K ranging between 5 and 10×10−4 m/s located in the Thiaroye pumping area, the coastal zone from Malika to Lake Retba and in the north-eastern part of the study area define highly vulnerable zones (Fig. 7). The area from Keur Massar to Diender, characterised by hydraulic conductivity ranging from 1 to 5×10⁻⁴ m/s, is classified as a moderately vulnerable zone. In the south-eastern part of the system from Kounon to Bambilor, low hydraulic conductivity values ranging from 10−6 to 10−4 m/s define a zone of low vulnerability.
Fig. 7. 
Aquifer hydraulic conductivity distribution


Vulnerability assessment
To assess groundwater vulnerability in the Thiaroye aquifer system, the four maps (water table depth, hydraulic conductivity, groundwater recharge, soil typology) were combined using a GIS analysis to evaluate contamination potential for the different areas. The digital intersections of these maps resulted in a new network of polygons each having four attributes corresponding to the classes of the component maps.
Classes considered in the first matrix (Table 1) concerning the hydraulic conductivity component are: 5–10×10−4 m/s with a high (H) qualitative rating, 1–5×10⁻⁴ m/s with a moderate (M) qualitative rating, and 10−6–10−4 m/s with a low (L) qualitative rating. The classes considered in the first matrix concerning the water table depth parameter are: <6 m in the Niayes and suburb; between 6–10 m in Cambérène in the western part and in the rural habitations; and >10 m in Beer, Thialane, and Diender.
Classes considered in the second matrix (Table 2) are high, moderate and low for the initial vulnerability, and <30, 30–50, and >50 mm/year for the groundwater recharge or <3%, 12–20 and >30% for the percentage of the clay contents.
Since there are three classes for each component map, in total, 27 possible different combinations of these classes have been identified for the final ranking (Table 3). For the Thiaroye area, a simplified contamination potential map is used (Fig. 8) which corresponds to nine classes of vulnerability (Table 3).

Assessed aquifer vulnerability classes
-
High vulnerability zones include the agglomeration areas of Pikine, Thiaroye and specific localities at Yeumbeul, Malika and Keur Massar. Areas mapped with high vulnerability coincide with the shallow water table, high groundwater recharge greater than 50 mm year−1, sandy soil with clay contents less than 3%, and high hydraulic conductivity values.
-
Areas that have a moderate vulnerability coincide with high to low hydraulic conductivity or groundwater recharge depending on the water table depth. Areas mapped with moderate vulnerability are located along the coast and the eastern zone of the Thiaroye system.
-
Low vulnerability areas are located in the south- and north-eastern part of the aquifer. The lower hydraulic conductivity values in connection with low groundwater recharge and the presence of clayey soils offer better protection against potential contaminant.
Vulnerability evaluation
Any method for the assessing and mapping of groundwater contamination potential should be evaluated. Aquifer characteristic vulnerability alone cannot be expected to explain the spatial variation in contaminant concentrations. This is because the observed contaminant levels are also influenced by a range of other factors, including contaminant loading, contaminant characteristics, and the position of the wells used for sampling.
In this study, contaminant spatial variation on a regional scale basis were obtained using 56 wells evenly distributed in the aquifer domain. Therefore, an attempt can be made to explain the distribution of nitrate concentration (Fig. 9), the major contaminant in this area, with the assessed vulnerability levels. High nitrate concentrations (100–550 mg/l) in the western part of the aquifer coincide with high aquifer vulnerability. In the area assessed, in the densely populated zone running from Pikine, to Thiaroye and Yeumbeul, very high nitrate concentrations correspond with the highest vulnerability index (H1). Nitrate contamination in this area is a consequence of point source seepage from individual septic systems improperly built in this area. In the eastern part of the aquifer, high nitrate concentrations at Deni B. Ndao, Mbawane and Golam localities coincide with a moderate vulnerability assessment. The major source of nitrate in these areas is induced by agricultural activities.

Nitrate distribution
Statistical analysis of the hydrochemical data (Table 4) grouped according to land use features, shows high nitrate concentrations (arithmetic mean 310 mg l−1) in the agglomeration zone (A), which decrease by 1/3 in rural areas (C). In uninhabited zones (B), nitrates values are very low (arithmetic mean less than 20 mg l−1) and groundwater quality in these areas meets the drinking water standard (less than the WHO standard of 50 mg l−1). Sulphates and chlorides are not correlated with nitrates, however high values of sulphates are observed in B and C, and high values of chlorides in A, B and C.
Statistical distribution of the nitrate concentrations, the pH values and the dissolved oxygen in relation to land occupation (Fig. 10), give evidence of aerobic conditions in the agglomeration (suburban) zones. In fact, in this area, dissolved oxygen values are high because of the shallow water table depth (less than 6 m). A combination of the low pH values and the open system nature of the groundwater should explain the absence of bacterial reduction process in the area.

Statistical distribution of nitrate, pH and dissolved oxygen in relation to land use
Conclusions
Results from this study provide evidence that the high nitrate concentrations in the Thiaroye aquifer are directly linked to population settlement in the suburban area and agricultural activities in the eastern part of the aquifer. This pollution (up to 540 mg/l NO3 −), maintained by poor wastewater management in these areas, places these resources in danger. In fact, improper urban sanitation, reservoir characteristics and water table depth are the main factors defining the gradual vulnerability with regard to nitrate contamination.
This method can be designed as guidance for land-use planning. It can be used as a tool for preventing shallow groundwater contamination. Groundwater contamination potential maps can be used in conjunction with an inventory of possible contamination sources for successful land-use and water-quality planning in protecting groundwater.
References
Albrecht F (1951) Monatskarte des Niederschlages im Indischen und Stillen Ozean: Monatskarte der Verdunstung und des Wasserhaushaltes des Indischen und Stillen Ozean. [Monthly precipitations, evaporation and humidity in the Indian Ocean]. Ber Dtsch Wetterdienst 4(29)20–39
Aller L, Bennett T, Lehr JH, Petty RJ, Hackett G (1987) DRASTIC: a standardised system for evaluating ground water pollution potential using hydrogeologic settings. Report No 600/2-87-035, US EPA, Ada, Oklahoma
Cissé S, Faye S, Gaye CB, Wohnlich S, Faye A (2000) Effect of a rapidly urbanising environment on unconfined sandy aquifer: Thiaroye, (Dakar, Senegal). In: Proc. 30th IAH Congr, on Groundwater: past achievement and future challenges, Cape Town 2000. Balkema, Rotterdam, pp 719–723
Cissé Faye S (2001) Nappe libre des sables Quaternaires Thiaroye/Beer Thialane (Dakar, Sénégal): Etude de la contamination par les nitrates sur la base d'un Système d'Information Géographique (PC ARC/INFO) [The Quaternary sands unconfined aquifer of Thiaroye/Beer Thialane: study of nitrate contamination using the geographical information system (PC ARC/INFO)]. Reihe B, Heft 12, XXVII, Münchner Geologische Hefte, Munich, 194 pp
Cissé Faye S, Faye S, Gaye CB, Faye A, Wohnlich S (2001) Risk assessment of rising groundwater levels in the Thiaroye suburb zone (Dakar, Senegal) In: Proc. XXXIth IAH congress on New approaches characterizing groundwater flow, Munich, 2001, Swet & Zeitlinger Lisse, pp 1149–1153
Collin JJ, Salem G (1989) Pollution des eaux souterraines par les nitrates dans les banlieues non assainies des pays en développement. Le cas de Pikine (Sénégal). [Groundwater pollution by nitrates in developing countries city suburbs: the Pikinecase (Senegal)]. Tech Doc No 089/27 BRGM SGN/3E, Bureau de Recherche Geologique et Miniere, Orleans, 34 pp
Eaton TT, Zaporozec A (1997) Evaluation of groundwater vulnerability in an urbanizing area. In: Chilton J et al. (eds) Proc. of the XXVIIth IAH Congr. on Groundwater in the urban environment, Nottingham, UK, 1997. Balkema, Rotterdam, pp 577–582
ESRI (1990) Understanding GIS: the ARC/INFO method. Environmental Systems Research Institute Inc, New York, 550 pp
Fall C (1991) Pollution azotée de la nappe phréatique de Thiaroye: causes et propositions de solutions. [Nitrate pollution of the Thiaroye aquifer: causes and remediation proposals]. MSc Thesis, ISE, UCAD, Dakar, 88 pp
Gaye CB, Faye A, Gelinas PJ, Therrien P (1989) Analyse de l'intrusion saline dans les aquifères de la presqu'île du Cap vert. Analyse du processus de minéralisation et de dégradation de la qualité de l'eau dans les nappes infra basaltiques et des sables quaternaires. [Analysis of seawater intrusion in the Cap-Vert peninsula aquifers. Analysis of mineralization processes and water quality degradation in the infrabasaltic and quaternary sands aquifers]. Tech. Doc. GGL-89-CRDI-08 CREGI, Univ. Laval/UCAD, Dakar, 356 pp
Hébrard L (1966) Les formations tertiaires et quaternaires de l'isthme de la presqu'île du Cap-Vert (Feuille Thiaroye, Sénégal) [Tertiary and quaternary formations of the Cap Vert peninsula isthmus (Thiaroye, Senegal)]. Report No 16, Lab Géol, Fac Sci, Univ de Dakar, Dakar, 75 pp
Hébrard L, Elouard P (1976) Note explicative de la carte géologique de la presqu'île du Cap-Vert [Explicative note of the Cap-Vert peninsula geological map]. Lab Géol, Fac Sci, Univ de Dakar, Dakar, 35 pp
Klima AA (1996) Methodology for mapping shallow groundwater quality in urban areas: a case study from Lithuania. Environ Geol 27:320–323
OMS (1972) Etude sur modèle mathématique du système aquifère de la presqu'île du Cap-Vert. [Modelling the aquifer system of the Dakar peninsula] Report No 336/1, 18 pp
SONEES (1989) Note sur la teneur en nitrates de la nappe de Thiaroye et de ses environs [Nitrate contents in the Thiaroye aquifer]. SONES, Dakar, 8 pp
Tandia AA (1997) Origin, process and migration of nitrates compounds in the Dakar region aquifer (Senegal): first results of the contribution of the isotopes techniques. Report No 7279/R1/RB, AIEA, Vienna, 37 pp
USAID/RSI (1986) Cartographie et Télédétection des ressources de la république du Sénégal: etude de la géologie, de l'hydrographie, de la végétation et des potentiels d'utilisation des sols [Mapping of the Senegal resources using remote sensing: study of geology, hydrology, vegetation, potential uses of the soils]. Tech. Doc. SDSURSI-86-01, Environmental Ministry, Dakar, 653 pp
Acknowledgement
This study was financially supported by a grant from the German Academic Exchange Service (DAAD) to the first author.
Author information
Authors and Affiliations
Corresponding author
Rights and permissions
About this article
Cite this article
Cissé Faye, S., Faye, S., Wohnlich, S. et al. An assessment of the risk associated with urban development in the Thiaroye area (Senegal). Env Geol 45, 312–322 (2004). https://doi.org/10.1007/s00254-003-0887-x
Received:
Accepted:
Published:
Issue Date:
DOI: https://doi.org/10.1007/s00254-003-0887-x