
Abstract
Power calculation prior to a genetic experiment can help investigators choose the optimal sample size to detect a quantitative trait locus (QTL). Without the guidance of power analysis, an experiment may be underpowered or overpowered. Either way will result in wasted resource. QTL mapping and genome-wide association studies (GWAS) are often conducted using a linear mixed model (LMM) with controls of population structure and polygenic background using markers of the whole genome. Power analysis for such a mixed model is often conducted via Monte Carlo simulations. In this study, we derived a non-centrality parameter for the Wald test statistic for association, which allows analytical power analysis. We show that large samples are not necessary to detect a biologically meaningful QTL, say explaining 5% of the phenotypic variance. Several R functions are provided so that users can perform power analysis to determine the minimum sample size required to detect a given QTL with a certain statistical power or calculate the statistical power with given sample size and known values of other population parameters.
Introduction
Genome-wide association studies (GWAS) and quantitative trait locus (QTL) mapping are important tools for gene discovery. The most popular method for GWAS is the Q + K mixed linear model (MLM), first proposed by Yu et al. (2006) and then modified by numerous authors to improve the computational efficiency (Kang et al. 2008; Lippert et al. 2011; Listgarten et al. 2012; Zhou et al. 2013). Note that MLM is called linear mixed model (LMM) in statistics literature, not mixed linear model. In terms of QTL mapping, the current method of choice is still the composite interval mapping, first proposed by Zeng (1994) and Jansen (1994) and then modified by Kao et al. (1999). In the mixed model GWAS, the genomic background effect is captured by the polygene modeled via a marker inferred kinship matrix, while in composite interval mapping the genomic background effect is controlled by selected markers (cofactors) across the whole genome. Recently, Xu (2013a) proposed to fit the genomic background effect in QTL mapping via marker inferred kinship matrix. QTL mapping populations (also called linkage populations) are often homogeneous and thus there are no population structures involved. However, QTL mapping experiments are often replicated spatially and temporally. The systematic environmental effects should be included in the mixed models as fixed effects. These fixed effects are analogous to the population structure effects in GWAS. Methodology-wise, GWAS and QTL are unified under the same LMM framework. As a consequence, the power analysis proposed in this study applies to both GWAS and QTL mapping.
Statistical power is defined as the ability to correctly reject the null hypothesis (Castelloe and O’Brien 2001). In GWAS and QTL mapping, the null hypothesis is the absence of an effect for a candidate locus and thus the power is defined as the probability of detecting a true QTL. In interval mapping via the simple regression analysis (Haley and Knott 1992) and single marker GWAS implemented via PLINK (Purcell et al. 2007), power analysis is very straightforward because standard methods of power calculation in linear models apply (Castelloe and O’Brien 2001; Faul et al. 2007). The threshold of the test statistic for significance is drawn from the central Chi-square distribution. The power is calculated from the non-central Chi-square distribution with the non-centrality parameter defined from the true parameter values (Castelloe and O’Brien 2001). For LMMs, especially for the kinship matrix based GWAS, the non-centrality parameter is difficult to define. Therefore, power analysis in mixed models is primarily conducted via Monte Carlo simulations, in which true parameters are used to simulate the data (Green and MacLeod 2016). The SIMR package is available for power analysis via simulation under the generalized LMM (Fulker et al. 1999; Spencer et al. 2009; Johnson et al. 2015; Green and MacLeod 2016). The PAMM program (an R package) is a power analysis for random effects in mixed models under the likelihood ratio tests (Martin et al. 2011). Power evaluation in classical mixed model association study via simulation can also be found in Shin and Lee (2015).
In a simulation-based power analysis, the simulation is replicated multiple times. For each replicate, the simulated QTL is either detected or not by a method of interest under a pre-specified genome-wide Type 1 error, say 0.05. The number of replicates that show positive detection against the total number of replicates is declared as the empirical power. For large GWAS data, such a simulation approach is time-consuming. People often use the genotypic data of an existing population to simulate the response variable given a set of true parameters. This approach can save some computational time for not generating the genotypic data, but performing GWAS for the simulated data is still very costly. An explicit method for power calculation in mixed models can save tremendous amount of time, but such a method has not been available yet. Kononoff and Hanford (2006) proposed to use PROC MIXED in SAS to calculate the non-centrality parameter for an F test in dairy nutritional studies. They provided the true parameters in PROC MIXED and held the initial parameter values. They then extracted the non-centrality parameter from the output. This approach is a short cut method avoiding massive simulations and may be adopted to the mixed model GWAS, assuming users are skilled SAS programmers.
In human linkage and association studies, power calculation often deals with case-control data (Gordon et al. 2002; Edwards et al. 2005; Skol et al. 2006; Klein 2007; Kim et al. 2008; Spencer et al. 2009; Hong and Park 2012; Jiang and Yu 2016). Software packages are available for case-control power calculation, e.g., the PGA (Power for Genetic Association analyses) program in MatLab with graphic interface (Menashe et al. 2008). Genetic power calculator (GPC) (Sham et al. 2000; Purcell et al. 2003) is an online program for power calculation in linkage and association mapping. The method simultaneously tests between family variance (variance across family means) for association and within family variance for linkage. The package uses likelihood ratio tests. However, this program only deals with full-sib families, case-control study and transmission disequilibrium test (TDT). The combined linkage and association mapping part implemented in GPC was initially proposed by Fulker et al. (1999) who evaluated the statistical power via simulations. In case-control studies, the test statistic is the typical Chi-square test by comparing the allele frequencies of the case to the control. The non-centrality parameter depends on the sample sizes, genotype frequencies, disease prevalence, and phenotype misclassification probabilities (Edwards et al. 2005). In addition to case-control studies, there are identity-by-descent (IBD)-based methods for QTL mapping and GWAS (Amos 1994; Xu and Atchley 1995; Almasy and Blangero 1998), all of which estimate and test variance components. Power calculation can be conducted theoretically using the expected likelihood ratio test as the non-centrality parameter.
Yang et al. (2011, 2014) were the first group of people explicitly addressing statistical power for the Q + K mixed model. They used the expectation (average) of the Chi-square test statistics of QTL to indicate the power. Their purpose was to compare the powers of different models, e.g., comparison of powers for LMMs with proximal contamination and without proximal contamination. The authors did not provide the exact power to detect a particular QTL; rather, used the expected Chi-square test to draw a qualitative conclusion about the comparison. In addition, Yang et al. method is a simulation-based method.
The only explicit method of power calculation for GWAS without simulation was developed by Feng et al. (2011) and Visscher et al. (2017), where the non-centrality parameter is expressed as a function of QTL size (expressed as QTL heritability). The software package GWAPower is particularly designed for power calculation in GWAS (Feng et al. 2011). Unfortunately, the non-centrality parameter proposed there ignores the polygene captured by the kinship matrix. The polygenic control is a fundamental part of the LMM GWAS (Yu et al. 2006). It is unclear how the polygene included in the model affect the power. Does the polygene increase the power or decrease the power? How does the overall relatedness of individuals affect the power? Power calculation is an important first step to design QTL mapping and GWAS experiments. In addition to many other factors, sample size and QTL size are the key factors determining the statistical power. Power calculation prior to the experiments can help investigators choose the optimal sample size to detect a biologically meaningful QTL. Without the guidance of power analysis, an experiment may be underpowered or overpowered. Either way will lead to wasted resource in terms of labor, fund, and time. An underpowered experiment will not be able to detect useful QTL and the entire experiment will be wasted. On the other hand, an overpowered experiment will take more resources than necessary to accomplish what is expected to accomplish. This study will derive the non-centrality parameter (thus the statistical power) for the typical Q + K LMM GWAS and QTL mapping. Readers can write their own codes to calculate the power or sample size using the simple formulas developed in the study. They can also use the R functions provided in Supplementary Information of this paper.
Method
Background of statistical power
In hypothesis testing, we typically express the belief that some effect exists in a population by specifying an alternative hypothesis H1. We state a null hypothesis H0 as the assertion that the effect does not exist and we attempt to gather evidence to reject H0 in favor of H1. Evidence is gathered in the form of sampled data, and a statistical test is used to assess H0. If H0 is rejected but there really is no effect, this is called a Type 1 error, which is usually designated “alpha” (α), and statistical tests are designed to ensure that α is suitably small (for example, less than 0.05). If there really is an effect in the population but H0 is not rejected in the statistical test, then a Type 2 error has been made. The Type 2 error is usually designated “beta” (β). The probability 1 − β of avoiding a Type 2 error, that is correctly rejecting H0 and achieving statistical significance, is called the statistical power. An important goal in study planning is to ensure an acceptably high level of power. Sample size plays a prominent role in power computations because the focus is often on determining a sufficient sample size to achieve a certain power, or assessing the power for a range of different sample sizes.
The relationship between Type 1 error and statistical power is shown in Table 1. The off-diagonals of the 2 × 2 table (Table 1) are the Type 1 and Type 2 errors. The two diagonal elements represent the probabilities of making correct decisions. The second diagonal element is the statistical power (also called sensitivity), as usually defined in statistics. The first diagonal element 1 − α is called the specificity.
The relationship between the Type 1 and Type 2 errors is more intuitively illustrated in Fig. 1. The upper panel of Fig. 1 shows the null distribution (left) and the alternative distribution (right), where the upper tail of the null distribution highlighted in light gray represents the Type 1 error and the lower tail of the alternative distribution highlighted in dark gray represents the Type 2 error. The line dividing the Type 1 and Type 2 errors is the critical value of the test statistic. Sliding the critical value towards the left will increase the Type 1 error but decrease the Type 2 error. However, sliding the critical value towards the right will decrease the Type 1 error but increase the Type 2 error. The lower panel of Fig. 1 shows the changes of the Type 1 error, the Type 2 error, and the statistical power. A test statistic that maximizes the distance between the two distributions is the best test. The critical value should be selected as to minimizing both the Type 1 and Type 2 errors.
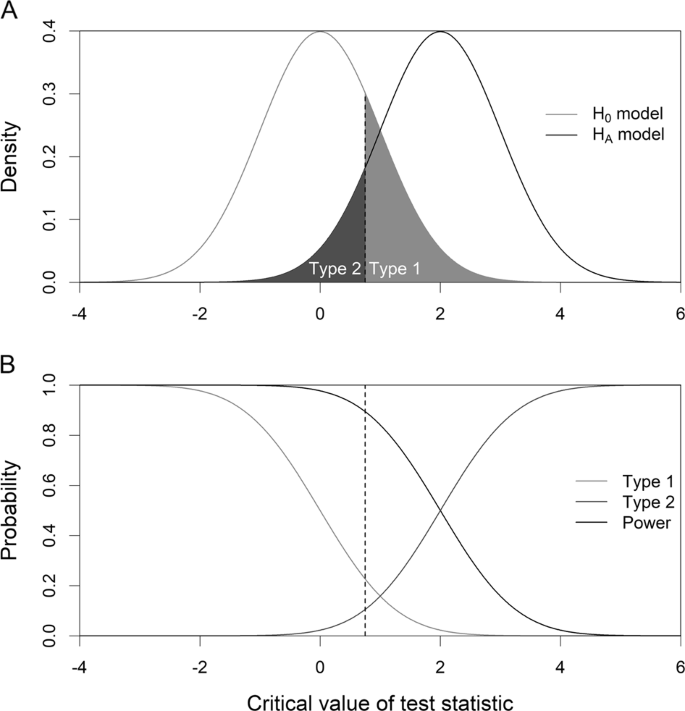
Relationship among the Type 1 and Type 2 errors, and the statistical power. a The null distribution (left) and the alternative distribution (right), where the upper tail of the null distribution highlighted in light gray represents the Type 1 error and the lower tail of the alternative distribution highlighted in dark gray represents the Type 2 error. b Changes of the Type 1 and Type 2 errors, and the statistical power as the critical value (the vertical line) changes
We now use a simple linear regression model to demonstrate the statistical power. Let y be a response variable and Z be an independent variable. The linear model is
where μ is the intercept, γ is the regression coefficient, and e is the residual error vector with an assumed N(0, σ2) distribution for each individual error. The null hypothesis is H0:γ = 0 and the alternative hypothesis is H1:γ ≠ 0. Let \(\hat \gamma\) be the estimated regression coefficient with an estimated variance of
where \(\sigma _Z^2\) is the variance of Z. The Wald test is defined as
When n is sufficiently large, under the null model, the Wald test statistic follows a central Chi-square distribution with 1 degree of freedom (for small n, this test statistic actually follows an F distribution with 1 and n − 2 degrees of freedom). The assumed Chi-square distribution for the Wald test holds in the ideal situation where the residual error follows a normal distribution. If the normal assumption of the error is violated, power calculation based on the assumed Chi-square distribution will be approximate. However, the approximation will be sufficiently accurate if the sample size is large (Andersen 1970). For simplicity, let us use the central χ2 distribution with 1 degree of freedom as the null distribution. The critical value used to declare significance for the test is \(\chi _{1 - \alpha }^2\), which is the (1 − α) × 100 percentile of the χ2 distribution. If the alternative hypothesis, H1:γ ≠ 0, is true, the Wald-test will follow a non-central Chi-square distribution with a non-centrality parameter
If the independent variable is standardized prior to the analysis, \(\sigma _Z^2 = 1\) and the non-centrality parameter is simply
It is proportional to the product of sample size and the size of the effect (squared regression coefficient relative to the residual error variance).
In terms of QTL mapping with the simple regression model, a more informative way to represent the size of the QTL is
Therefore,
The non-centrality parameter can be rewritten as
The non-centrality parameter will be extended to LMM in the following section. The power and Type 1 error relationship may be different for different test procedures. If the power responds to the change of Type 1 error strongly, the method is considered as a good method. We often use the receiver operating characteristic (ROC) curve to describe the effectiveness of a test procedure. Figure 2 shows three methods (or three sample sizes) having three different patterns of the ROC curves. The curve in red deviates away the most from the diagonal line and thus is the best method. The curve in blue is not as good as the red curve. The curve in purple is closer to the diagonal line and thus is the worst method among the three. If the ROC curve of a method overlaps with the diagonal line, the method is useless.

The receiver operating characteristic (ROC) curves of three methods (or different sample sizes). The curve in red deviating away the most from the diagonal line is the best method. The curve in blue is not as good as the red curve. The curve in purple closer to the diagonal line is the worst method among the three
Linear mixed model and Wald test
We first consider the polygenic model ignoring any population structure effects, which will be dealt with in a latter section. Let y be the phenotypic value of a target quantitative trait for QTL mapping or GWAS. The LMM can be written as
where y (an n × 1 vector) is assumed to be adjusted by any fixed effects, e.g., population structure, year, location, age, and so on, prior to the mixed model analysis, Zk (an n × 1 vector) is a genotype indicator variable for the locus (candidate gene) under investigation and assumed to be standardized (subtracted by the mean and divided by the standard deviation so that \(\sigma _Z^2 = 1\)), γk is the effect of the locus and treated as a fixed effect, ξ is an n × 1 vector of polygenic effects captured by a marker inferred kinship matrix and is assumed to be \(N(0,K\sigma _\xi ^2)\) distributed where \(\sigma _\xi ^2\) is the polygenic variance, and e ~ N(0, Iσ2) is a vector of residual errors with a common variance σ2.
The marker inferred kinship matrix is calculated based on (VanRaden 2008)
where Zk′ is a vector of standardized genotype indicators for marker k′ and m is the total number of markers used to calculate the kinship matrix. The denominator d is a normalization factor that makes the diagonal elements as close to unity as possible. Typical value of d can take the mean of the diagonal elements of the original un-normalized kinship matrix. Note that normalization of the kinship matrix is recommended in the power study. The number of markers used to calculate K is not necessarily the same as the total number of markers scanned in the study. Essentially, one of the Zk′’s is Zk, so a potential proximal contamination (Listgarten et al. 2012) occurs here, but if m is sufficiently large, say m > 1000, effect of the proximal contamination on the result is negligible (Wang et al. 2016; Wei and Xu 2016).
The expectation of y is E(y) = μ + Zkγk and the variance–covariance matrix of y is
where \(\lambda = \sigma _\xi ^2{\mathrm{/}}\sigma ^2\) is the variance ratio (representing the size of the polygene) and H = Kλ + I is the covariance structure. The test statistic is the usual Wald test
where
and
Under the null hypothesis H0: γk = 0, the Wald statistic follows approximately the \(\chi _1^2\) distribution. In GWAS, the sample size is often sufficiently large so that the Chi-square distribution is a very safe assumption.
Non-centrality parameter
To evaluate the power of the Wald test, we must assume that all parameters are known so that we can find the distribution of the test statistic under the alternative hypothesis. The parameters include γk, λ, and σ2. The variance of the estimated QTL effects given in Eq. (14) involves a quadratic form of Zk. If we replace the quadratic form by its expectation, the variance becomes
Note the difference between (15) and (14), where one is \(\hat \gamma _k\) and the other is γk. The non-centrality parameter is obtained by replacing all estimated parameters in the Wald test statistic by the true values and thus
A non-centrality parameter is not supposed to contain the actual data but here we have a kinship matrix (K) embedded in matrix H. Let us consider K as a constant when we take the expectation of the quadratic form of Zk. Since Zk is a standardized variable, E(Zk) = 0 and \({\mathop{\rm{var}}} (Z_k) = I\), where we assume that the n individuals are not genetically related, i.e., they are independent. Note that being genetically independent does not mean K = I because K is not the coancestry matrix but a matrix calculated from markers. The expectation of the quadratic form for Zk can be written in the following form:
because E(Zk) = 0 and \({\mathop{\rm{var}}} (Z_k) = I\). Recall that H−1 = U(Dλ + I)−1UT and thus
Therefore, the non-centrality parameter is
If Zk is centered but not scaled and the variance is \(\sigma _Z^2\), we would have
Therefore, the non-centrality parameter would be
We now define the proportion of phenotypic variance explained by the QTL by
This way of expressing the size of the QTL is more intuitive. The ratio (γk/σ)2 can be expressed as a function of \(h_{QTL}^2\), as shown below:
Therefore, the non-centrality parameter can be written as a function of the QTL heritability,
Let us call
the effective sample size, which would be the actual sample size if the polygenic variance were nil (λ = 0), as demonstrated below:
The non-centrality parameter of the mixed model would then be identical to the simple regression model, as shown in Eq. (8). Finally, the non-centrality parameter is simplified into
Type 1 error, Type 2 error, and statistical power
Let α be the Type 1 error chosen by the investigator, let β be the Type 2 error when the Type 1 error is set at α and let ω = 1 − β be the statistical power. We define χ2(τ, δ) as a non-central Chi-square variable with τ degrees of freedom and a non-centrality parameter δ. Therefore, χ2(1, 0) is just a central Chi-square variable with 1 degree of freedom. The cumulative distribution function for a non-central Chi-square variable is described by
Given this notation, we define the Type 1 error by
where F(x|1, 0) is the cumulative distribution function for a central Chi-square variable with 1 degree of freedom. The threshold of the test statistic is obtained via the inverse of the central Chi-square distribution,
The Type 2 error using this threshold is
and thus the power is
The above three equations allow us to calculate the statistical power given the genetic parameters of the population under study.
We now demonstrate that if the Type 1 and Type 2 errors are fixed and the sample size along with the population parameters are known, we can find the minimum detectable QTL. There is another inverse function for the non-central Chi-square distribution, which is called the second non-centrality parameter,
This non-centrality parameter can also be calculated from quantiles of the standardized normal distribution. Let z1−α/2 = Φ−1(1 − α/2) and z1−β = Φ−1(1 − β) be the quantiles of the standardized normal distribution. They are the inverses of the normal distribution, also called probit functions. The non-centrality parameter can be expressed as (Xu 2013b)
Replacing δ in Eq. (24) by δβ in Eq. (34) leads to
This equation is all what we need to calculate \(h_{QTL}^2\) given all other parameters, including the Type 1 and Type 2 errors. For example, if α = 5 × 10⁻⁷ and β = 0.15 (equivalent to a power of ω = 0.85), the non-centrality parameter should be
Given λ, n, and dj, we should be able to find \(h_{QTL}^2\).
A special kinship matrix with the compound symmetry structure
The eigenvalues of a marker inferred kinship matrix depend on the sample size and the LD structure of all markers used to infer the kinship matrix. Evaluation of power must be conducted numerically after we have the kinship matrix (this will be done later in the simulation study). We now simplify the kinship matrix so that a general trend can be found regarding the change of power. We assume that the kinship matrix has the following special structure:
where ρ represents the correlation between any pair of individuals. This structure is close to the compound symmetry (CS) structure (differing by a common factor). Under this assumption, the eigenvalues are d2 = d3 = ⋯ = dn = 1 − ρ and d1 = n − (n − 1)(1 − ρ) because \({\sum} {d_j = n}\) (the sum of all eigenvalues of a correlation matrix equals the sample size). These eigenvalues yield
which is the effective sample size. Substituting it into Eq. (24), we have
Remember that the non-centrality parameter directly relates to the statistical power. We now examine the non-centrality parameter under some special cases. If λ → 0, the non-centrality parameter becomes
So, the power increases as \(h_{QTL}^2\) and n increase. This is consistent with the simple regression analysis, i.e., interval mapping (Lander and Botstein 1989; Haley and Knott 1992). If ρ → 0, the same conclusion is obtained as the situation where λ → 0, that is
Note that the situation of ρ = 0 is equivalent to λ not being estimable because the kinship matrix is an identity matrix, explaining why λ = 0 is the same as ρ = 0. We now examine the situation when ρ → 1,
If n is relatively large,
which implies that adding the kinship matrix in GWAS actually helps boost the power by a factor (λ + 1).
In reality, the CS assumption of the kinship matrix is not required in power analysis. Given λ, one can directly calculate n0 using Eq. (24). The reason to introduce ρ is to identify a general trend of the relationship between the power and the overall relatedness of individuals in the association population.
Power calculation for models including dominance
The power calculation described so far applies to populations with only two possible genotypes per locus or more than two genotypes per locus but only for the additive genetic effect. We will extend the method to populations with arbitrary number of genotypes per locus. For example, an F2 population derived from the cross of two inbred lines has three possible genotypes per locus. There are two alternative ways to formulate the genotypic model. One is to define an additive indicator (a) and a dominance indicator (d) for individual j at locus k, such as
Define Zk = [Zk(a)||Zk(d)] as an n × 2 matrix for the genetic effect indicators and \(\gamma _k = \left[ {\begin{array}{*{20}{c}} {\gamma _{1k}} & {\gamma _{2k}} \end{array}} \right]^T\) as the additive (γ1k) and dominance (γ2k) effects of marker k. The LMM is
which is exactly the same as Eq. (9) but here the dimensionalities of Zk and γk are different from those of the additive model. Let \({\mathop{\rm{var}}} (Z_k) = {\mathrm{\Sigma }}_{ZZ}\) be a 2 × 2 variance matrix for the genotype indicator variables. The non-centrality parameter is defined as
If the genetic effect indicator variables are standardized, ΣZZ = I, so that the non-centrality parameter becomes
where \(\sigma _G^2 = \gamma _{1k}^2 + \gamma _{2k}^2\) is the total genetic variance for the locus of interest. Let us define \(\lambda = \sigma _\xi ^2{\mathrm{/}}\sigma ^2\) and
so that
We now have a non-centrality parameter expressed as a function of QTL size,
Under the null model, \(H_0:\sigma _G^2 = 0\), the Wald test statistic (obtained by replacing the true values of parameters in δ by the estimated parameters) will follow a Chi-square distribution with 2 degrees of freedom.
To extend the additive plus dominance model to a more generalized genotypic model for arbitrary number of genotypes per locus, e.g., four-way crosses, we code the genotypes as dummy variables like what is done in the general linear model for the analysis of variance (ANOVA). For example, in a four-way cross population, there are four possible genotypes per locus. The dummy variables are represented by an n × 4 Zk matrix. Each row of Zk has exactly one element being 1 and the remaining three elements being 0. The position where value 1 takes place is the ordered genotype that this individual holds. Let us denote the marker effects for locus k by \(\gamma _k = \left[ {\begin{array}{*{20}{c}} {\gamma _{1k}} & {\gamma _{2k}} & {\gamma _{3k}} & {\gamma _{4k}} \end{array}} \right]^T\). The variance matrix for Zk is a 4 × 4 matrix ΣZZ. Supplementary Note S1 shows how to standardize Zk using matrix ΣZZ. Under the null hypothesis, \(H_0:\sigma _G^2 = 0\), the Wald test follows a Chi-square distribution with 4 − 1 = 3 degrees of freedom. In general, the degree of freedom is the number of genotypes minus 1.
Population structure
Population structure is often caused by population heterogeneity (or admixture) represented by multiple ethnic groups or subpopulations within the association population (Pritchard et al. 2000a, 2000b). The purpose of fitting population structure effects into the LMM is to reduce false positives for loci that are confounded with population structure (Toosi et al. 2018). For example, if a locus is fixed to alleles unique to subpopulations and the subpopulations are strongly associated with the trait under study, we do not want to claim the locus as associated with the trait because the association may be caused by subpopulations. Fitting the population structure will prevent such a false positive. Let us review the Q + K mixed model for GWAS (Yu et al. 2006),
where Q is the design matrix for population structure (obtained either from principal component analysis or cluster analysis using genome-wide markers), η is a q × 1 vector of structural effects on the phenotype. If the model is true, the estimated effects of η and γk are unbiased (best linear unbiased estimates). However, the variance of \(\hat \gamma _k\) with population structure will be increased compared with the variance of estimated γk when the population structure is absent. The increased variance is formulated as
where \(r_{ZQ_i}^2\) is the squared correlation between the ith column of matrix Q and Zk (under the additive model, Zk is a single column vector). The non-centrality parameter for the Wald test is
If there is a single column of matrix Q, the extra term is simply \(1 - r_{ZQ}^2\), which is a fraction between 0 and 1. As a result, population structure effects actually reduce the non-centrality parameter and thus lower the power. If the population structure effects are present but ignored in the model, the consequence is a decreased power (if the structure effects are independent of the marker under study) because the structure effects will go to the residual error. An inflated residual error variance will decrease the power. If the structure effects are correlated with the marker under study, failure to incorporate them into the model will violate the model assumption that residual error is not supposed to correlate with the model effects and thus there is no correct way to evaluate the theoretical power. Derivation of the power in the presence of population structure is given in Supplementary Note S2.
Simulation study to validate the power calculation
Populations
The purpose of the simulation study is to validate the theoretical powers under several different scenarios. To simplify the simulation, we used marker inferred kinship matrices from three different rice populations as known quantities to generate phenotypic values. The first population consists of 210 recombinant inbred lines (RIL) derived from the hybrid (Shanyou 63) of two elite indica rice varieties (Zhenshan 97 and Minghui 63). The original RIL population was developed by Xing et al. (2002) and Hua et al. (2002). The genotypic data were represented by 1619 bins extracted from ~270,000 SNPs and each bin consists of many cosegregating SNPs (Yu et al. 2011). We used the 1619 bins to construct a 210 × 210 kinship matrix. Simulation result from this kinship matrix was used to validate power calculation for the simple additive model.
The second rice population consists of 278 hybrids from random pairings of the 210 RILs of the first population with the same number of bins (Hua et al. 2002). The bin genotypes of the hybrids were inferred from the genotypes of the 210 parents. Each locus of the hybrid population has three possible genotypes (A1A1, A1A2, and A2A2) with expected frequencies of 0.25, 0.5, and 0.25, which mimic the genotypic frequencies of an F2 population. Since the parents of the hybrids are inbred, the genotypes of a hybrid can be regenerated if needed. Such an F2 is called an immortalized F2 (IMF2) (Hua et al. 2002). The purpose of this population is to validate power calculation for detection of both additive and dominance effects.
The third rice population consists of a diverse collection of 524 accessions of rice, including both landraces and elite varieties (Chen et al. 2014). Genotypes of 180,000 SNPs were selected from a total of more than 6.4 million high-quality SNPs. The selected subset of SNPs were used to build the 524 × 524 kinship matrix. The population contains 293 indica and 231 japonica subspecies. This data set was used to validate power calculation in the presence of population structure. Here, the population structure is represented by two subspecies with indica coded as 1 and japonica coded as 0, i.e., the design matrix Q for population structure contains only one column of a binary variable.
Simulations
Given a kinship matrix (sample size is already known) and a polygenic parameter (\(\lambda = \sigma _\xi ^2{\mathrm{/}}\sigma ^2\)), we calculated the effective sample size n0, which allows us to calculate the theoretical power under each \(h_{QTL}^2\). The empirical power from simulation was then compared to the theoretical power. We first simulated data in the absence of population structure under the additive model with n = 210 recombinant lines (the first population). The kinship matrix for the 210 RILs is provided in Supplementary Data S1. Recall that the LMM is
where the parameter values were set at μ = 10, σ2 = 5, and \(\sigma _\xi ^2 = \left\{ {0,5,10} \right\}\), so that λ = {0, 1, 2}. Under the three polygenic levels, the effective sample sizes are n0 = {210, 303.74, 396.07}. For example, when λ = 1, the effective sample size is n0 ≈ 304, much higher than the actual sample size n = 210. Verbally, we say that we need a sample of 304 for λ = 0 to reach the same power as a sample of 210 for λ = 1. We varied \(h_{QTL}^2\) from 0 to 0.06 incremented by 0.001 and generated one sample under each level of \(h_{QTL}^2\). For each sample, we first generated a Zk vector from a Bernoulli distribution with probability 0.5. The values of Zk mimic the numerical codes of the two possible genotypes for an RIL population. We then standardized Zk so that μZ = 0 and \(\sigma _Z^2 = 1\). Next, given \(h_{QTL}^2\), we calculated the true value of the QTL effect using
The standardized Zk multiplied by γk gives the genetic value of the QTL for all individuals. The polygenic effects ξ were generated from a multivariate normal distribution with zero expectation and variance \(K\sigma _\xi ^2\). We first generated n independent standardized normal variables un×1. We then generated polygenic effects using
where U (an n × n matrix) are the eigenvectors of K and D1/2 (a diagonal matrix) are the square roots of eigenvalues of K. One can verify that ξ ~ N(0, K), as shown below:
Finally, e was simulated from N(0, Iσ2). Once the response variable y was simulated, we called the “mixed” function in R written by our own laboratory (Xu et al. 2014) to perform the mixed model analysis and statistical test. The locus was declared as significant if its p-value is smaller than the nominal criterion of 0.05. The experiment was replicated 1000 times and the proportion of samples with significant detection was the empirical statistical power. Alternatively, we could repeat the simulation 1619 times (the number of markers) and compare the p-value of each marker with 0.05/1619 = 0.000030883 (after Bonferroni correction) to calculate the proportion of significant markers. Each experiment consists of 1619 simulations because of 1619 markers. We could then replicate the experiment 1000 times to calculate the average power over 1000 experiments. The alternative approach would take substantially longer time to complete the simulation because it involves 1619 times more work. The empirical power from the alternative approach would be much closer to the true value because it would be equivalent to a simulation experiment replicated 1619 × 1000 times.
For the second population, the kinship matrix was drawn from the genotypes of 1619 bins of n = 278 hybrids. The parameter values were set at μ = 10, σ2 = 5, and \(\sigma _\xi ^2 = \left\{ {0,5,10} \right\}\), so that λ = {0, 1, 2}. Under the three levels of polygenic variance, the effective sample sizes are n0 = 278, n0 = 402.50, and n0 = 516.14, respectively. We assumed that the additive and dominance effects contribute equally to the hypothetical trait so that \(\gamma _{1k} = \gamma _{2k} = \sqrt {\sigma _G^2{\mathrm{/}}2}\), where
Genotypes of the 278 hybrids for the locus of interest were generated from a multinomial distribution with size 1 and probabilities 0.25, 0.5, and 0.25, respectively, for A1A1, A1A2, and A2A2. We then coded the additive indicator Zk(a) = Z1k and dominance indicator Zk(d) = Z2k from the simulated genotypes. After standardization, the two genetic effect indicators were horizontally concatenated into an n × 2 matrix Zk. The genetic value of individuals due to the QTL were generated by
The kinship matrix of the 278 hybrids were calculated from the 1619 markers and used to simulate the polygenic effects from \(N(0,K\sigma _\xi ^2)\) distribution. The kinship matrix is given in Supplementary Data S2. Adding simulated residual errors to the mean value μ = 10, the simulated QTL effect and the polygenic effects, we generated the simulated phenotypic values for all hybrids. Parameter estimation and statistical tests were conducted using our own mixed function in R. The p-value was calculated from the central Chi-square distribution with 2 degrees of freedom. Nominal 0.05 criterion for the p-value was chosen as the threshold to declare statistical significance. The simulation experiment was replicated 1000 times. The proportion of samples in which significance was claimed was the empirical power.
The third population was used to validate the power calculation in the presence of population structure. The kinship matrix of 524 rice varieties was calculated from 180,000 selected SNPs. This kinship matrix is given in Supplementary Data S3. The population structure was represented by a single column Q coded by 1 for indica and 0 for japonica (Supplementary Data S4). The population parameters were set at μ = 0, σ2 = 5, \(\sigma _\xi ^2 = 5\) and λ = 1. The model with population structure is
where both Q and Zk are standardized and the population structure effect was set at η = 1. Ignoring the contribution from the QTL, the phenotypic variance contributed by the population structure is \(\eta ^2{\mathrm{/}}(\eta ^2 + \sigma _\xi ^2 + \sigma ^2) = 1{\mathrm{/}}(1 + 5 + 5) = 0.0909\). Three levels of the correlation between Q and Zk (a single column) was chosen: \(r_{QZ}^{} = \left\{ {0.0,0.5,0.9} \right\}\). The effect of QTL and the polygenic effect were simulated in the same way as the first population. The genotype indicator Zk was simulated conditional on the population structure. Since both Q and Zk are binary variables, we used a special algorithm to generate Zk. We simulated another vector of binary bits (denoted by ζ) to indicate whether Zk should be different from Q or not. Given Q and the simulated ζ, we generated
If all values of ζ are 1’s, Zk = 1 − Q and the correlation should be −1. However, if all values of ζ are 0’s, Zk = Q and the correlation should be 1. The vector of bits (ζ) was simulated from a Bernoulli distribution with probability r = 0.5(1 − rQZ) using the following R code
Supplementary Note S3 shows that \({\mathop{\rm{var}}} (Z_k) = {\mathop{\rm{var}}} (Q)\) and
Therefore,
Both Q and simulated Zk were standardized before use to generate the response variable.
Supplementary Note S4 provides several R functions and the scripts to run the R functions. User instruction is also included in this note.
Results
Numerical evaluation of power for some special cases
Let us examine the power under a special case when the sample size is n = 500, the target QTL contributes \(h_{QTL}^2 = 0.05\) of the phenotypic variance, the genome-wide Type 1 error is α = 5 × 10⁻⁷, the polygenic variance to the residual variance ratio is λ = 1 and the effective correlation between individuals in the kinship matrix is ρ = 0.5. We assume that the total number of markers scanned is m = 100k so that the genome-wide Type 1 error is α = 0.05/100000 = 5 × 10⁻⁷ after Bonferroni correction for multiple tests. Note that λ = 1 means that the polygene contributes \(h_{\mathrm{POLY}}^2 \approx \lambda {\mathrm{/}}(\lambda + 1) = 0.5\) of the phenotypic variance. Under this special case, the non-centrality parameter is
Substituting δ = 35.02 into Eq. (32) yields a statistical power of ω = 0.8136, which is reasonably high. The parameter values in this special case are treated as default values when we evaluate the change of power against the change of one of the other factors (see next paragraph).
We now evaluate the change of power against the change of one factor with other factors being fixed at the values described above. For example, we can examine the change of power against the change of sample size (n) when \(h_{QTL}^2 = 0.05\), α = 5 × 10⁻⁷, λ = 1, and ρ = 0.5. Figure 3 shows the changes of power against each of the factors. The polygenic effect can increase the power (Fig. 3a), starting from ω = 0.55 when λ = 0 to ω = 0.9 when λ = 2. The curve progressively approaches 1, but very slowly. Sham et al. (2000) also found the variance of common family effect increases statistical powers in sibship analysis, where the common effect shared by siblings is the polygenic effect plus maternal effect. The effective correlation ρ also increases the statistical power (Fig. 3b), but the relationship is quite linear until ρ is close to 1. Figure 3c, d shows the changes of power against the sample size and the QTL size, respectively. These changes are consistent with the usual expectation, both the sample size and the QTL size increase the power monotonically.
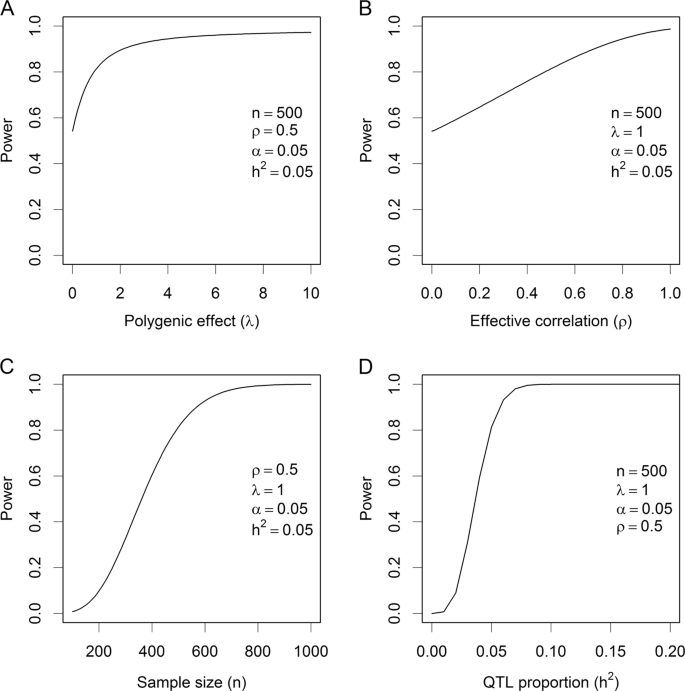
Change of statistical power. a Power changes as the polygenic effect increases in the situation where the sample size is 500, the QTL size is 0.05, the linkage disequilibrium parameter is 0.5 and the nominal Type 1 error is 0.05 (corresponding to 0.05/100,000 after Bonferroni correction for 10k scanned markers). b Power changes as the effective correlation changes in the situation where the polygenic effect size is 1, the sample size is 500, the QTL size is 0.05, and the nominal Type 1 error is 0.05. c Power changes as the sample size increases in the situation where the polygenic effect is 1, the QTL size is 0.05, the linkage disequilibrium parameter is 0.5 and the nominal Type 1 error is 0.05. d Power changes as the QTL size increases in the situation where the polygenic effect is 1, the sample size is 500, the linkage disequilibrium parameter is 0.5 and the nominal Type 1 error is 0.05
Effective correlation coefficient of individuals
The numerical evaluation of statistical power described above was conducted under a special structure of the kinship matrix: the diagonal elements are all unity and off-diagonal element are all the same (ρ). We have demonstrated that the power increases as ρ increases. So, a GWAS population with a high ρ tends to be more powerful than a population with a low ρ, assuming that all other factors are fixed. In reality, the diagonal element of the kinship matrix will vary across individuals (not unity), the correlation coefficient will vary across different individual pairs. Equation (36) shows the link between the effective sample size and ρ. For a given value of λ, we can calculate the effective sample size
If this kinship matrix had a structure of identical off-diagonal element, we should expect to have
Given n0, n, and λ, we can solve for ρ. Such an ρ is called the effective correlation between individuals in the GWAS population. The above equation is a quadratic function of ρ and the positive root is the effective ρ. For example, the effective sample size from the kinship matrix of the rice population consisting of 210 RILs (n = 210 and assume λ = 1) is n0 = 303.7358, which is calculated from Eq. (57). Substituting n0 into Eq. (58) and solving for ρ leads to ρ = 0.6237.
Sample size and smallest detectable QTL
We generated various population sizes with different marker densities via simulations to show the relationship among the kinship matrix (under some special situations), the effective ρ and the statistical power. We simulated a sample of n = 1000 with variable number of markers starting from m = 1000 to m = 10,000 incremented by 1000. The distance between consecutive markers is 1 cM (equivalent to a recombination fraction of 0.01). We also assumed λ = 1 so that we can calculate the effective ρ. Supplementary Figure S1 (panel A) shows the change of ρ against the number of markers. Clearly, ρ decreases as the number of markers increases. However, the increase in the number of markers is caused by the increase of genome size because the distance between two consecutive markers is a fixed number. So, 1000 markers correspond to a 10 Morgan of genome size while 10k markers correspond to a genome size 100 Morgan. We then simulated n = 1000 individuals with a fixed genome size (10 Morgan). This time we varied the marker density from 1 marker per cM to 10 markers per cM. The result is illustrated in Supplementary Figure S1 (panel B). The effective ρ plotted against the marker density appears to be flat, i.e., it does not depend on the marker density but solely depends on the genome size. We then simulated another n = 1000 individuals with a fixed number of markers (m = 1000) but varied the genome size from 10 Morgan to 100 Morgan. The result is demonstrated in Supplementary Figure S1 (panel C), showing that the effective ρ monotonically decreases as the genome size increases. Finally, we fixed the genome size at 10 Morgan with m = 1000 markers and varied the sample size to see how ρ changes as the sample size changes. Supplementary Figure S1 (panel D), shows the increase of ρ when the sample size changes from n = 500 to n = 6500 incremented by 1000. So, large samples will increase the effective ρ and eventually increase the power.
We further simulated n = 10,000 individuals with m = 100k markers to construct the kinship matrix. The marker density is one marker per 0.03 cM (equivalent to 33 markers per cM), which corresponds to a genome size of 30 Morgan in length. Such a kinship matrix may be common in GWAS. We also set λ = 1 (equivalent to 50% of polygenic contribution). From this kinship matrix, we found that the effective sample size is n0 = 18684.89 and the corresponding effective correlation coefficient is ρ = 0.9297. Assume that the QTL contributes \(h_{QTL}^2 = 0.05\) of the phenotypic variance, from Eq. (37), we obtain
At α = 0.05/100,000 = 5 × 10⁻⁷, this non-centrality parameter leads to a perfect statistical power (100%). We now let the power be ω = 1−β = 0.90 and try to find out the smallest detectable QTL by this sample. The corresponding non-centrality parameter is δβ = (z1−α/2 + z1−β)2 = 39.79, from which we can find \(h_{QTL}^2\) using
So, with a sample size n = 10,000 and marker number m = 100k, we can detect a QTL that explains less than 0.20% of the phenotypic variance with a 90% power. We also extracted the first n = 1000 individuals from that large sample (with m = 100k markers) for analysis. Under the same set up as the large sample, i.e., λ = 1, α = 5 × 10⁻⁷ and β = 0.10, we found that, with 90% power, such a population (1000 individuals) can detect a QTL as small as \(h_{QTL}^2 = 0.024\). If we are not interested in detecting any QTL with size smaller than 0.024, there is no reason to use a sample larger than n = 1000.
Finally, from the same large simulated population with 100k markers evenly distributed on a 30 Morgan genome, we evaluated the minimum QTL size that can be detected with 90% power at α = 5 × 10⁻⁷ under several different levels of λ with variable sample size n. We varied λ from 1 to 10 incremented by 1, equivalent to \(h_{\mathrm{POLY}}^2\) changing from 0.5 to 0.9. We varied n from 1000 to 10,000 incremented by 1000, where the first n individuals of the large sample were extracted for the analysis. The minimum detectable QTL size is obtained from Eq. (60). The results are summarized in Table 2. In the worst situation where n = 1000 and λ = 1, with 90% power, the minimum detectable QTL is 2.389%. In the best situation where n = 10,000 and λ = 10, the smallest detectable QTL is 0.045%. Table 2 shows the result when λ changes from 1 to 10. The effective correlation coefficients between individuals that correspond to the 10 different levels of sample size (n) and 10 different levels of polygenic contributions (λ) are shown in Table 3. This table is useful for people who are interested in calculating the statistical power for a particular population structure. For example, if one has a population of size 2000 and wants to find the statistical power of detecting a QTL explaining 0.01 of the phenotypic variance, he can choose a ρ value from the second row of Table 3. Let us assume that the polygenic contribution is λ = 2, the corresponding effective correlation is ρ = 0.8815, which leads to
The corresponding non-centrality parameter is
The statistical power is
Tables 2 and 3 only show the results when the population size (n) starts from 1000 and the polygenic effect (λ) starts from 1. Supplementary Data S5 and S6 show the results when the sample size ranges from 100 to 10,000 and the polygenic effect (λ) ranges from 0 to 10. These two supplementary tables provide guidelines for investigators to evaluate the potential effectiveness of their populations.
Interestingly, we compared the minimum detectable QTL under 90% power obtained from GWAPower (Figure 2 of Feng et al. (2011)) and those obtained from our Supplementary Data S5 (the first column of Data S5 when λ = 0). The comparison is illustrated in Supplementary Figure S2. The two methods are identical in the situation where λ = 0, i.e., when the polygenic effect is ignored. This comparison is to show that our powers in the absence of polygenic effects are the same as the powers of the simple fixed model GWAS. When the polygenic effect is present, Feng et al. (2011) method cannot be used because it does not take into account the kinship matrix. Using the HIV study data (Fellay et al. 2007), Feng et al. (2011) claimed that with a sample size 486, the minimum detectable QTL is \(h_{QTL}^2 = 0.07\); with a sample size 2554, the minimum detectable QTL is \(h_{QTL}^2 = 0.014\). In our study (Supplementary Data S5), we show that the minimum detectable QTL sizes are about 0.073 (n = 500) and 0.016 (n = 2500), respectively, very close to findings of Feng et al. (2011).
Results of simulation to validate the theoretical powers
Additive model
For the additive model of the 210 RIL population, we simulated one sample from each combination of λ and \(h_{QTL}^2\), where λ = {0, 1, 2} and \(h_{QTL}^2 = \left\{ {0,0.001,0.002, \cdots ,0.06} \right\}\), a total of 3 × 61 = 183 combinations. Using the 0.05 nominal p-value threshold for one marker per experiment, the statistical powers are shown in Fig. 4. The simulated powers (open circles) vary slightly around the theoretical powers (smooth curves), which validates the theoretical powers. The powers under the three levels of λ are different, with λ = 2 having the highest powers and λ = 0 the lowest powers. The fluctuation of the simulated powers is due to sampling errors because we used the 0.05 nominal p-value as the criterion for detection. In other words, we simulated one marker at a time and compared the p-value of this marker against 0.05 to declare significance for this marker. The simulation was replicated 1000 times. The proportion of samples with significant detection over 1000 replicates is the empirical powers. If we had increased the number of replicates to 10,000, the simulated powers would have been much closer to the theoretical values.

Comparison of the theoretical powers to the empirical powers from simulation studies using the kinship matrix of 210 recombinant inbred lines (RIL) of rice under the additive model. Smooth curves are theoretical power functions and fluctuated curves tagged with open circles are empirical power functions obtained from simulations. The power functions are evaluated under three levels of polygenic contribution represented by the ratios of the polygenic variance to the residual variance (\(\lambda = \sigma _\xi ^2{\mathrm{/}}\sigma ^2\))
The choice of the p-value threshold is irrelevant to the comparison of the simulated powers with the theoretical powers. In the following example, we simulated 10 independent markers per genome. The p-value threshold after Bonferroni correction was 0.05/10 = 0.005. For each experiment, we compared the p-values of all 10 markers with 0.005 and recorded the number of significant markers for each experiment. Such an experiment was replicated 1000 times so that an empirical power under each scenario was calculated. The powers are illustrated in Supplementary Figure S3. The simulated powers (open circles) are much closer to the theoretical powers (smooth curves). However, we actually performed 3 × 61 × 10 × 1000 = 1,830,000 independent simulations here compared with 3 × 61 × 1 × 1000 = 183,000 independent simulations when a single marker was detected at a time using the 0.05 nominal p-value criterion. The shapes of the power functions for 10 markers are different from those of the powers for one marker.
In the 210 RIL rice example, the number of markers is m = 1619. If we detect 1619 markers in one experiment, the Bonferroni corrected threshold should be 0.05/m = 0.00003088. The entire experiment must be done 3 × 61 × 1619 × 1000 = 296,277,000 times. We did not simulate this large number of experiments but only calculated the theoretical power functions, as shown in Supplementary Figure S4. From this figure, we can easily find the powers to detect a QTL explaining 0.05 of the phenotypic variance under the three λ values, which are roughly 0.20, 0.42, and 0.66 for λ being 0, 1, and 2, respectively. The sample size of the population is not large enough to detect a QTL explaining 0.05 of the phenotypic variance with a reasonable power. The powers would be sufficiently high to detect a QTL with size \(h_{QTL}^2 = 0.10\).
Genotypic model
The population with 278 hybrids was used to validate the genotypic model (additive plus dominance). The theoretical power functions and empirical powers from simulation are illustrated in Fig. 5 under the 0.05 nominal p-value threshold. Again, the simulated powers vary slightly around the theoretical powers, validating the power calculation for the genotypic model. The theoretical power functions using the 0.05/1619 = 0.00003088 threshold by detecting 1619 bins in one experiment are shown in Supplementary Figure S5. The powers of this population are higher than the 210 RIL population, either due to the larger population size or the genotypic model or both. When \(h_{QTL}^2\) is 0.05, the powers are 0.27 for λ = 0, 0.57 for λ = 1, and 0.78 for λ = 2. A power of 0.78 is already reasonably high. The power to detect a QTL with \(h_{QTL}^2 = 0.10\) is about 0.88 even for the worst case scenario of λ = 0.

Comparison of the theoretical powers to the empirical powers from simulation studies using the kinship matrix of 278 hybrid rice under the additive plus dominance model. Smooth curves are theoretical power functions and fluctuated curves tagged with open circles are empirical power functions obtained from simulations. The power functions are evaluated under three levels of polygenic contribution represented by the ratios of the polygenic variance to the residual variance (\(\lambda = \sigma _\xi ^2{\mathrm{/}}\sigma ^2\))
Population structure
The population of 524 rice varieties was used to simulate statistical powers in the presence of population structure. Figure 6 shows the theoretical powers and empirical powers from simulations under λ = 1 and three scenarios of correlation between the population structure and the marker under study. The nominal 0.05 p-value threshold was used since each time only one marker was tested. The simulated powers fluctuated slightly around the theoretical powers, as expected, which validates the power calculation of GWAS for structured populations. Maximum powers occurred when the population structure was not correlated with the marker (rQZ = 0). When the correlation was 0.5, a slight reduction of power was observed. As the correlation reached 0.9, the power was substantially reduced. One can imagine that if the correlation is 1.0, the power will be reduced to zero. If we had tested m = 180,000 markers in one simulation experiment, we would have used the Bonferroni corrected p-value threshold, 0.05/m = 2.78 × 10⁻⁷, as the criterion for significance declaration. Under each combination of \(h_{QTL}^2\) and rQZ, we would need to test m markers. If 1000 replications were done, the entire simulation experiment would have been done 1000m = 180,000,000 times just for one combination of \(h_{QTL}^2\) and rQZ. Although it is impossible to simulate such a huge experiment within a reasonable amount of time, we can calculate the theoretical powers in the blink of an eye. Supplementary Figure S6 shows the theoretical powers under λ = 1 and the three levels of rQZ. When population structure is present but it is ignored, the power will be reduced compared to the power when the population structure effect is included in the model. This can be validated by Fig. 7, where the correlation between the population structure and the QTL is rQZ = 0. If rQZ ≠ 0, one of the assumptions of the linear model will be violated and no theoretical powers are available.

Comparison of the theoretical powers to the empirical powers from simulation studies using the kinship matrix of 524 rice cultivars with correction for population structures (indica and japonica subspecies). Smooth curves are theoretical power functions and fluctuated curves tagged with open circles are empirical power functions obtained from simulations. The power functions are evaluated under \(\lambda = \sigma _\xi ^2{\mathrm{/}}\sigma ^2 = 1\) and three levels of correlation between population structure (Q) and the genotypic indicator variable (Z)

Comparison of the theoretical powers to the empirical powers from simulation studies using the kinship matrix of 524 rice cultivars with and without correction for population structures (indica and japonica subspecies). Smooth curves are theoretical power functions and fluctuated curves tagged with open circles are empirical power functions obtained from simulations. The power functions are evaluated under \(\lambda = \sigma _\xi ^2{\mathrm{/}}\sigma ^2 = 1\) and the correlation between population structure (Q) and the genotypic indicator variable (Z) is rQZ = 0
Powers of QTL mapping using full-sib and half-sib families
Responding to a reviewer’s comment on the effect of relatedness among individuals on the statistic power, we simulated two populations, one consisting of 20 full-sib families and the other consisting of 20 half-sib families. Each family had 25 members and thus each population had 500 individuals. The additive relationship matrices (Supplementary Data S7 and S8) were included in the LMM to capture the polygenic effects. Two levels of the polygenic effects were investigated, λ = 1 and λ = 2. We expected that the population made of full-sib families would have higher power than the population consisting of half-sib families. Using the nominal p-value threshold of 0.05 to declare statistical significance, we examined the power functions against \(h_{QTL}^2\) that ranges from 0.0 to 0.05. The results are shown in Supplementary Figures S7 and S8, where the former compares the simulated powers with the theoretical powers and the latter compares the powers of full-sib families with the powers of half-sib families. The conclusions are (1) the simulated powers match the theoretical powers closely and (2) the population of full-sib families is indeed more powerful than the population of half-sib families.
Discussion
The rapid development of new DNA sequencing technology and the low cost of genotyping make GWAS more popular as tools to detect QTL for quantitative traits of agronomical, behavioral, and medical importance. The samples of GWAS can be as large as more than half million in human (Marouli et al. 2017). Typical GWAS samples are in the order of a few hundreds to a few thousands. In this study, we showed that the smallest detectable QTL using a sample of 10,000 individuals ranges from 0.4% to 0.04% of the phenotypic variance (depending on the polygenic contribution), assuming that 100k markers are scanned and used to construct the kinship matrix (see Supplementary Data S5). Such small QTL, although statistically significant, are not useful biologically. Therefore, using very large samples for GWAS is not always necessary. If the polygenic contribution is 50% of the phenotypic variance, 500 individuals are sufficient to detect a QTL explaining 5% of the phenotypic variance (see Supplementary Data S5). Extremely large samples may be important for detecting rare genetic variants that are often important for rare diseases (Visscher et al. 2017). Large sample sizes may also be necessary for QTL mapping and GWAS for discretely distributed traits. These traits are often analyzed using the generalized LMM (Che and Xu 2012), in which the Wald test statistic follows the Chi-square distribution only asymptotically. Detecting dominance effects requires a slightly larger sample than detecting additive effects because the dominance indicator variable often has a smaller variance than the additive indicator variable. Detecting epistatic effects (interaction effects between loci) requires even larger samples because (1) the epistatic genotype indicator variables have even smaller variances (they are like rare variants) and (2) more stringent Bonferroni correction (too many epistatic effects to be tested in a single experiment). Large samples may also be useful for determination of the number of loci and prediction of phenotypes via GWAS. However, genomic prediction often requires different statistical methods, not GWAS (Meuwissen et al. 2001).
The statistical power developed here is not the empirical power drawn from multiple simulation studies; rather, it is derived based on theoretical distributions of the test statistics (central and non-central Chi-square distributions). The key to evaluate the power is the non-centrality parameter, which is proportional to the product of the sample size (n) and the squared effect of the QTL relative to the residual variance. It is important to emphasize that if a QTL is statistically significant, it is true (subject to the controlled Type 1 error), regardless of how small the sample size is. There are many studies being rejected initially by the editors and reviewers due to small sample sizes. The investigators are forced to repeat the experiments using much larger samples. In our opinion, rejection of a study based on small sample sizes is unfair to the investigators. The reason is that the significance test (non-centrality parameter) is the product of the sample size and the QTL size; The sample size has already been taken into account when the test statistic is calculated. If the test is significant in a small sample, the effect must be very large to compensate for the small sample size. Such a QTL should be more important than a very small QTL detected in an extremely large sample. Unfortunately, many editors and reviewers often favor the latter and criticize the former. One particular comment against small samples is the “Beavis’ effect” in small samples, i.e., small samples lead to upward bias in estimated QTL effect (Beavis 1994; Xu 2003). This is an abuse or misinterpretation of the Beavis’ effect. In the original simulation study, Beavis (1994) claimed that the average reported QTL size from multiple studies is biased upward for small samples. The reason for such a bias is due to selective reports of QTL mapping results. Only statistically significant QTL are reported and those studies with non-significant detection are left out of the report (Xu 2003). For a single study, regardless of the sample size, a significant QTL is still significant and there is no bias of the estimated effect, if the method itself is unbiased. Although we encourage investigators to use large samples for QTL mapping to increase the probability of detecting more QTL; but if the investigators are lucky enough and have already detected QTLs using small samples, there is no reason to reject their studies. What is the reason for doing statistical tests?
The mixed model in GWAS is a special case in LMM where the covariance structure is modeled by a marker inferred kinship matrix. Compared with its fixed model counterpart, the mixed model power calculation requires a given kinship matrix, which depends on marker data. This has complicated the power calculation for mixed models. Here, we assume that the marker genotype indicator (variable Z) has been standardized (with mean zero and variance 1). In reality, the variance of Z often varies from marker to marker, especially when many rare variants are present. This way of power calculation seems to have ignored the rare variant issue. However, standardization of Z will not affect the power calculation because we defined the QTL size as the proportion of the phenotypic variance contributed by the QTL, denoted by \(h_{QTL}^2\). In the original scale of Z, the genetic variance contributed by the QTL is \(\sigma _G^2 = \sigma _Z^2\gamma ^2\) and \(\sigma _G^2\) is known, regardless of the scale of Z. When we standardize Z, \(\sigma _G^2 = (\gamma ^ \ast )^2\). Therefore, \((\gamma ^ \ast )^2 = \sigma _Z^2\gamma ^2\) and γ = γ*/σZ. For a rare variant, σZ is extremely small, leading to a very large QTL effect (γ) to compensate for the small σZ and produce the same \(h_{QTL}^2\) as a common variant. Therefore, rare variants are hard to detect because the effect must be huge to produce a QTL with a detectable \(h_{QTL}^2\) and the sample size to detect rare variants must be very large (Bush and Moore 2012).
Statistical powers and Type 1 errors are concepts depending on known genetic parameters, population structures, and sample sizes. In real data analysis, the genetic parameters (effects of QTL) are not known. Therefore, there are no such things as powers and Type 1 errors in real data analysis. We often see reports that compare the test statistics of two methods, one method generating test statistics higher than the other method, and the authors then claim that the first method has higher power than the second method. In real populations, we really do not know whether the detected QTL are real or just false positives. Therefore, power analysis must be conducted either in theory or with multiple replicated data simulated under the alternative model. In GWAS, the population is often large and the marker density is often very high, making multiple simulation experiments very costly in terms of computational time. Therefore, theoretical evaluation is necessary. This study is the first theoretical evaluation of statistical power under the Q + K mixed model. If an investigator has already collected the marker data, he can just build the kinship matrix and calculate the eigenvalues of the kinship matrix and calculate the effective sample size n0, from which a power can be computed.
In addition to cryptic relatedness, population structure is another factor that needs to be controlled in GWAS (Pritchard et al. 2000b). Effects of population structure on the powers of GWAS have been investigated via Monte Carlo simulations (Atwell et al. 2010; Platt et al. 2010; Korte and Farlow 2013; Shin and Lee 2015; Toosi et al. 2018). A consensus conclusion is that proper control of population structure can reduce false positive rate. If an association population consists of several subpopulations (in human) or several different breeds and their hybrids (in animals), many private alleles (unique to the subpopulations) may exist and the allele frequencies of many loci may be significantly different across subpopulations. If the trait of interest is also associated with the population structures due to historical and geographical reasons, the loci associated with population structures are often detected as associated with the trait, although they may not be the causal loci (Atwell et al. 2010). When the population structure effects are included in the mixed model, the association signals of these loci will be reduced. This explains why fitting population structure effects can reduce false positives. However, population differentiation is most likely caused by natural selection or domestication and loci associated with traits under selection pressure may be the causal loci. As a result, fitting population structure may not be appropriate in GWAS for adaptation-related traits. A well-studied area in evolutionary genomics is to detect selection signatures (Baldwin-Brown et al. 2014; Xu and Garland 2017). The loci associated with population structures are the very loci of interests in evolutionary genomics. Assuming that we do not want to claim loci associated with population structure as significant in GWAS and fitting population structure is necessary, this study is the first to theoretically evaluate the effects of population structures on the statistical powers. The conclusions are consistent with the empirical observations from simulation studies (Toosi et al. 2018). However, if population structural effects are present but ignored in the mixed model, the statistical power will be reduced compared to that if they are taken into account (see Fig. 7), which is due to the increased residual error variance. However, the same phenomenon can be stated alternatively as “Incorporating population structure effects will increase power compared with that if they are ignored.” The alternative statement appears to contradict with the consensus conclusion about population structure. One needs to be careful when interpreting the effects of population structure on statistical power. We also quantified the effect of population structure on power as a function of the correlation coefficient between population structure (Q) and genotype indicator of the locus under study (Zk), the higher the correlation, the lower the power (see Fig. 6 and Supplementary Figure S6).
The power formula derived in this study assumes that the QTL is in perfect LD with a marker. If this is not true, then the calculated power will be lower than the actual power. Let r be the correlation coefficient between Z and the true genotype indicator of the QTL, the power reduction is represented by a reduced QTL effect represented by the ratio of the square of the genetic effect to the residual error variance, r2(γk/σ)2, where γk is the effect of the true QTL and r2 is the linkage disequilibrium parameter. This power reduction can be compensated by an increased marker density. Under the common disease/common variate hypothesis, 500k to a million markers are required (Bush and Moore 2012). Compared with sample size, marker density is less important. Klein (2007) stated that genotyping more individuals with fewer markers is better than genotyping fewer individuals with more markers.
Finally, theoretical power calculation depends on known parameters and the distributions of the test statistics under both the null model and the alternative model. For the usual quantitative trait GWAS and QTL mapping, the residual errors are often normally distributed, resulting in normally distributed estimated QTL effects. The Wald test is a quadratic form of the estimated QTL effects; it is well known that the quadratic form of normal variables (yTAy) follows a Chi-square distribution if the symmetric matrix in the middle (A) is the inverse of the variance matrix of the normal variables. It should be cautious to calculate power for GWAS and QTL mapping with discrete traits, e.g., binary and ordinal traits, because the Wald test statistic follows a Chi-square distribution only asymptotically. Therefore, the sample size for discrete traits should be sufficiently large to ensure the normality of estimated QTL effects and thus the required Chi-square distribution of the test statistic.
Data and R code
Several R functions are available. The R codes and examples to call the functions for power analysis are provided in Supplementary Note S4. A sample kinship matrix with n = 210 individuals used to demonstrate the application is provided in Supplementary Data S1.
References
Almasy L, Blangero J (1998) Multipoint quantitative-trait linkage analysis in general pedigrees. Am J Human Genet 62:1198–1211
Amos CI (1994) Robust variance-components approach for assessing genetic linkage in pedigrees. Am J Human Genet 54:535–543
Andersen EB (1970) Asymptotic properties of conditional maximum likelihood estimators. J R Stat Soc B 32:283–301
Atwell S, Huang YS, Vilhjálmsson BJ, Willems G, Horton M, Li Y, Meng D, Platt A, Tarone AM, Hu TT et al. (2010) Genome-wide association study of 107 phenotypes in Arabidopsis thaliana inbred lines. Nature 465:627
Baldwin-Brown JG, Long AD, Thornton KR (2014) The power to detect quantitative trait loci using resequenced, experimentally evolved populations of diploid, sexual organisms. Mol Biol Evol 31:1040–1055
Beavis WD (1994) The power and deceit of QTL experiments: lessons from comparitive QTL studies. In: Proceedings of the forty-ninth annual corn & sorghum industry research conference. American Seed Trade Association, Washington, D.C., pp 250–266
Bush WS, Moore JH (2012) Chapter 11: genome-wide association studies. PLoS Comput Biol 8:e1002822
Castelloe JM, O’Brien RG (2001) Power and sample size determination for linear models. In: SAS (ed) The twenty-sixth annual SAS users group international conference. SAS Institute Inc., Cary, NC
Che X, Xu S (2012) Generalized linear mixed models for mapping multiple quantitative trait loci. Heredity 109:41
Chen W, Gao Y, Xie W, Gong L, Lu K, Wang W, Li Y, Liu X, Zhang H, Dong H et al. (2014) Genome-wide association analyses provide genetic and biochemical insights into natural variation in rice metabolism. Nat Genet 46:714
Edwards BJ, Haynes C, Levenstien MA, Finch SJ, Gordon D (2005) Power and sample size calculations in the presence of phenotype errors for case/control genetic association studies. BMC Genet 6:18
Faul F, Erdfelder E, Lang A-G, Buchner A (2007) G*Power 3: a flexible statistical power analysis program for the social, behavioral, and biomedical sciences. Behav Res Methods 39:175–191
Fellay J, Shianna KV, Ge D, Colombo S, Ledergerber B, Weale M, Zhang K, Gumbs C, Castagna A, Cossarizza A et al. (2007) A whole-genome association study of major determinants for host control of HIV-1. Science 317:944–947
Feng S, Wang S, Chen C-C, Lan L (2011) GWAPower: a statistical power calculation software for genome-wide association studies with quantitative traits. BMC Genet 12:12
Fulker DW, Cherny SS, Sham PC, Hewitt JK (1999) Combined linkage and association sib-pair analysis for quantitative traits. Am J Hum Genet 64:259–267
Gordon D, Finch SJ, Nothnagel M, Ott J (2002) Power and sample size calculations for case-control genetic association tests when errors are present: application to single nucleotide polymorphisms. Hum Hered 54:22–33
Green P, MacLeod CJ (2016) SIMR: an R package for power analysis of generalized linearmixed models by simulation. Methods Ecol Evol 7:493–498
Haley CS, Knott SA (1992) A simple regression method for mapping quantitative trait loci in line crosses using flanking markers. Heredity 69:315–324
Hong EP, Park JW (2012) Sample size and statistical power calculation in genetic association studies. Genomics Inform 10:117–122
Hua JP, Xing YZ, Xu CG, Sun XL, Yu SB, Zhang Q (2002) Genetic dissection of an elite rice hybrid revealed that heterozygotes are not always advantageous for performance. Genetics 162:1885–1895
Jansen RC (1994) Controlling the type I and type II errors in mapping quantitative trait loci. Genetics 138:871–881
Jiang W, Yu W (2016) Power estimation and sample size determination for replication studies of genome-wide association studies. BMC Genomics 17:19
Johnson PCD, Barry SJE, Ferguson HM, Muller P (2015) Power analysis for generalized linear mixed models in ecology and evolution. Methods Ecol Evol 6:133–142
Kang HM, Zaitlen NA, Wade CM, Kirby A, Heckerman D, Daly MJ, Eskin E (2008) Efficient control of population structure in model organism association mapping. Genetics 178:1709–1723
Kao CH, Zeng ZB, Teasdale RD (1999) Multiple interval mapping for quantitative trait loci. Genetics 152:1203–1216
Kim W, Gordon D, Sebat J, Ye KQ, Finch SJ (2008) Computing power and sample size for case-control association studies with copy number polymorphism: application of mixture-based likelihood ratio test. PLoS ONE 3:e3475
Klein RJ (2007) Power analysis for genome-wide association studies. BMC Genet 8:58
Kononoff PJ, Hanford KJ (2006) Technical note: estimating statistical power of mixed models used in dairy nutrition experiments. J Dairy Sci 89:3968–3971
Korte A, Farlow A (2013) The advantages and limitations of trait analysis with GWAS: a review. Plant Methods 9:29
Lander ES, Botstein D (1989) Mapping Mendelian factors underlying quantitative traits using RFLP linkage maps. Genetics 121:185–199
Lippert C, Listgarten J, Liu Y, Kadie CM, Davidson RI, Heckerman D (2011) FaST linear mixed models for genome-wide association studies. Nat Methods 8:833–835
Listgarten J, Lippert C, Kadie CM, Davidson RI, Eskin E, Heckerman D (2012) Improved linear mixed models for genome-wide association studies. Nat Methods 9:525–526
Marouli E, Graff M, Medina-Gomez C, Lo KS, Wood AR, Kjaer TR, Fine RS, Lu Y, Schurmann C, Highland HM et al. (2017) Rare and low-frequency coding variants alter human adult height. Nature 542:186
Martin JGA, Nussey DH, Wilson AJ, Reale D (2011) Measuring individual differences in reaction norms in field and experimental studies: a power analysis of random regression models. Methods Ecol Evol 2:362–374
Menashe I, Rosenberg PS, Chen BE (2008) PGA: power calculator for case-control genetic association analyses. BMC Genet 9:36–36
Meuwissen THE, Hayes BJ, Goddard ME (2001) Prediction of total genetic value using genome-wide dense marker maps. Genetics 157:1819–1829
Platt A, Vilhjálmsson BJ, Nordborg M (2010) Conditions under which genome-wide association studies will be positively misleading. Genetics 186:1045–1052
Pritchard JK, Stephens M, Donnelly P (2000a) Inference of population structure using multilocus genotype data. Genetics 155:945–959
Pritchard JK, Stephens M, Rosenberg NA, Donnelly P (2000b) Association mapping in structured populations. Am J Hum Genet 67:170–181
Purcell S, Cherny SS, Sham PC (2003) Genetic power calculator: design of linkage and association genetic mapping studies of complex traits. Bioinformatics 19:149–150
Purcell S, Neale B, Todd-Brown K, Thomas L, Ferreira MAR, Bender D, Maller J, Sklar P, de Bakker PIW, Daly MJ et al. (2007) PLINK: a tool set for whole-genome association and population-based linkage analyses. Am J Hum Genet 81:559–575
Sham PC, Cherny SS, Purcell S, Hewitt JK (2000) Power of linkage versus association analysis of quantitative traits, by use of variance-components models, for sibship data. Am J Hum Genet 66:1616–1630
Shin J, Lee C (2015) Statistical power for identifying nucleotide markers associated with quantitative traits in genome-wide association analysis using a mixed model. Genomics 105:1–4
Skol AD, Scott LJ, Abecasis GR, Boehnke M (2006) Joint analysis is more efficient than replication-based analysis for two-stage genome-wide association studies. Nat Genet 38:209
Spencer CCA, Su Z, Donnelly P, Marchini J (2009) Designing genome-wide association studies: sample size, power, imputation, and the choice of genotyping chip. PLoS Genet 5:e1000477
Toosi A, Fernando RL, Dekkers JCM (2018) Genome-wide mapping of quantitative trait loci in admixed populations using mixed linear model and Bayesian multiple regression analysis. Genet Sel Evol 50:32
VanRaden PM (2008) Efficient methods to compute genomic predictions. J Dairy Sci 91:4414–4423
Visscher PM, Wray NR, Zhang Q, Sklar P, McCarthy MI, Brown MA, Yang J (2017) 10 Years of GWAS discovery: biology, function, and translation. Am J Hum Genet 101:5–22
Wang Q, Wei J, Pan Y, Xu S (2016) An efficient empirical Bayes method for genomewide association studies. J Anim Breed Genet 133:253–263
Wei J, Xu S (2016) A random model approach to QTL mapping in multi-parent advanced generation inter-cross (MAGIC) populations. Genetics 202:471–486
Xing YZ, Tan YF, Hua JP, Sun XL, Xu CG (2002) Characterization of the main effects, epistatic effects and their environmental interactions of QTLs on the genetic basis of yield traits in rice. Theor Appl Genet 105:248–257
Xu S (2003) Theoretical basis of the Beavis effect. Genetics 165:2259–2268
Xu S (2013a) Mapping quantitative trait loci by controlling polygenic background effects. Genetics 195:1209–1222
Xu S (2013b) Principles of statistical genomics. Springer, New York
Xu S, Atchley WR (1995) A random model approach to interval mapping of quantitative trait loci. Genetics 141:1189–1197
Xu S, Garland T (2017) A mixed model approach to genome-wide association studies for selection signatures, with application to mice bred for voluntary exercise. Behav Genet 207:785–799
Xu S, Zhu D, Zhang Q (2014) Predicting hybrid performance in rice using genomic best linear unbiased prediction. Proc Natl Acad Sci USA 111:12456–12461
Yang J, Weedon MN, Purcell S, Lettre G, Estrada K, Willer CJ, Smith AV, Ingelsson E, O’Connell JR, Mangino M et al. (2011) Genomic inflation factors under polygenic inheritance. Eur J Hum Genet 19:807
Yang J, Zaitlen NA, Goddard ME, Visscher PM, Price AL (2014) Advantages and pitfalls in the application of mixed-model association methods. Nat Genet 46:100
Yu H, Xie W, Wang J, Xing Y, Xu C, Li X, Xiao J, Zhang Q (2011) Gains in QTL detection using an ultra-high density SNP map based on population sequencing relative to traditional RFLP/SSR markers. PLoS ONE 6:e17595
Yu J, Pressoir G, Briggs WH, Vroh Bi I, Yamasaki M, Doebley JF, McMullen MD, Gaut BS, Nielsen DM, Holland JB et al. (2006) A unified mixed-model method for association mapping that accounts for multiple levels of relatedness. Nat Genet 38:203–208
Zeng Z-B (1994) Precision mapping of quantitative trait loci. Genetics 136:1457–1468
Zhou X, Carbonetto P, Stephens M (2013) Polygenic modeling with Bayesian sparse linear mixed models. PLoS Genet 9:e1003264
Acknowledgements
The authors are grateful to the associate editor and two anonymous reviewers for their constructive suggestions for improvement of the first draft of the manuscript. The project was supported by the United States National Science Foundation Collaborative Research Grant 473 DBI-1458515 to SX.
Author information
Authors and Affiliations
Corresponding author
Ethics declarations
Conflict of interest
The authors declare that they have no conflict of interest.
Additional information
Publisher’s note: Springer Nature remains neutral with regard to jurisdictional claims in published maps and institutional affiliations.
Supplementary information
Rights and permissions
About this article

Cite this article
Wang, M., Xu, S. Statistical power in genome-wide association studies and quantitative trait locus mapping. Heredity 123, 287–306 (2019). https://doi.org/10.1038/s41437-019-0205-3
Received:
Revised:
Accepted:
Published:
Issue Date:
DOI: https://doi.org/10.1038/s41437-019-0205-3
- Springer Nature Switzerland AG
This article is cited by
-
Genomic dissection of additive and non-additive genetic effects and genomic prediction in an open-pollinated family test of Japanese larch
BMC Genomics (2024)
-
Genome-wide association study of drought tolerance in wheat (Triticum aestivum L.) identifies SNP markers and candidate genes
Molecular Genetics and Genomics (2024)
-
GWAS determined genetic loci associated with callus induction in oil palm tissue culture
Plant Cell Reports (2024)
-
Mining genes regulating root system architecture in maize based on data integration analysis
Theoretical and Applied Genetics (2023)
-
Robust markers associated with floral traits in roses are suitable for marker-assisted selection across gene pools
Molecular Breeding (2023)