
Abstract
Background/objectives
Prolonged fasting triggers a stress response within the human body. Our objective was to investigate the impact of prolonged fasting, in conjunction with stress, on kynurenine pathway metabolites.
Subjects/methods
Healthy males were divided into fasting group (zero-calorie-restriction) for 6 days (FAST, n = 14), and control group (CON, n = 10). Blood and saliva samples were collected at baseline, Day 2, Day 4, Day 6 during fasting period, and 1 week after resuming regular diet. Plasma levels of kynurenine pathway metabolites were measured using ultra-performance liquid chromatography-mass spectrometry (UPLC-MS/MS). Plasma and salivary samples were analyzed for stress markers.
Results
A pronounced activation of the kynurenine pathway in individuals on FAST trial was revealed. Concentrations of picolinic acid (PIC), kynurenic acid (KYNA) and 3-hydroxykynurenine (3-HK) were significantly increased, with peak levels observed on Day 6 (P < 0.0001). Conversely, concentrations of tryptophan (TRP) and quinolinic acid (QUIN) decreased (P < 0.0001), while kynurenine (KYN) and nicotinamide (NAM) levels remained stable. Cortisol and noradrenaline concentrations remained unchanged. However, adrenaline levels significantly increased on Day 4 within FAST compared to CON (P = 0.005). Notably, all deviations in kynurenine pathway metabolite levels returned to baseline values upon resuming regular diet following the 6-day fasting regimen, even when weight and BMI parameters were not restored.
Conclusions
Extended fasting over 6 days induces the kynurenine pathway and has minimal effects on stress markers. Restoration of metabolite concentrations upon regular feeding implies rapid adaptation of the kynurenine pathway synthetic enzymes to maintain homeostasis when faced with perturbations.
Introduction
Fasting is a practice that involves the intentional restriction or complete avoidance of food and caloric beverages for varying durations, spanning from hours to weeks. It is established that fasting induces ketogenesis, leading to significant alterations in metabolic pathways and cellular processes, including stress resistance, lipolysis, and autophagy. Fasting has been consistently highlighted for its dual role in enhancing overall health and serving as a potential disease modifier (see review: [1]). Moreover, it can complement pharmacological interventions, especially in specific conditions like epilepsy and diabetes [2, 3]. Apart from effects on lipid, protein and glucose metabolism, fasting also elicits effects on psychological health, particularly in relation to mood regulation [4, 5]. During fasting, hepatic gluconeogenesis stands out as a pivotal process [4], leading to the production of ketones, serving as vital energy source for the brain. Emerging evidence strongly suggests that the induction of peroxisome proliferator-activated receptor gamma coactivator 1-alpha (PGC-1α) expression in the liver plays a crucial role in regulating energy utilization by boosting ATP production. This is particularly significant during fasting, where severe caloric restriction is imposed [6]. Fasting strongly induces liver expression of PGC-1α, which in turn induces the expression of kynurenine aminotransferase (KAT) enzymes and 2-amino-3-carboxymuconate-6-semialdehyde decarboxylase (ACMSD) [7, 8]. Interestingly, KAT and ACMSD are enzymes in the kynurenine pathway of TRP degradation through which several neuroactive metabolites are produced. Furthermore, it is shown that the kynurenine pathway, via KYN and KYNA agonist activity on the aryl hydrocarbon receptor, plays a role in T cell differentiation [9], consequently impacting immune system activity regarding tolerance and inflammation [10]. Interestingly, a recent study from our group showed that 2 days of fasting decreased TRP and increased plasma levels of the kynurenine pathway metabolites KYNA, 3-HK, PIC and the PIC/QUIN ratio in women [11].
Extended fasting induces a stress response in the human body. The physiology of stress response has two components: activation of the sympathetic-adreno-medullar axis, which acts fast, and the activation of the hypothalamic-pituitary-adrenal axis that acts slowly [12]. The former provides rapid physiological adaptation via secretion of catecholamines, noradrenaline and adrenaline [12]. The latter regulates feedback inhibition loops that involve the pituitary and adrenal glands, which control glucocorticoid production and cortisol release respectively. Cortisol exerts widespread effects due to the extensive distribution of its respective receptors in the body [12]. Importantly, many studies have shown that the kynurenine pathway can be influenced by different stressors, and induced by cortisol [13]. Our hypothesis posits that extended fasting will initiate a stress response, concurrently impacting kynurenine pathway metabolites levels. In this study, we aim to explore the effects of a 6-day fasting regimen on peripheral stress marker levels and plasma concentrations of kynurenine pathway metabolites in a male cohort.
Materials and methods
Participants
Twenty-nine subjects were assessed for eligibility. The inclusion criteria were (i) male; (ii) aged between 18 and 44 years; (iii) with body mass index (BMI) from 19.5–29.9 kg/m2; (iv) no participation in excessive regular moderate or vigorous physical activity (i.e. 3 times per week) and ≤ 150 min of moderate intensity or ≥ 75 min of vigorous-intensity activity per week; (v) no history of any eating, metabolic, skeletal, cardiovascular, oncological, neuromuscular, mental disabilities or conditions that could be negatively affected by fasting and affect experimental variables; (vi) no history of alcohol dependence or psychotropic drugs dependence and (vii) no blood/needle phobia. Participants were excluded if they were smokers, on any medications or participated in weight reduction programs and/or low-carbohydrate diets. Altogether, twenty-four males met the criteria and agreed to participate. Experiments were performed at the Institute of Sports Science and Innovations, Lithuanian Sports University, from February 2021 to September 2022. Data on 13 out of 14 FAST participants’ glucose, ketone, adrenaline and noradrenaline concentrations for timepoints ‘Baseline’ and ‘Day 6’ have been previously published.
Experimental protocol and study design
Baseline assessment commenced at 08.00–09.00 h when the participants arrived at the laboratory following an 8–13 h overnight fast. Participants were required to refrain from fatigue-related activities and abstain from ingesting caffeine, medication, and alcoholic beverages for at least 72 h before each experiment assessment. Anthropometric measurements were performed, and the participant rested in a semi-recumbent position for 20 min in a quiet room (temperature 24 °C, 60% humidity). Baseline values of capillary ketone and glucose concentrations were measured, and saliva and venous blood samples were collected (Fig. 1). Participants rested for a day before starting on one of the randomly prescribed trials: 6-day FAST trial (n = 14) or CON trial (n = 10) (Fig. 1). IBM Statistical Package for the Social Sciences (SPSS) for Windows version 22.0 (IBM Corp., Armonk, NY, USA) was used for randomization. FAST participants were instructed to follow a prescribed zero-calorie diet with water ad libitum over 6 days. CON participants were instructed to maintain their previous eating habits. On the 2nd, 4th, and 6th day of each trial, capillary ketone and glucose concentrations were measured, and saliva and venous blood samples were obtained (Fig. 1). Following a usual-diet period of 7 days (Day 13) after FAST and CON, capillary ketone and glucose concentrations were measured, saliva and venous blood samples were collected.
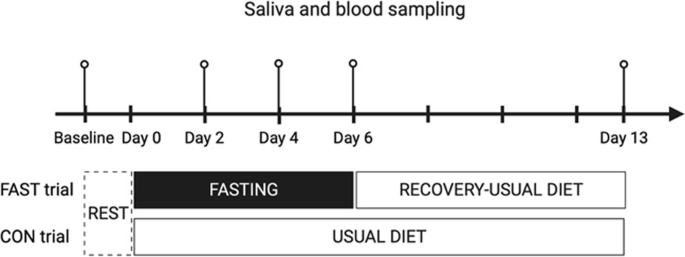
Blood and saliva samples taken at baseline, Day 2, Day 4, Day 6 and Day 13. FAST; fasting (0 kcal/day), CON; usual diet. Created with BioRender.com.
Capillary blood ketone and glucose concentrations
The capillary blood ketone and glucose concentrations were assessed via finger-prick capillary test using the Abbott FreeStyle Optium Neo H blood glucose and ketone monitoring system (Doncaster, Australia).
Blood sample preparation
Venous blood samples from the median antecubital vein were collected into 3 ml vacutainer tubes using EDTA with tri-potassium as an anticoagulant (K3EDTA tube; Fisher Scientific, Waltham, Massachusetts, USA), inverted 8–10 times and kept at 2–8 °C until centrifugation. Plasma was separated by centrifugation at 1200 × g for 15 min at 4 °C within 30 min of blood collection and stored in 0.5 ml aliquots at –80 °C until analysis.
Plasma preparation for UPLC-MS/MS
Thirty μl of human plasma sample, quality control or standard mix, was mixed with 30 μl of internal standard 0.5 μM in 10% ammonia for 15 s. Next, 60 μl of 200 nM ZnSO4 (5 °C) was added and mixed for 15 s. Then, 30 μl of methanol was added (5 °C) and mixed for 15 s. Additionally, the mixture was centrifuged for 10 min at 2841 × g at room temperature. 30 μl of the supernatant was mixed with 30 μl of 5% formic acid in LC-MS Certified Clear Glass 12 × 32-mm vials (product no. 186005662CV, Waters, Milford, Massachusetts, USA). Samples were transferred to an autosampler (5 °C). The volume injected into the system was 1.5 μl.
Detection of TRP and KYN metabolites in plasma
Blinded assessors used an UPLC–MS/MS system to measure plasma levels of TRP, KYN, KYNA, 3-HK, PIC, QUIN and NAM. The UPLC–MS/MS system used a Xevo TQ–XS triple quadrupole mass spectrometer (Waters) with a Z-spray electrospray interface and was operated in electrospray positive multiple reaction monitoring mode. UPLC conditions were as follows: separation was carried out using an Acquity UPLC® HSS T3 column (1.8 m, 2.1150 mm, Waters, part number: 186003540) at 50 °C with a guard column (Waters, Vanguard HSS T3 1.8 m, 2.150 mm column, part number: 186003976) to retain impurities from the mobile phase. The mobile phase consisted of: 0.6% formic acid in water (UPLC grade) and 0.6% formic acid in methanol (UPLC grade). The flow rate was 0.3 ml/min. While the MS was operating at a source temperature of 150 °C, the capillary voltage was set to +3.0 kV. The cone gas flow was 150 l/h and the desolvation gas flow rate was 1000 l/h, while the desolvation temperature was 650 °C. The autosampler was set at 5 °C and each sample took 13.0 min to run. All metabolites measured were detected in higher concentrations than the lowest level of quantification (TRP, 10 nM; KYN, 10 nM; KYNA, 10 nM; 3-HK, 10 nM; PIC, 10 nM; QUIN, 50 nM; and NAM, 10 nM). The coefficient of variation (CV) for quality controls (intra-assay, during 15 h) was less than 6% for all metabolites measured. Data processing and acquisition were performed using the software package MassLynx v 4.1 SCN943 SCN979 (© 2016 Waters Inc.). The detailed description of the method has been previously published [14].
Plasma stress hormones and salivary free cortisol concentrations
The researchers who analyzed saliva and venous blood samples were blinded to the experimental conditions. A minimum of 1.0 ml of saliva samples were collected in microtubes (1.5 ml; FLmedical, Italy) and stored at – 20 °C for later analysis. Cortisol and catecholamines concentrations were measured in duplicates using enzyme-linked immunosorbent assay kits (plasma cortisol: Cat. No. RE52061, catecholamines: Cat. No. RE59242, salivary free cortisol: Cat. No. RE52611, IBL International GmbH, Hamburg, Germany) and a Spark multimode microplate reader (Tecan, Grödig, Austria). The intra-assay CVs were 1.76%, 6.01% and 4.78%, and the inter-assay CVs were 2.42%, 7.32% and 4.94% for plasma cortisol, adrenaline, and noradrenaline, respectively. The intra-assay CV for salivary free cortisol was 3.10% and the inter-assay CV was 9.42%.
Statistical analysis
An a-priori power analysis was conducted using G*Power version 3.1.9.7 (Düsseldorf, Germany), using data from three participants in each group who completed the study. With a significance criterion of α = 0.05 and power = 0.80, the minimum required sample size was 8 participants per group to detect a main moderate effect of 0.6 for essential amino acid TRP. Furthermore, eight participants (6 in experimental group and 2 in control group) were added after considering the attrition rate and missing data.
Statistical analyses were performed using R programming language (RStudio version 2022.12.0 + 353, RStudio Team, Boston, MA, USA). Unpaired, two-tailed Welch t-tests were performed for comparisons between groups using the ggpubr R package. Homogeneity of variance was assessed using the Levene’s test, and all kynurenine pathway metabolite data were log10 transformed before fitting the model. In the case of ketones, the Levene’s test was not passed so robust standard errors were employed before fitting the model. A random linear mixed model with Bonferroni correction test was performed using the lme4 and emmeans R package. Age effect was adjusted as a co-variate factor. Subject was added as a random effect in the model. Pairwise comparisons were used to examine the effect of time within the group and to assess the effect of fasting between groups (FAST vs. CON). Normal distribution of the model residuals was assessed visually with the aid of QQ plots and histograms. All graphs were created using GraphPad Prism 9 (version 9.5.0 (525) GraphPad Software, San Diego, California, USA). Statistical significance was set at P < 0.05. Data are presented as the mean and standard error of the mean (SEM).
Results
At baseline, the groups differed significantly in mean age (FAST 32.1 ± 1.9 vs. CON 23.4 ± 1.0, P = 0.0004) and BMI (kg/m2) (FAST 25.7 ± 0.7 vs. CON 23.6 ± 0.7, P = 0.02), but not in weight (kg) (FAST 88.3 ± 3.9 vs. CON 78.9 ± 4.7, P = 0.15). Age is regarded as a co-variate, therefore the data have been adjusted accordingly (Supplementary Table 1).
Weight experienced a significant decrease during the fasting period (P < 0.0001) and did not rebound to baseline values one week after resuming the regular diet (P < 0.0001) (Fig. 2). Compliance with fasting regime was supported by capillary glucose and ketone changes. In the FAST trial, glucose concentrations were decreasing steadily (P < 0.0001) while ketone concentrations showed a marked increase (P < 0.0001). Both analytes returned to baseline values after recovery (Supplementary Fig. 1).
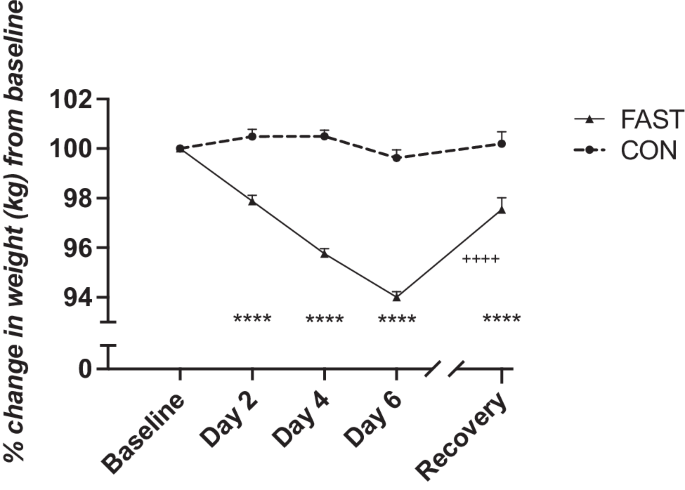
Weight was recorded every day during fasting and subsequently 1 week of recovery. Data are shown in mean ± SEM. ****P < 0.0001, compared with FAST group baseline values, ++++P < 0.0001, for Day 6 -Recovery comparisons within FAST group. FAST; fasting (0 kcal/day), CON usual diet.
The effect of 6-day fasting on the kynurenine pathway was examined by measuring plasma concentrations of the metabolites (TRP, KYN, KYNA, QUIN, 3-HK, PIC, and NAM), as summarized in Fig. 3. In the CON group, no significant time effects were observed for any of the metabolites (all P > 0.05). In contrast, in the FAST group, significant time effects were observed for plasma levels of all metabolites except KYN and NAM. Significant differences were revealed between FAST and CON groups regarding the concentrations of TRP (P < 0.0001), KYNA (P < 0.0001), 3-HK (P < 0.05) and PIC (P < 0.0001) during the 6 days of fasting. While concentrations of TRP significantly decreased (P < 0.001), concentrations of KYNA, 3-HK and PIC increased significantly, peaking at 6 days of fasting. Although QUIN concentrations decreased significantly in the FAST group (P < 0.0001), there were no significant differences between the two groups. All baseline metabolite concentrations were not significantly different from after-recovery metabolite concentrations (P > 0.05), except KYNA (P = 0.006). For 3-HK, KYNA, and PIC a trend of continuously increasing metabolite concentrations persisted until the sixth day of fasting, followed by a subsequent return to baseline metabolite concentrations after resuming to regular diet.
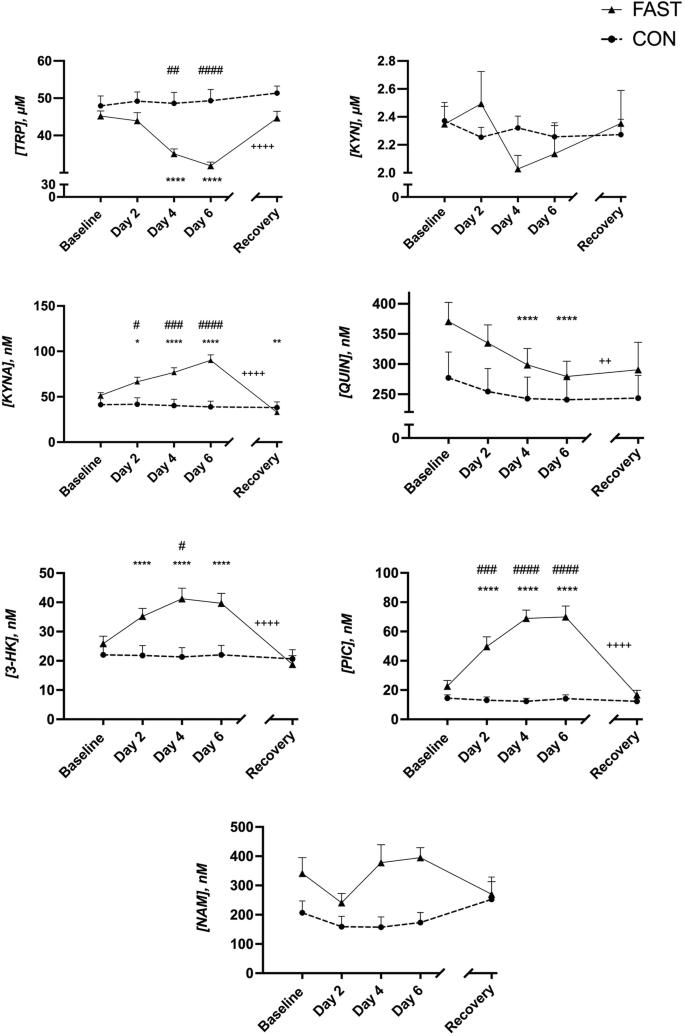
Data are shown in mean ± SEM. *P < 0.05, **P < 0.01, ****P < 0.0001, compared with FAST baseline values. #P < 0.05, ##P < 0.01, ###P < 0.001, ####P < 0.0001 for between group comparisons, ++P < 0.01, ++++P < 0.0001, for Day 6 - Recovery comparisons within FAST group. FAST; fasting (0 kcal/day), CON usual diet.
Salivary and plasma cortisol concentrations showed no significant time or group effects (Fig. 4B, D). Although noradrenaline concentrations appear more variable, no significant effects were observed (Fig. 4A). Adrenaline levels showed no significant time effects within CON group but peaked at day 4 for the individuals in FAST group, resulting in a significant increase from baseline FAST value (Fig. 4C, P = 0.005).
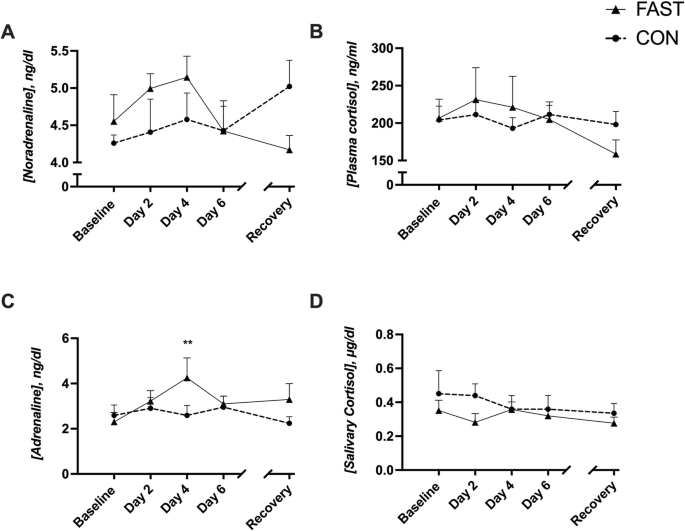
Data are shown in mean ± SEM. **P < 0.01, compared with FAST baseline values. FAST fasting (0 kcal/day), CON usual diet.
Discussion
The kynurenine pathway is the main route for TRP degradation, generating metabolites with widespread functions. The initial step involves conversion of TRP to KYN, catalyzed by enzymes tryptophan 2,3-dioxygenase (TDO) and enzyme indoleamine 2,3-dioxygenase (IDO) [15, 16]. This pathway is implicated in numerous diseases related to immune response and excitatory neurotransmission, inevitably connecting it to neurological and psychiatric disorders [17,18,19]. It is also associated with malaria, diabetes, gastrointestinal disorders, and cancer [20,21,22]. KYN, KYNA and QUIN are proposed biomarkers for disease progression and severity [23, 24], emphasizing the necessity of studies on pathway regulation in healthy individuals.
Accumulating evidence from human and animal studies underscores the preventive benefits of fasting against metabolic and inflammatory disorders [25]. Lifestyle changes, like physical activity and dietary restriction, rather than pharmaceuticals, have historically been the primary approach toward therapy.
The present study explores the impact of prolonged fasting, (over 6 days) on stress markers and plasma concentrations of kynurenine pathway metabolites in healthy males. The results reveal activation of the pathway during fasting, where some metabolites show significant increases, while others remain relatively stable. TRP and QUIN plasma levels decreased. Importantly, all metabolite concentrations reverted to their baseline upon resuming a regular diet, except QUIN, which remained below its baseline for unknown reasons. Notably, the metabolites’ return to baseline was not coupled with full recovery of weight and BMI parameters.
TRP concentration was expectedly decreased as it is an essential amino acid obtained from diet. TRP is vital for energy metabolism, contributing to NAD+ and acetyl-CoA formation, used for ATP generation [26]. Principally, TDO enzyme in the liver controls TRP to KYN conversion [16]. TDO activity has been described to be largely regulated by TRP availability but is also influenced by hormones, such as cortisol and insulin [27]. Notably, glucose inhibits TDO activity in rats [28], and our present study reveals a considerable decrease in glucose concentrations during fasting. KYN is the substrate for all subsequent metabolites in the pathway and may be tightly regulated, thus remained constant during fasting. Hence, the heightened activity of TDO may contribute to the elevation of downstream metabolites (KYNA, 3-HK, PIC).
Insulin suppresses the aminocarboxymuconate-semialdehyde decarboxylase (ACSMD) enzyme, inhibiting PIC production [29]. Reduced glucose and insulin levels attributed to fasting [30], alleviate the inhibition of TDO and ACMSD enzymes, aligning with the study’s findings.
Cortisol induces TDO activity, enhancing breakdown of TRP to KYN [31]. Moreover, cortisol concentration significantly increases after 8 or 10 days of water-only fasting in males and females [32, 33].
Chronic stress activates the kynurenine pathway [34, 35], an effect reversed by IDO inhibition [36]. Aerobic exercise may be protective against stress-induced depression via upregulated expression of KAT enzymes in muscle, consequently increasing KYN to KYNA conversion peripherally, which prevents KYN accumulation in the brain [37]. Stressful events also correlate with increased serum 3-HK levels [38].
Contrary to expectations, stress markers, like cortisol and noradrenaline did not significantly differ throughout fasting. Adrenaline levels were significantly increased after 4 days of fasting as compared to baseline, which may reflect sympathetic adreno-medullar axis activation. Although noradrenaline levels followed the same trend and peaked after 4 days of fasting, the change from baseline was insignificant. Due to cortisol circadian rhythm [39], one may speculate that the once a-day measurement of cortisol in the present study was insufficient to reveal a difference between FAST and CON groups cortisol levels throughout the day. In line with this, a study in primates [40] that employed a continuous 9-h cortisol measurement shows that change in cortisol levels after stress is more noticeable later in the day.
Fasting increased plasma concentrations of KYNA, 3-HK and PIC, whereas QUIN decreased significantly as compared to CON. Remarkably, the same shift was described in a previous 2-day fasting study [11], further supporting present findings. Increased PIC concentration might be attributed to PGC-1α involvement, a transcription coactivator that induces ACMSD expression. Indeed, fasting induces ACMSD via glucagon and glucocorticoid signaling [4, 7, 29]. ACMSD can be conceptualized as a regulator influencing the QUIN/PIC balance, favoring an increased PIC concentration and a decreased QUIN concentration in this context. The heightened PIC concentration also signifies an enhanced acetyl CoA synthesis, which enters the tricarboxylic acid cycle generating energy. Mice studies show the energy modulator PGC-1α increasing KAT enzyme expression in skeletal muscle, thus facilitating KYN to KYNA conversion, thereby enhancing energy efficiency and preventing fatigue [8]. Skeletal muscle mitochondria are essential in energy turnover suggesting PGC-1α expression as a critical factor in calorie restriction, energy storage mobilization, and energy propagation [41].
Increased plasma 3-HK concentration may be the product of increased kynurenine 3-monooxygenase enzyme activity. The enzyme can be influenced by anti-inflammatory cytokines such as IL-4 and IL-10, reflecting an anti-inflammatory function of fasting [42]. This aligns with previously published evidence that suggests the anti-inflammatory actions of PGC-1α on PPAR-α/PPAR-γ, as well as B-hydroxybutyrate on NLRP3 inflammasome [43, 44].
In the present study, but also in a recent study [45], we uncovered a reduction in glucose levels and a significant increase in ketone levels after a 6-day fasting period in males. These effects may be attributed to depletion of liver glycogen stores, leading to fatty acid generation, which are subsequently converted into ketones, including acetoacetate and β-hydroxybutyrate. Ketones serve as primary alternative energy source in the brain. Notably, β-hydroxybutyrate has been shown to elevate KYNA levels in brain cortical slices, primary glial cultures, and in rat brain tissues. [46, 47].
Further, a metabolomics study has demonstrated that fasting for 58 h increases ketone, leucine, and nicotinamide levels [48]. Excess leucine inhibits the quinolinate phosphoribosyltransferase enzyme and induces ACMSD, resulting in increased PIC levels [49], which supports this study’s findings.
Finally, it is crucial to evaluate the results’ reproducibility. By comparing the current data at the 2-day fasting timepoint with findings from another study from our lab involving a 2-day fasting regimen in women, we observe highly comparable levels of all metabolites. The persistent consistency in patterns and concentrations across studies reinforces our results [11].
Limitations
Considering the known sex differences in kynurenine pathway metabolite levels, even under baseline conditions [50], and recognizing that menstrual cycle transitions could significantly influence sex hormone levels, the present study only included males. As a future perspective, a separate study in females, accounting for all three menstrual cycle phases would provide more comprehensive understanding of how metabolic processes vary in females’ hormonal states.
Notably, the FAST and CON group had significantly different mean BMI at baseline. BMI can be considered as a covariate but given the study’s nature, BMI was not adjusted for. Collecting additional blood or saliva samples, especially considering cortisol’s circadian rhythm, would have provided valuable insights. Furthermore, this study did not account for protein binding of the metabolites. Measurements of free metabolites and albumin levels would offer deeper insight into tryptophan metabolism and should be prioritized for future investigations [51, 52].
Conclusion
To conclude, this study demonstrates the effects of prolonged fasting on kynurenine pathway metabolites in healthy, young males. Recovery of metabolite concentrations to baseline after resuming regular diet, alongside non-restored weight and BMI parameters, suggests a rapid adaptation of kynurenine pathway synthetic enzymes to homeostatic perturbations. Further studies are needed to interpret the broader relevance of the observed fasting metabolic profile to diseases associated with the kynurenine pathway.
Data availability
The data analyzed in the current study are not publicly available due to data confidentiality reasons. Data analyzed in this study are available from the corresponding author upon reasonable request.
Code availability
We have followed best practices in open science by making all RStudio analysis scripts used in the study openly available on Github (https://github.com/varlouv/6-day-fasting-study.git).
References
Phillips MCL. Fasting as a therapy in neurological disease. Nutrients. 2019;11:2501.
Longo VD, Mattson MP. Fasting: molecular mechanisms and clinical applications. Cell Metab. 2014;19:181–92.
Wells J, Swaminathan A, Paseka J, Hanson C. Efficacy and safety of a ketogenic diet in children and adolescents with refractory epilepsy-a review. Nutrients. 2020;12:1809.
Yoon JC, Puigserver P, Chen G, Donovan J, Wu Z, Rhee J, et al. Control of hepatic gluconeogenesis through the transcriptional coactivator PGC-1. Nature. 2001;413:131–8.
Wang Y, Wu R. The effect of fasting on human metabolism and psychological health. Dis Markers. 2022;2022:5653739.
Finck BN, Kelly DP. PGC-1 coactivators: inducible regulators of energy metabolism in health and disease. J Clin Invest. 2006;116:615–22.
Koshiguchi M, Hirai S, Egashira Y. PGC1α regulates ACMSD expression through cooperation with HNF4α. Amino Acids. 2018;50:1769–73.
Agudelo LZ, Ferreira DMS, Dadvar S, Cervenka I, Ketscher L, Izadi M, et al. Skeletal muscle PGC-1α1 reroutes kynurenine metabolism to increase energy efficiency and fatigue-resistance. Nat Commun. 2019;10:2767.
Stone TW, Williams RO. Modulation of T cells by tryptophan metabolites in the kynurenine pathway. Trends Pharm Sci. 2023;44:442–56.
Bessede A, Gargaro M, Pallotta MT, Matino D, Servillo G, Brunacci C, et al. Aryl hydrocarbon receptor control of a disease tolerance defence pathway. Nature. 2014;511:184–90.
Solianik R, Schwieler L, Trepci A, Erhardt S, Brazaitis M. Two-day fasting affects kynurenine pathway with additional modulation of short-term whole-body cooling: a quasi-randomised crossover trial. British J Nutr. 2023;129:992–9.
Godoy LD, Rossignoli MT, Delfino-Pereira P, Garcia-Cairasco N, de Lima Umeoka EH. A comprehensive overview on stress neurobiology: basic concepts and clinical implications. Front Behav Neurosci. 2018;12:127.
Jovanovic F, Jovanovic V, Knezevic NN. Glucocorticoid hormones as modulators of the kynurenine pathway in chronic pain conditions. Cells. 2023;12:1178.
Trepci A, Imbeault S, Wyckelsma VL, Westerblad H, Hermansson S, Andersson DC, et al. Quantification of plasma kynurenine metabolites following one bout of sprint interval exercise. Int J Tryptophan Res IJTR. 2020;13:1178646920978241.
Guillemin GJ, Smythe G, Takikawa O, Brew BJ. Expression of indoleamine 2,3-dioxygenase and production of quinolinic acid by human microglia, astrocytes, and neurons. Glia. 2005;49:15–23.
Ball HJ, Jusof FF, Bakmiwewa SM, Hunt NH, Yuasa HJ. Tryptophan-catabolizing enzymes - party of three. Front Immunol. 2014;5:485.
Vécsei L, Szalárdy L, Fülöp F, Toldi J. Kynurenines in the CNS: recent advances and new questions. Nat Rev Drug Discov. 2013;12:64–82.
Schwieler L, Samuelsson M, Frye MA, Bhat M, Schuppe-Koistinen I, Jungholm O, et al. Electroconvulsive therapy suppresses the neurotoxic branch of the kynurenine pathway in treatment-resistant depressed patients. J Neuroinflammation. 2016;13:51.
Erhardt S, Schwieler L, Imbeault S, Engberg G. The kynurenine pathway in schizophrenia and bipolar disorder. Neuropharmacology. 2017;112:297–306.
Chen Y, Guillemin GJ. Kynurenine pathway metabolites in humans: disease and healthy States. Int J Tryptophan Res IJTR. 2009;2:1–19.
Holmberg D, Franzén-Röhl E, Idro R, Opoka RO, Bangirana P, Sellgren CM, et al. Cerebrospinal fluid kynurenine and kynurenic acid concentrations are associated with coma duration and long-term neurocognitive impairment in Ugandan children with cerebral malaria. Malar J. 2017;16:303.
Abd El-Fattah EE. IDO/kynurenine pathway in cancer: possible therapeutic approaches. J Transl Med. 2022;20:347.
Bay-Richter C, Linderholm KR, Lim CK, Samuelsson M, Träskman-Bendz L, Guillemin GJ, et al. A role for inflammatory metabolites as modulators of the glutamate N-methyl-D-aspartate receptor in depression and suicidality. Brain Behav Immun. 2015;43:110–7.
Dschietzig TB, Kellner KH, Sasse K, Boschann F, Klüsener R, Ruppert J, et al. Plasma kynurenine predicts severity and complications of heart failure and associates with established biochemical and clinical markers of disease. Kidney Blood Press Res. 2019;44:765–76.
Varady KA, Hellerstein MK. Alternate-day fasting and chronic disease prevention: a review of human and animal trials. Am J Clin Nutr. 2007;86:7–13.
Badawy AAB. Kynurenine pathway of tryptophan metabolism: regulatory and functional aspects. Int J Tryptophan Res IJTR. 2017;10. Available from: https://www.ncbi.nlm.nih.gov/pmc/articles/PMC5398323/
Schwarcz R, Bruno JP, Muchowski PJ, Wu HQ. Kynurenines in the mammalian brain: when physiology meets pathology. Nat Rev Neurosci. 2012;13:465–77.
Badawy AA, Evans M. The regulation of rat liver tryptophan pyrrolase activity by reduced nicotinamide-adenine dinucleotide (phosphate). Experiments with glucose and nicotinamide. Biochem J. 1976;156:381–90.
Tanabe A, Egashira Y, Fukuoka SI, Shibata K, Sanada H. Expression of rat hepatic 2-amino-3-carboxymuconate-6-semialdehyde decarboxylase is affected by a high protein diet and by streptozotocin-induced diabetes. J Nutr. 2002;132:1153–9.
Jørgensen SW, Hjort L, Gillberg L, Justesen L, Madsbad S, Brøns C, et al. Impact of prolonged fasting on insulin secretion, insulin action, and hepatic versus whole body insulin secretion disposition indices in healthy young males. Am J Physiol-Endocrinol Metab. 2021;320:E281–90.
Messaoud A, Mensi R, Douki W, Neffati F, Najjar MF, Gobbi G, et al. Reduced peripheral availability of tryptophan and increased activation of the kynurenine pathway and cortisol correlate with major depression and suicide. World J Biol Psychiatry. 2019;20:703–11.
Colling C, Bredella MA, Fazeli PK, Pachón-Peña G, Singh RJ, Rosen CJ, et al. Changes in serum cortisol levels after 10 days of overfeeding and fasting. Am J Physiol-Endocrinol Metab. 2023;324:E506–13.
Stec K, Pilis K, Pilis W, Dolibog P, Letkiewicz S, Głębocka A. Effects of fasting on the physiological and psychological responses in middle-aged men. Nutrients. 2023;15:3444.
Chiappelli J, Pocivavsek A, Nugent KL, Notarangelo FM, Kochunov P, Rowland LM, et al. Stress-induced increase in kynurenic acid as a potential biomarker for patients with schizophrenia and distress intolerance. JAMA Psychiatry. 2014;71:761–8.
Chiappelli J, Rowland LM, Notarangelo FM, Wijtenburg SA, Thomas MAR, Pocivavsek A, et al. Salivary kynurenic acid response to psychological stress: inverse relationship to cortical glutamate in schizophrenia. Neuropsychopharmacology. 2018;43:1706–11.
Fuertig R, Azzinnari D, Bergamini G, Cathomas F, Sigrist H, Seifritz E, et al. Mouse chronic social stress increases blood and brain kynurenine pathway activity and fear behaviour: Both effects are reversed by inhibition of indoleamine 2,3-dioxygenase. Brain Behav Immun. 2016;54:59–72.
Agudelo LZ, Femenía T, Orhan F, Porsmyr-Palmertz M, Goiny M, Martinez-Redondo V, et al. Skeletal muscle PGC-1α1 modulates kynurenine metabolism and mediates resilience to stress-induced depression. Cell. 2014;159:33–45.
Küster OC, Laptinskaya D, Fissler P, Schnack C, Zügel M, Nold V. et al. Novel blood-based biomarkers of cognition, stress, and physical or cognitive training in older adults at risk of dementia: preliminary evidence for a role of BDNF, irisin, and the kynurenine pathway. J Alzheimers Dis. 2017;59:1097–111.
Nicolaides NC, Charmandari E, Kino T, Chrousos GP. Stress-related and circadian secretion and target tissue actions of glucocorticoids: impact on health. Front Endocrinol. 2017;8:70.
Verspeek J, Behringer V, Laméris DW, Murtagh R, Salas M, Staes N, et al. Time-lag of urinary and salivary cortisol response after a psychological stressor in bonobos (Pan paniscus). Sci Rep. 2021;11:7905.
Halling JF, Pilegaard H. PGC-1α-mediated regulation of mitochondrial function and physiological implications. Appl Physiol Nutr Metab. 2020;45:927–36.
Kökten T, Hansmannel F, Ndiaye NC, Heba AC, Quilliot D, Dreumont N, et al. Calorie restriction as a new treatment of inflammatory diseases. Adv Nutr. 2021;12:1558–70.
Mandard S, Patsouris D. Nuclear control of the inflammatory response in mammals by peroxisome proliferator-activated receptors. PPAR Res. 2013;2013:613864.
Youm YH, Nguyen KY, Grant RW, Goldberg EL, Bodogai M, Kim D, et al. The ketone metabolite β-hydroxybutyrate blocks NLRP3 inflammasome-mediated inflammatory disease. Nat Med. 2015;21:263–9.
Solianik R, Židonienė K, Eimantas N, Brazaitis M. Prolonged fasting outperforms short-term fasting in terms of glucose tolerance and insulin release: a randomised controlled trial. British J Nutr. 2023;130:1500–9.
Chmiel-Perzyńska I, Kloc R, Perzyński A, Rudzki S, Urbańska EM. Novel aspect of ketone action: β-hydroxybutyrate increases brain synthesis of kynurenic acid in vitro. Neurotox Res. 2011;20:40–50.
Żarnowski T, Chorągiewicz T, Tulidowicz-Bielak M, Thaler S, Rejdak R, Żarnowski I, et al. Ketogenic diet increases concentrations of kynurenic acid in discrete brain structures of young and adult rats. J Neural Transm Vienna Austria 1996. 2012;119:679–84.
Teruya T, Chaleckis R, Takada J, Yanagida M, Kondoh H. Diverse metabolic reactions activated during 58-hr fasting are revealed by non-targeted metabolomic analysis of human blood. Sci Rep. 2019;9:854.
Ghafoorunissa, Rao BSN. Effect of leucine on enzymes of the tryptophan–niacin metabolic pathway in rat liver and kidney. Biochem J. 1973;134:425–30.
Meier TB, Drevets WC, Teague TK, Wurfel BE, Mueller SC, Bodurka J, et al. Kynurenic acid is reduced in females and oral contraceptive users: Implications for depression. Brain Behav Immun. 2018;67:59–64.
Badawy AB. Plasma free tryptophan revisited: what you need to know and do before measuring it. J Psychopharmacol. 2010;24:809–15.
Coppens V, Verkerk R, Morrens M. Tracking TRYCAT: a critical appraisal of kynurenine pathway quantifications in blood. Front Pharm. 2022;13:825948.
Acknowledgements
We thank the participants of the study and Daiva Dainiene who collected the blood samples.
Funding
This work was supported by the Research Council of Lithuania (grant number S-MIP-23-84). Research Council of Lithuania had no role in the design, analysis or writing of this article. This work was supported by grants from the Swedish Research Council (2021-02251), and Åhlén-stiftelsen (SE). Open access funding provided by Karolinska Institute.
Author information
Authors and Affiliations
Contributions
The research was conceived by SE and MB, designed, and conducted by all authors. The data were analyzed by VL and RS and the paper was written by VL. All authors provided constructive feedback and approved the final version of the manuscript.
Corresponding author
Ethics declarations
Competing interests
The authors declare no competing interests.
Ethical approval
This study was approved by the Lithuanian Sports University Bioethics Committee (No. MNL-SFZ(M)-2021-339) and conducted according to the Declaration of Helsinki guidelines. A written informed consent was obtained from all subjects during the initial visit. The trial was registered at ClinicalTrials.gov (No. NCT05545943).
Additional information
Publisher’s note Springer Nature remains neutral with regard to jurisdictional claims in published maps and institutional affiliations.
Supplementary information
Rights and permissions
Open Access This article is licensed under a Creative Commons Attribution 4.0 International License, which permits use, sharing, adaptation, distribution and reproduction in any medium or format, as long as you give appropriate credit to the original author(s) and the source, provide a link to the Creative Commons licence, and indicate if changes were made. The images or other third party material in this article are included in the article’s Creative Commons licence, unless indicated otherwise in a credit line to the material. If material is not included in the article’s Creative Commons licence and your intended use is not permitted by statutory regulation or exceeds the permitted use, you will need to obtain permission directly from the copyright holder. To view a copy of this licence, visit http://creativecommons.org/licenses/by/4.0/.
About this article

Cite this article
Louvrou, V., Solianik, R., Brazaitis, M. et al. Exploring the effect of prolonged fasting on kynurenine pathway metabolites and stress markers in healthy male individuals. Eur J Clin Nutr 78, 677–683 (2024). https://doi.org/10.1038/s41430-024-01451-7
Received:
Accepted:
Published:
Issue Date:
DOI: https://doi.org/10.1038/s41430-024-01451-7
- Springer Nature Limited