
Abstract
Data science is about deriving insight, learning and understanding from data. This process may be automated via the use of advanced algorithms or scaffolded cognitively via the use of graphs. While much emphasis is currently placed on machine learning, there is still much to learn about the role of the data scientist, in particular the thinking process by which he reaches conclusions. The thinking process of the data scientist needs to be scaffolded as the human brain is easily overwhelmed by many variables. Graphs are a form of data abstraction and constitute an essential part of the data scientist’s toolkit. Graphs are also a viable scaffold on which the data scientist may gain familiarity with data. But the process of extracting insight from graphs is not always a trivial or straightforward process; it requires interpretative logic as well. Generalizing from the example of a simple graph type, the Venn diagram, we discuss various logical fallacies that can be committed when interpreting a Venn diagram. Amidst various considerations that dictate how a graph should be tackled, we explain why context is most important, and should form the first guiding principle during data analysis.
1 Introduction
Data science is an exciting new field which is only beginning to find its own footing [1]. While augmented and supported by the advent of exciting new technologies, data science is more than artificial intelligence (AI) and machine learning (ML) algorithms. It is also not just about big data, which merely describes the volume of collected information (big does not mean useful). While these aspects represent incredible technical challenges and have tremendous transformative potential, their purpose is to help the data scientist develop new insight and knowledge.
AI/ML provide greater predictive and data modelling capabilities than traditional statistical approaches but suffer from poor explainability (the decision rules and true quality of learning are not immediately discernible to the end user) [2, 3]. Furthermore, AI/ML does not provide the data scientist with key information, e.g. they do not reveal distribution patterns (based on what you have measured), whether the selected feature set (correlated variables to what you are interested in) makes sense, or if there are hidden confounders. Dumping data wholesale into an AI/ML algorithm without prior checks and personal understanding constitutes poor practice.
Achieving a good personal understanding of data is the responsibility of the data scientist [4, 5]. This process requires technological tools and mental scaffolds: the tools help transform the data into manageable forms, e.g. tables and graphs [6]. The mental scaffold is the application of our reasoning and logical ability on the transformed data. As data become larger, it is impractical to use tables to analyse by eye thousands of variables and observations: the human brain is only capable of storing limited information at any one time [7]. Graphs, as visual abstractions of data, are required to help a data scientist understand data distributions, uncover hidden subpopulations and check for confounding factors. This role is non-substitutable by summary statistics: it is widely known that data with different distributions can produce similar means, correlations and variances. While this problem is famously described by Anscombe’s quartet (a set of four datasets), the problem is by no means an idiosyncratic or rare occurrence: a simulated annealing algorithm was implemented and used to show that any initial dataset with some given general parameters (e.g. mean, standard deviation and correlations) can have its distribution changed to any shape, while preserving those same general parameters [8].
Recently, we noticed a resurgence of interest on how to develop high-quality graphs and how to choose the right set of graphs for conveying the intended message [9, 10]. This is a highly complex area, involving an interplay of cognitive skill, design thinking and other competencies [11]. The ability to interpret graphs and extract a reasonable depth of insight is generally understood as “graph literacy” [12]. Graph literacy is increasingly recognized as an essential skill in today’s data-centric landscape. As data science and big data transform the industrial and technological sectors, achieving reasonably deep understanding of the data and deriving the correct intuition and insight are crucial. One cannot simply rely on computer algorithms and AI to do all the work. These tools are only as smart as the users are [13].
There are many lessons for improving one’s graph literacy. We do not need to look at highly complex visuals, as many of the most important lessons are found in commonly used graph types. We find it fascinating how simple things, often taken for granted, are misused or misunderstood. For example, Weissgerber et al. [14] recently expounded on issues with bar charts, how they mislead and why the scientific field needs to adopt better, more rigorous standards in graph communication. They advocate the use of univariate scatterplots to check for data distributions first and to avoid over-summarizing data prior to checks. Knowing the right tools to use for checking data distributions is sound advice, but in our opinion, checking for trends can only get one so far. In our opinion, minimizing personal bias (honing the mental scaffold) is also important for developing structured graph interpretation skills.
The requirement to check for trends and avoid bias from creeping into graph interpretation suggests a need for more structured thinking in data analysis. Because there is a large diversity of graph forms with each using different structural elements (e.g. axes, points, lines, shapes, etc.) [15], the process of extracting insight is not always a trivial or straightforward process. In reality, there is always more than one way of interpreting a graph, and the degrees of freedom for interpretation rapidly increases as graph complexity rises. It also does not help that biases can creep in, as French philosopher Henri Bergson elegantly phrases it: “The eye sees only what the mind is prepared to comprehend”.
And so, it is important to realize just because we have the tools does not mean we use them right: even with powerful graphs, one can also make mistakes due to weak mental scaffolds. Generalizing from the example of a simple graph type, the Venn diagram (or Venn for short), we discuss in one case study, how conventional interpretation does not work. We also show that depending on the scenario how the relevant regions of the Venn need to change accordingly. In other words, the intersections of a Venn diagram are not always the most important. Amidst the various considerations that dictate how a graph should be interpreted, context is most important and should always form the first guiding principle when attempting interpretation.
2 Why the Venn diagram?
We chose the Venn diagram not because it is a useful visualization for data science (we are not advocating Venn diagrams) but because it is amongst the simplest graph types (next to pie charts, bar charts and line plots). Most people are likely complacent in their ability to get the interpretation right.
We also chose the Venn diagram because it is a clean visual vehicle for interpretive logic, which we will discuss in the next sections. Unlike scatterplots, Venn diagrams (or Venns for short) do not show dynamic relationships amongst samples, e.g. outliers or variances, which are more subjective in interpretation. Moreover, Venns have the potential to convey complex logical relationships, particular in set theory. But because it has a fixed structure, we only need to point out which areas (e.g. the complements and/or intersections) are of interest. This facilitates our discussion on the use of context in graph interpretation.
3 An example where conventional interpretation does not work
It is often agreed that domain knowledge is important for a data scientist to function well, e.g. performing domain-driven data mining and devising solutions that work in the real-world setting [16]. But domain expertise aside, we point out that graph literacy skills are also a must. This is because even when data are transformed into a graph, there are many different ways of interpreting it. Being objective and systematic, which, in turn, allows us to catch our inherent biases, is also important for avoiding judgement errors, even for domain experts.
To return to the example of Venns, when interpreting these, it is intuitive to look at the intersections (often placed in the middle of a graph) without necessarily thinking further, since intersections often convey what is shared, common and conserved. This problem is not restricted to Venns: in networks, the important measures of importance are referred to as centralities [17]. For example, the degree centrality is a measure of how connected a node is to others, thus also conveying notions of what is shared. If you want to see where the most highly connected nodes in a system are in a graph-based visualization of a network, you will want to place these in the middle of the graph instead of hiding them in a corner. This intuitive mental scaffold, where middle positioning is associated with importance, is a form of positive-space thinking (also known as figure-ground reversal), but this is not always the correct way of thinking [18]. Let us consider the scenario below which arose from a biological problem we taught in class.
Biological systems are comprised of genes that operate as a downward cascade. Lying at the top of the cascade is an activator. The activator will turn on genes next in line to itself, forming what is effectively a sequential path. For example, given genes A, B, C and D, we may express their sequential relationship as path: A → B → C → D, where A is the activator. Suppose there are two possible paths p1 (A → B → C → D) and p2 (W → X → Y → Z), where A and W are the activators for p1 and p2, respectively. If A is turned on, but not W, then we would expect genes in p1 to be turned on, but not those in p2. If both A and W are turned on, then genes in both p1 and p2 would be turned on.
Let us now consider an actual biological system: there are three currently known paths activated by genes IRE1, PERK and ATF6 that are associated with a mechanism known as the unfolded protein response (UPR) (Fig. 1a). IRE1, PERK and ATF6 are activators, and so, when turned on, each will turn on the path they control, respectively. Note that this scenario, while based on real biology, is a gross simplification: all three paths of the UPR are activated during endoplasmic reticulum (ER) stress. For simplicity, let us assume that when turning on any of these three paths, all respective downstream targets of any activator are also all turned on, and there is no suppression of any other genes. Let us also assume that there is no crosstalk or convergence amongst these three paths.

Interpretation of Venn diagrams using negative space thinking. a Three individual pathways of the unfolded protein response (UPR): IRE1, PERK and ATF6. (The figure is created using BioRender.) Each individual pathway leads to activation of downstream genes which, in return, activates UPR. b Presented with this Venn diagram, we asked students to figure out if region A is controlled by IRE1. c The intersection of two knocked-out pathways would give rise to the set of genes that are highly regulated by the third pathway. d There are four intersections, V, X, Y and Z. Region X corresponds to genes that are highly regulated by ATF6, region Y corresponds to genes that are highly regulated by PERK, while region Z corresponds to genes that are highly regulated by IRE1. The genes controlled by region V may vary depending on context. e Region U corresponds to the genes in the universal set (denoted by the box) that is not controlled by the three pathways. If we know the true value of U, one can figure out the correct value of region V
Student S performed a series of gene knockouts (KOs) to produce three strains, IRE1-KO, PERK-KO and ATF6-KO. A knockout is a type of biological experiment where a gene is removed so that it no longer exists in the system. Given each knockout strain, we impose ER stress, thereby activating the UPR generically. Student S then analysed which genes are still upregulated in response to the UPR transcriptional programme and then displayed the activated genes of the three knockout strains as a Venn diagram (Fig. 1b).
We used this scenario to identify issues with graph interpretation on a group of biological science students attending a data science course (BS0004 Introduction to Data Science). The first question we asked was whether region A (Fig. 1b) corresponds to genes controlled by IRE1. Despite the sample being labelled “IRE1-KO”, 2/5 student respondents answered “yes” to this question (Table 1). Amongst students who answered “no”, which is the correct answer, one provided the wrong explanation, while another reported that the Venns were incredibly mind-boggling to interpret (suggesting high cognitive load despite the Venn being a common graphical tool).
It should be stated that the students taking this module are domain familiar, being biology students for a good full year prior to taking the data science class. They are also familiar with the use of Venn diagrams. (They are endemic in biological research.) So if domain expertise and graph familiarity are not the issue here, why do students exhibit difficulty in interpreting the graphs correctly?
One key reason is cognitive load: although Venns appear simple, deploying interpretative logic on these effectively is not straightforward once the context shifts from positive-space to negative-space thinking. In this scenario, when cognitive load is high, students tend to make errors in reasoning. We expect that when cognitive load goes up, data scientists too would become more fallible.
So what could be done?
4 Reducing cognitive load using structured thinking methods
By breaking down the Venn into its constituent circles, we may concentrate on any pathway alone. Suppose if we just look at the IRE1-KO circle, we know that a knockout of the activator means all its downstream targets are shut down. This means that within the IRE1-KO circle, there can be no IRE1 downstream genes. By elimination, this means what is contained in the circle representing IRE1-KO is the set of genes compensated by the other two pathways.
Now that we know what each circle contains, we may extend the solution to two circles. Given any pair of circles, the intersection refers to downstream targets of the third pathway (Fig. 1c). Hence, the intersection between IRE1-KO and PERK-KO contains the downstream targets of ATF6. And so, in Fig. 1d, region z reports genes regulated by IRE1, region y includes genes regulated by PERK and region x includes genes regulated by ATF6.
So far, we considered the explanation for the intersections given any pair of samples. But because we have three separate knockout experiments, this can be represented as a three-circle Venn (Fig. 1d). Since there are three circles, this means what resides inside region v, the intersection of all three circles, may provide us with some interesting insight. Suppose if region v is empty, that is, there are no upregulated genes shared amongst the three respective knockout strains, then it would agree with the idea that only three pathways exist AND there is no convergence amongst the three pathways. But if region v is not empty, then possible explanations as to why it is non-empty would be either more than three pathways exist, OR there is convergence amongst the three pathways. (It is also possible that there are genes non-specifically upregulated by other means, but for the purpose of discussion, we do not consider this scenario.)
If we are provided only information on the three knockout strains and nothing more, it will be impossible to distinguish between the two possible explanations as to why region v is not empty. In this situation, having prior knowledge outside of what is controlled by each of the three pathways specifically can help. The set of genes not controlled by PERK, ATF6 and IRE1 is found in region u (Fig. 1e). Given that if only three pathways are known, and there is no prior knowledge of what lies outside the regulatory confines of these three pathways, region u will always be empty. But suppose if we are able to generate additional or missing knowledge by activating UPR generically without PERK, IRE1 and ATF6, then region u is not empty. Where region u is known, it would now represent alternative pathways. And the intersection v, if still not empty, represents convergence events amongst PERK, ATF6 and IRE1 pathways. (In actuality, simultaneous removal of PERK, IRE1 and ATF6 is not possible, as the cells would not be able to survive).
There is one further point: the three circles represent the results of three separate knockout strains done at different times. But when some students looked at the Venn diagram, especially non-biologists (when we tried the same question set amongst students in an introductory bioinformatics course), they misinterpret it as three knockouts done at the same time for the centre intersection and two knockouts done at the same time for other intersections. Under assumption of simultaneous knockouts, the interpretation is quite different.
This example shows that if we rely naively on the structure of the Venn, we can be led astray via gut feeling and intuition. Instead, interpreting Venns becomes significantly easier (and less error prone) when the graph structure is broken down into individual circles first, reasoned upon, and iteratively built up into a final solution. This reduces the cognitive load required for interpretation.
The technique shown here is a demonstration of the computational thinking (CT) concept of decomposition. CT is strongly advocated as an essential thinking skill for the new knowledge economy by Jeanette Wing and others [19]. It is not the only thinking paradigm useful to data scientists although we think it is very useful for developing interpretive logic for graph literacy, allowing us to get more insight from data. And therefore, such “habits of mind” could be emphasized more in data science education [20].
In the final part of the proposed solution, notice that depending on whether the three paths converge or not, it changes the expectation value of v. This is a vital aspect of deploying context—it is not just meant for helping the data scientist make correct interpretations—when used correctly, it can also help create hypothetical models and expectation values that can be verified together with the graph. In other words, context matters greatly. In the following sections, we shall see how some non-domain-specific considerations change the way Venns should be interpreted.
5 Context changes how Venns should be interpreted
5.1 Context Problem 1: Venn diagrams hide sample size information
Weissgerber et al. discussed that bar charts hide critical information regarding sample size [14]. Since each bar in a bar chart essentially represents a mean or standard deviation/error, sample size information can be readily hidden. As an aside, it should be stated here that statisticians have recommended for years that dot charts with intervals are much better than bars in this particular situation.
Suppose if we have a good sample size, then it is more likely we would be able to get a good estimation of the population mean. In other words, the calculated sample mean is a more reliable estimate. But when multiple samplings of vastly different sample sizes are placed next to each other, it makes the less reliable samplings look just as confident as those which are more reliable.
Unsurprisingly, this problem also exists in other commonly used graphs. Given two experiments A and B, and we wished to compare what is common amongst the set of differential features derived from each of these experiments, respectively. The sample sizes of datasets A and B are 1000 and 100, respectively. Assuming no other confounding issues, then A has greater power than B. Let us also assume that the false-discovery rates for A and B are negligible. If we took the intersection between A and B, then the findings are essentially limited by the power of the smaller experiment (which is B) (Fig. 2a) (see Box 1 for what intersections mean in terms of reliability rates). Suppose A reports 1000 features (and they are all correct) and B reports 100 features (and they are also all correct), then the intersection is capped at 100 features. Nine hundred relevant and important features are omitted not because they are irrelevant, but due to unequally powered experiments. What should be done in this case, is to take the union of both experiments, instead of merely focusing on the intersection.
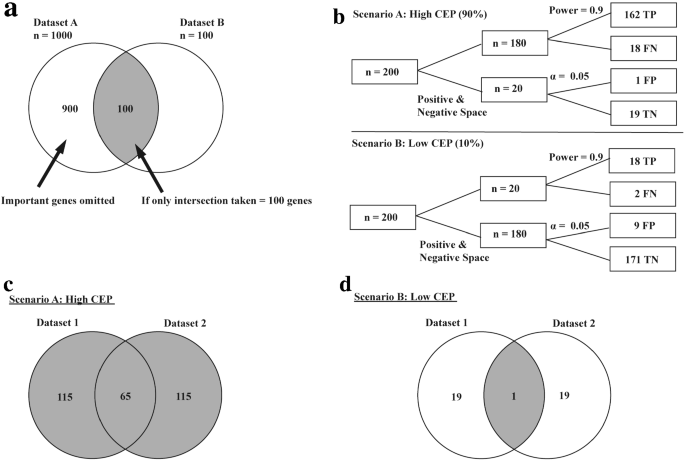
Interpretation of Venn diagrams with differing class effects. a Two sets, A and B, are shown here with varying sample sizes and no other confounding factors. False-discovery rates are assumed to be negligible. Following the traditional method of taking only the intersection between sets A and B, there would be 900 other positive results that are not taken into account due to the smaller sample size of set B. b Two scenarios shown here have the same power of 0.9 and alpha of 0.05 with differing class-effect proportions (or CEP; this is defined as the proportion of correlated variables amongst all measured variables, with outcome of interest). In scenario A, when the machine learner predicts on a dataset with high CEP (90%), 180 would be predicted as true and 20 false. The following branch splits the predictions into true positives (TP), false negatives (FN), false positives (FP) and true negatives (TN). Power works on the positive space, while alpha works on the negative space. With a power of 0.9, 180 positive predictions would split into 162 TP and 18 FN, and an alpha of 0.05 would split 20 negative predictions to 1 FP and 19 TN. In scenario B, low CEP (10%) would split a sample size of 200 into 20 positive predictions and 180 negative predictions. With the same power and alpha, 20 positive predictions would further split into 18 TP and 2 FN and 180 negative predictions would split into 9 FP and 171 TN. c When two simulated datasets of high CEP are compared, the traditional method of taking only the intersection would lead to many but not all correct predictions. Hence, taking the union of both sets as seen in the figure would be better. (d) Conversely, when two simulated datasets of low CEP are compared, due to the large negative space, the traditional method of taking intersections is recommended
As with bar charts and other simple graph forms, it is not customary to include sample size information on the Venn circles themselves. Instead, each experiment is represented by an independent circle, usually of the same size relative to other experiments. And so, when interpreting the Venn, it is important to know necessary background information. Otherwise, it can lead to poor analytical choices.
5.2 Context Problem 2: Class-effect proportion
Class-effect proportion (CEP) is the percentage of correlated-with-class variables in a dataset. Examples of high CEP include dysregulated genes in cancer, where 80% of genes could be correlated with the cancer phenotype [21] or gender wage imbalance, where one gender is always paid higher irrespective of profession.
CEPs are important as they directly affect false-discovery rates (FDR) and therefore the overall reliability of the study. To understand how this happens, let us look at two scenarios A and B involving 200 samples. In A, there is high CEP (90%) and in B, there is low CEP (10%) (Fig. 2b). Let us also assume we have a power of 90% and a type I error rate of 5%. In A, given 200 samples, where 180 are positive and 20 are negative. Since power is 90%, of the 180 positives, 162 would be reported as true positives, leaving 18 false negatives (positive but unreported). Amongst the 20 negatives, given a type I error rate of 5%, we will get 1 false positive and 19 true negatives. Since FDR is the proportion of false positives over all positive predictions made. This gives us 1 over 1 plus 162, which leaves us with a very small number, at 0.006. This suggests most predictions are reliable. And so, when comparing two experiments involving high CEPs, taking the union makes more sense (Fig. 2c).
In scenario B, given 200 samples, where 20 are positive and 180 negative. Since power is 90%, of the 20 positives, 18 will be reported as true positives, leaving 2 false negatives (positive but unreported). Amongst the 180 negatives, given a type I error rate of 5%, 9 will be reported as false positives, whereas 171 will be left alone as true negatives. The FDR in this case is 9 over 9 plus 18, which is one-third or ~ 33.3%.
When CEP is low, it also means that we expect many false positives. And so, when comparing experiments involving low CEPs, this approach of looking at the intersection makes sense (Fig. 2d).
Given these two simple scenarios, it becomes clear that while we may be inclined to delve straight into the intersecting areas of the Venn, this is not always meaningful. It makes sense to consider the context (be it different CEP or sample sizes) carefully first, before deciding how to interpret the graph.
6 Graphs and cognitive load
Earlier, we discussed how a reversal from positive to negative space thinking imposes high cognitive load, and leads towards error in judgement. Graphs are meant to help scaffold our thinking process, and when it becomes unnecessarily complex, alternatives should be sought.
Graphs are imperfect tools, and we need to understand their limitations well. For example, Venns must show all possible intersecting spaces amongst samples, even if some of these spaces are empty. They are also usually not drawn to scale, and so, the extent of the overlaps between circles is not directly correlated with how close two samples are. While there have been attempts to create Venns where overlaps do correlate with closeness [22], this is not ideal: the human eye is poor at perceiving areas and volumes accurately (it is also for the same reason why graph visualization experts eschew pie charts) [6].
Once Venns extend beyond four samples, the structure becomes quite complex (Fig. 3). The odd shapes make it difficult to find the regions of interest and keeping track of what has already been considered before. And so, when extending beyond four samples, interpreting the graph imposes high cognitive load. This is not to say that when n > 4, Venns are uninterpretable. It is just that the effort required to do so has little returns on investment, while the chance of error or missing out critical information is high.

Complexity of Venn diagrams. When the number of sets increases, Venn diagrams become increasingly more complex and harder to interpret. As the number of sets increases from 4 to 7, the number of intersections increases, making it incredibly hard to find specific intersections between sets other than the intersection which all sets are involved in (the Venn diagrams were made using the R package venn)
In such instances, it is important for the data scientist to be aware of reasonable visualization alternatives, i.e. possess good graph literacy skills [6]. In the case of Venns, mosaic and UpSet plots could be used instead [23].
7 Implications for the data science community
Data science education is work-in-progress [24, 25]. But even with the advent of powerful ML and AI technologies, these are merely tools and are only as good as the quality of the data scientist [13].
Furthermore, the data science field is also rapidly finding its own footing regarding logical and interpretative issues in commonly associated areas. There are a great number of conflicting issues regarding explainability and interpretive issues in AI and ML [2, 26]. There are also differing perspectives on how to use ML to decipher actionable rules [27], and interpretive errors due to a lack of understanding of the limitations of mainstream benchmarks such as the ROC curve [28] and prediction accuracy work [29]. Despite the heterogeneity and disparity of these issues, the takeaway is often that solutions needs to be context aware [30] and domain driven [31]. In other words, customize solutions that take into account the various idiosyncrasies of the problem, instead of proffering a cookie cutter approach.
But just as the data science field recognizes the importance of context and domains in crafting customized solutions in the AI and ML applications, these only form part of the data science process. Before data can be used for modelling, its relevance and cleanliness must be taken into account [32]. These tasks fall to the discerning data scientist. The Anscombe’s quartet, and other recent examples, has taught us not to trust summary statistics but to use our eyes to check and understand data in the form of graphs [8]. However, a blithe interpretation of the graphs in terms of sheer distributions is not enough. For any given graph, there are different ways of drawing inferences. The Venn examples discussed here show that context and domain are not just the bailiwick of ML and AI, they are also influential in determining how a graph should be interpreted.
And depending on how the graph is interpreted, this, in turn, influences the tasks of feature selection and feature engineering. This can have strong downstream consequences in the data modelling pipeline.
8 Conclusion: What has Venn diagrams taught us about data science?
Graphs can be useful, but they can also mislead if we rely on raw intuition and instinct, without considering context properly or applying logic carefully. This has implications for doing good data science. We summarize our points as follows:
First, one should understand the context well before attempting to interpret a graph (especially where there are other, albeit less obvious, ways, to interpret the graph structurally). Context includes a good understanding of the domain (whether it is the biosciences or business) and also includes information pertaining to experiment parameters (sample size, false-discovery rate, etc.). It is important to realize that the structure of a graph can induce judgement errors: in the case of Venns, the intersections are not always the most interesting, depending on the context.
Next, if a graph does not work well for you, you should reduce your cognitive load by systematically dissecting the graph. While there are many ways of developing one’s critical thinking ability, we find the computational thinking concept of decomposition particularly useful (we are not saying computational thinking must have immediate relevance for data science. Its relevance and co-evolution with data science need to be further explored, with data supporting its essentiality for data science training) [19].
We suggest that one should never tackle a complex graph head on. After all, when overloading one’s cognitive ability, mistakes and errors in judgement can easily arise. You can break the graph down into simpler structural representations and establish a series of logical rules as you rebuild back upwards into the original graph. Interestingly, we note that decomposition is similar to the educational concept of instructional scaffolding.
Finally, graph literacy skills are important to any data scientist. Graphs are useful mental scaffolds, but they are only as useful as one is knowledgeable about the diversity and limitations of each graph type. The importance of good data visuals and acquiring “habits of mind” is increasingly recognized, especially in professional practice [10]. As data science develops as a field and data science educators deliberate on core curricula, it is important to emphasize graph literacy training.
Availability of data and material
Not applicable.
Abbreviations
- DS:
-
Data science
- AI:
-
Artificial intelligence
- ML:
-
Machine learning
References
Cao, L.: Data science: a comprehensive overview. ACM Comput. Surv. 50(3), Article 43 (2017). https://doi.org/10.1145/3076253
Rudin, C.: Stop explaining black box machine learning models for high stakes decisions and use interpretable models instead. Nat. Mach. Intell. 1(5), 206–215 (2019). https://doi.org/10.1038/s42256-019-0048-x
Fellous, J.M., Sapiro, G., Rossi, A., Mayberg, H., Ferrante, M.: Explainable artificial intelligence for neuroscience: behavioral neurostimulation. Front. Neurosci. 13, 1346 (2019). https://doi.org/10.3389/fnins.2019.01346
Meng, X.-L.: Conducting highly principled data science: a Statistician’s job and joy. Stat. Prob. Lett. 136, 51–57 (2018). https://doi.org/10.1016/j.spl.2018.02.053
Kim, M., Zimmermann, T., DeLine, R., Begel, A.: The emerging role of data scientists on software development teams. Paper presented at the Proceedings of the 38th International Conference on Software Engineering, Austin, Texas
Few, S.: Show Me the Numbers: Designing Tables and Graphs to Enlighten. Analytics Press, Oakland (2012)
Halford, G.S., Baker, R., McCredden, J.E., Bain, J.D.: How many variables can humans process? Psychol. Sci. 16(1), 70–76 (2005). https://doi.org/10.1111/j.0956-7976.2005.00782.x
Matejka J, Fitzmaurice Ge (2017) Same stats, different graphs: generating datasets with varied appearance and identical statistics through simulated annealing. In: the 2017 CHI Conference, pp 1290–1294. https://doi.org/10.1145/3025453.3025912
O’Donoghue, S.I., Baldi, B.F., Clark, S.J., Darling, A.E., Hogan, J.M., Kaur, S., Maier-Hein, L., McCarthy, D.J., Moore, W.J., Stenau, E., Swedlow, J.R., Vuong, J., Procter, J.B.: Visualization of biomedical data. Ann. Rev. Biomed. Data Sci. 1(1), 275–304 (2018). https://doi.org/10.1146/annurev-biodatasci-080917-013424
Knaflic, C.N.: Storytelling with data: a data visualization guide for business profession. Wiley, New York (2015)
Wong, B.: Visualizing biological data. Nat. Methods 9(12), 1131 (2012). https://doi.org/10.1038/nmeth.2258
Freedman, E.G., Shah, P.: Toward a model of knowledge-based graph comprehension. Paper presented at the Proceedings of the Second International Conference on Diagrammatic Representation and Inference
Goh, W.W.B., Sze, C.C.: AI paradigms for teaching biotechnology. Trends Biotechnol. 37(1), 1–5 (2019). https://doi.org/10.1016/j.tibtech.2018.09.009
Weissgerber, T.L., Milic, N.M., Winham, S.J., Garovic, V.D.: Beyond bar and line graphs: time for a new data presentation paradigm. PLoS Biol. 13(4), e1002128 (2015). https://doi.org/10.1371/journal.pbio.1002128
Wilkinson, L.: The Grammar of Graphics (Statistics and Computing). Springer, New York (2005)
Cao, L.: Domain-driven data mining: challenges and prospects. IEEE Trans. Knowl. Data Eng. 22(6), 755–769 (2010). https://doi.org/10.1109/TKDE.2010.32
Mark, N.: Networks: An Introduction. Oxford University Press Inc, Oxford (2010)
Wagemans, J., Feldman, J., Gepshtein, S., Kimchi, R., Pomerantz, J.R., van der Helm, P.A., van Leeuwen, C.: A century of Gestalt psychology in visual perception: II. Conceptual and theoretical foundations. Psychol. Bull. 138(6), 1218–1252 (2012). https://doi.org/10.1037/a0029334
Wing, J.: Computational thinking. Commun. ACM 49, 33–35 (2006). https://doi.org/10.1145/1118178.1118215
Finzer, E.: The data science education dilemma. Technol. Innov. Stat. Educ. 7(2), 1–9 (2013)
Wang, D., Cheng, L., Wang, M., Wu, R., Li, P., Li, B., Zhang, Y., Gu, Y., Zhao, W., Wang, C., Guo, Z.: Extensive increase of microarray signals in cancers calls for novel normalization assumptions. Comput. Biol. Chem. 35(3), 126–130 (2011). https://doi.org/10.1016/j.compbiolchem.2011.04.006
O’Brien, R.M.: A consistent and general modified Venn diagram approach that provides insights into regression analysis. PLoS ONE 13(5), e0196740 (2018). https://doi.org/10.1371/journal.pone.0196740
Conway, J.R., Lex, A., Gehlenborg, N.: UpSetR: an R package for the visualization of intersecting sets and their properties. Bioinformatics 33(18), 2938–2940 (2017). https://doi.org/10.1093/bioinformatics/btx364
Goh, W.W.B., Wong, L.: The birth of Bio-data Science: trends, expectations, and applications. Genom. Proteom. Bioinformat. (2020). https://doi.org/10.1016/j.gpb.2020.01.002
Buckingham Shum B, Hawksey M, Baker R, Jeffery N, Behrens J, Pea R (2013) Educational data scientists: a scarce breed. In: Proceedings of the third international conference on learning analytics and knowledge, pp 278–281. https://doi.org/10.1145/2460296.2460355
Lipton, Z.C.: The Mythos of model interpretability. Queue 16(3), 31–57 (2018). https://doi.org/10.1145/3236386.3241340
Semenova L, Rudin C (2019) A study in Rashomon curves and volumes: a new perspective on generalization and model simplicity in machine learning. https://arxiv.org/abs/1908.01755
Halligan, S., Altman, D.G., Mallett, S.: Disadvantages of using the area under the receiver operating characteristic curve to assess imaging tests: a discussion and proposal for an alternative approach. Eur. Radiol. 25(4), 932–939 (2015). https://doi.org/10.1007/s00330-014-3487-0
Ho, S.Y., Wong, L., Goh, W.W.B.: Avoid oversimplifications in machine learning: going beyond the class-prediction accuracy. Patterns 1(2), 100025 (2020). https://doi.org/10.1016/j.patter.2020.100025
Nascimento, N., Alencar, P., Lucena, C., Cowan, D.: A context-aware machine learning-based approach. Paper presented at the Proceedings of the 28th Annual International Conference on Computer Science and Software Engineering, Markham, Ontario, Canada
Weber, F., Schütte, R.: A domain-oriented analysis of the impact of machine learning—the case of retailing. Big Data Cognit. Comput. 3, 11 (2019). https://doi.org/10.3390/bdcc3010011
Meng, X.-L.: Statistical paradises and paradoxes in big data (I): law of large populations, big data paradox, and the 2016 US presidential election. Ann. Appl. Stat 12, 685–726 (2018). https://doi.org/10.1214/18-AOAS1161SF
Funding
WWBG and CCS gratefully acknowledge support from the Accelerating Creativity and Excellence (ACE) and EdeX grants from Nanyang Technological University, Singapore. WWBG also acknowledges an NRF-NSFC (Grant No. NRF2018NRF-NSFC003SB-006). LW acknowledges support from a Kwan Im Thong Hood Cho Temple Chair Professorship and the National Research Foundation Singapore under its AI Singapore Programme (Grant No. AISG-100E−2019-027 and AISG-100E−2019-028).
Author information
Authors and Affiliations
Contributions
HSY contributed to the initial drafting of the manuscript and the development of the figures. ST and CCS provided insight on the education and scientific logic implications. LW and WWBG initiated the project and supervised. All authors contributed towards writing.
Corresponding authors
Ethics declarations
Conflicts of interest
The authors have declared no conflicts of interest.
Additional information
Publisher's Note
Springer Nature remains neutral with regard to jurisdictional claims in published maps and institutional affiliations.
Rights and permissions
About this article

Cite this article
Ho, S.Y., Tan, S., Sze, C.C. et al. What can Venn diagrams teach us about doing data science better?. Int J Data Sci Anal 11, 1–10 (2021). https://doi.org/10.1007/s41060-020-00230-4
Received:
Accepted:
Published:
Issue Date:
DOI: https://doi.org/10.1007/s41060-020-00230-4