
Abstract
The effect of the microstructure formed as a result of ageing in a Ti-50.7 at.% Ni alloy with different B2 austenite grain sizes on its functional properties under bending is studied. The maximum recovery strain of εr = 15.5% is obtained as a result of annealing at 600 °C for 1 h (fine-grained structure). The subsequent degradation of the functional properties after ageing is caused by the reduction of the difference between the dislocation and transformation yield stresses. The material with a coarse-grained structure and the worst combination of functional properties after recrystallisation annealing, on the contrary, represents the poorest combination and should be aged in order to improve the shape recovery characteristics. The revealed regularities can be used as an additional tool for the precise regulation of functional properties in shape memory alloys.
Introduction
Titanium nickelide-based shape memory alloys are widely used functional materials [1,2,3,4,5,6,7,8,9,10,11,12]. They possess unique functional properties, such as a controllable temperature range of shape recovery, superelasticity, one-way and two-way shape memory effects (SME and TWSME, respectively) and recovery stresses. Functional properties are highly sensitive to structure changes. The use of cold deformation, followed by post-deformation annealing, including ageing allows efficient and precise control of SMEs in a wide range [13,14,15,16,17,18,19,20,21]. As shown in [22,23,24,25], the variation of shape memory-inducing modes by varying the initial phase state serves as an additional powerful tool for the control of functional properties.
It was revealed in [26] that the grain size of the recrystallised B2 austenite of Ni-rich titanium nickelide manifests a pronounced effect on the morphology, size and distribution of Ti3Ni4 particles precipitating under isothermal ageing. It was also shown that the grain size and ageing-induced microstructure strongly affect the sequence and kinetics of martensitic transformations [26]. The obtained regularities allow us to assume that these structure features will affect the functional properties of the alloys. To the best of the authors’ knowledge, such information is not presented in any related publication. The present work aims to carry out a comparative study of the functional properties in a hyper-equiatomic Ti-50.7 at.% Ni alloy with different recrystallised grain sizes in the initial state and after isothermal ageing.
In order to trace the effect of microstructure transformation peculiarities on functional properties, we refer to [26] where these aspects are described and discussed in detail.
Experimental Procedure
The present study was performed using a 0.3 mm diameter wire of Ti-50.7 at.% Ni alloy obtained as a result of multipass cold drawing with an accumulated strain of ε = 44% (a true logarithmic strain of e = 0.6). The wire was cut into 50 mm long specimens and shaped for loop-like samples (Fig. 1a). Recrystallisation annealing was performed at temperatures of 600 °C (1 h), 700 °C (20 min) and

SME inducing and measurements: a total strain fixing; b schematic representation of shape recovery process under heating after bending; deformable zone of the sample is given in grey: 1—initial shape, 2—shape under deformation, 3—shape after unloading, 4—shape after heating and SME realisation; c strain-temperature curve illustrating measured SME/TWSME parameters; d arc templates
800 °C (1 h), followed by water quenching in order to obtain the recrystallised structure of B2 austenite with various grain sizes. The subsequent ageing was carried out at 430 °C for 1 and 10 h (it was proved in [19, 27] this temperature is optimal for the most intense ageing process).
Application of Ti–Ni devices is mainly based on bending [2, 3, 28,29,30,31,32]; therefore, bending procedure was chosen for this study. The SME-inducing procedure was carried out using cylindrical mandrels (Fig. 1a, b) and the following mode: loading at a peak temperature TR (initial metastable R martensite), exposure, then cooling in the constrained state to a temperature of − 196 °C, exposure under load and unloading at the same temperature and finally heating up to 100 °C (Fig. 1c). It was proved in [25] that using this mode provides the highest combination of functional properties. The corresponding peak temperatures of the B2 → R transformation for each structure state were determined using differential scanning calorimetry (DSC) curves presented in [26]; the inducing temperatures are given in Table 1. The tensile total strain (εt) of the external layer of the wire under load varied from 12 to 20%. The induced strain (εi) was determined at − 196 °C after unloading (Fig. 1b, c–position 2). The TWSME value was determined after shape recovery and subsequent cooling at − 196 °C.
The strain parameters were determined as
where d is the wire diameter and D is the diameter of the mandrel for calculation of the total strain εt or the diameter of the arc formed by a sample in the process of shape recovery (see Fig. 1a). Note that only the deformable zone of the sample (coloured with grey) was taken into account. The corresponding radius R is shown in Fig. 1b. The measurements of the arc diameter were performed using templates presented in Fig. 1d.
The main parameters of shape recovery in bending were evaluated: \({\varepsilon }_{\mathrm{e}\mathrm{l}}\)—elastic recovery strain; \({\varepsilon }_{\mathrm{i}}\)—induced strain; \({\varepsilon }_{\mathrm{r}}\)—recovery strain due to the shape memory effect; \({\varepsilon }_{\mathrm{r}}^{\mathrm{t}\mathrm{o}\mathrm{t}}\)—total recovery strain (reflects a total shape recovery upon unloading); \({\varepsilon }_{\mathrm{f}}\)—residual strain; \({\varepsilon }_{\mathrm{T}\mathrm{W}}\)—TWSME value. These parameters are related to each other by the following equations:
and
Note that a possible contribution of superelastic (pseudoelastic) recovery strain \({\varepsilon }_{\mathrm{r}}^{\mathrm{s}\mathrm{e}}\) cannot be separated from the true elastic recovery in this experiment; therefore, the total recovery strain \({\varepsilon }_{\mathrm{r}}^{\mathrm{t}\mathrm{o}\mathrm{t}}\) includes all three components:
The shape recovery rate was determined as
Tensile tests were performed with a strain rate of 2 mm/min at a testing temperature of 24 °C and 100 °C using a 0.3 mm diameter wire samples and a computer-controlled machine ‘‘Zwick/Roell”. The force and deformation parameters of the wires were determined, including transformation yield stress associated with B2 austenite or the R-phase transformation into B19′ martensite or with reorientation of martensite (\({\sigma }_{\mathrm{t}\mathrm{r}}\)) and conventional dislocation yield stress (\({\sigma }_{y}\)).
Results and Discussion
The structure of B2 austenite with grain sizes of 5, 11 and 15 μm is formed as a result of recrystallisation annealing at 600, 700 and 800 °C, respectively. The details of this structure are published in [33]. The ageing-induced microstructure formed by Ti3Ni4 particles after subsequent ageing at 430 °C for 1 and 10 h strongly depends on the grain size and ageing time, as schematically illustrated in Fig. 2 (see [26] for details). The calorimetric curves of the forward martensitic transformations obtained by the DSC method and corresponding to the certain grain zones are also presented. The schematic is drawn with respect to the real ratio of the grain size and particle size.

Schematic illustration of ageing-induced microstructures after recrystallisation annealing and ageing. GC and GB represent the grain centre and boundary, respectively (adapted from [26])
To trace the effect of B2 austenite grain size on functional properties, we must analyse the curves shown in Figs. 3, 4, 5. The strains \({\varepsilon }_{\mathrm{i}}\), \({\varepsilon }_{r}\) and \({\varepsilon }_{\mathrm{T}\mathrm{W}}\) are presented by the curves. The \({\varepsilon }_{\mathrm{e}\mathrm{l}}\) is shown as the difference between the \({\varepsilon }_{\mathrm{t}}\) and \({\varepsilon }_{\mathrm{i}}\) curves, while the \({\varepsilon }_{\mathrm{f}}\) is marked as the difference between the \({\varepsilon }_{\mathrm{i}}\) and \({\varepsilon }_{r}\) curves.

Functional properties of alloy with different GS vs. total strain: a–c after RA—initial state; d–f after recrystallisation annealing and subsequent ageing at 430 °C, 1 h; and g–i 430 °C, 10 h

Strain-temperature curves under inducing upon εt = 16%: after heat treatment of a 600 °C, 1 h; b 600 °C, 1 h + 430 °C, 10 h; c 800 °C, 1 h; d 800 °C, 1 h + 430 °C, 10 h

Functional properties vs. ageing time after inducing upon \({{\varvec{\varepsilon}}}_{{\varvec{t}}}\) = 16%
In the fine-grained structured alloy (grain size of 5 μm after recrystallisation annealing without subsequent ageing), the following regularities are observed (Fig. 3a): The \({\varepsilon }_{\mathrm{t}}\) growth from 12 to 19% results in an elastic recovery strain; \({\varepsilon }_{\mathrm{e}\mathrm{l}}\) increase from 0.2 to 3%, with the induced strain and \({\varepsilon }_{i}\) increasing from 12 to 16%. Note that the values of \({\varepsilon }_{\mathrm{i}}\) and \({\varepsilon }_{r}\) almost coincide due to a small \({\varepsilon }_{f}\), which remains in the range of 0.2–0.6%. The TWSME recovery strain \({\varepsilon }_{\mathrm{T}\mathrm{W}}\) increases from 0.2 to 4% (Fig. 3a). The shape recovery rate R remains very high (97–100%).
The increase of B2 austenite grain sizes up to 11 μm (recrystallisation annealing at 700 °C) is accompanied by \({\varepsilon }_{\mathrm{e}\mathrm{l}}\) and \({\varepsilon }_{f}\) growth and causes degradation of \({\varepsilon }_{\mathrm{i}}\) and \({\varepsilon }_{\mathrm{r}}\) (Fig. 3b). The R value varies in the range of 95–98%. Further grain size growth up to 15 μm (recrystallisation annealing at 800 °C, 1 h) results in further degradation of the main functional properties: \({\varepsilon }_{\mathrm{r}}\) significantly drops to 5–11% and \({\varepsilon }_{\mathrm{T}\mathrm{W}}\) drops to 1.1–1.3% (Fig. 3c). The residual strain increases and reaches 3.4–5.7%. The R value reduces to 60%.
Subsequent ageing at 430 °C for 1 h brings changes in the described regularities (Fig. 3d–f). In the fine-grained structure, \({\varepsilon }_{\mathrm{i}}\) and \({\varepsilon }_{\mathrm{r}}\) decrease and \({\varepsilon }_{\mathrm{e}\mathrm{l}}\) and \({\varepsilon }_{f}\) increase when compared with the recrystallisation annealing (see Fig. 3a, d). The R value reduces from 100 to 70%.
The grain size growth up to 11 μm results in an \({\varepsilon }_{\mathrm{e}\mathrm{l}}\) decrease, an \({\varepsilon }_{\mathrm{i}}\) and \({\varepsilon }_{\mathrm{f}}\) increase and some growth of \({\varepsilon }_{\mathrm{r}}\) in the range of \({\varepsilon }_{\mathrm{t}}\) = 12–16%, with a further decrease upon \({\varepsilon }_{\mathrm{t}}\) = 19.5% (Fig. 3e) when compared with recrystallisation annealing (see Fig. 3b). The R value reduces from 90 to 60% in the whole range. In the coarse-grained structure (grain size of 15 μm), after ageing for 1 h, all main functional properties are improved (see Fig. 3f) when compared with the initial state (see Fig. 3c) and the intermediate grain-sized structure after the same ageing (see Fig. 3e). The R value remains at ~ 60%.
The described tendency intensifies after ageing for 10 h (Fig. 3f–h), leading to further degradation of the recovery strain in the fine-grained structured material (see Fig. 3a, d, g) and its growth in the coarse-grained material (see Fig. 3c, f, i). In the material with an intermediate grain size (11 μm), the corresponding changes are not pronounced (see Fig. 3b, e, h). The R value reduces from 70 to 50% in the material with a fine-grained structure and from 85 to 66% in the material with the grain sizes of 11 and 15 μm as a result of ageing.
The strain-temperature curves permit comparison of the shape recovery evolution in the initial state (Fig. 4a, c) and after ageing (Fig. 4b, d) and tracing the degradation of the shape recovery characteristics in the fine-grained structured material (Fig. 5a, b) and their improvement in the coarse-grained structured one (Fig. 5c, d).
The observed regularities permit the conclusion that in the absence of ageing, the material with a fine-grained structure manifests the best combination of functional properties and the material with a coarse-grained structure manifests the worst one. After ageing for 10 h, the worst combination of functional properties is manifested by the material with a fine-grained structure, while the best one is the material with a coarse-grained structure.
For a comparative analysis of the main functional properties vs. ageing time under a total strain of \({\varepsilon }_{\mathrm{t}}\) = 16%, diagrams are plotted in Fig. 5a–c. The material with the fine-grained structure (GS = 5 μm) manifests the maximum value of \({\varepsilon }_{\mathrm{r}}^{\mathrm{t}\mathrm{o}\mathrm{t}}\) = 15.5–16% in two cases: (1) after recrystallisation annealing (initial state) and (2) after recrystallisation annealing and subsequent ageing for 1 h. Note that such ageing brings a decrease of the recovery strain \({\varepsilon }_{\mathrm{r}}\) to 13% compared with case (1), but \({\varepsilon }_{\mathrm{r}}^{\mathrm{t}\mathrm{o}\mathrm{t}}\) remains at the same level when the contribution of the elastic recovery strain increases (see Eq. 4).
Ageing for 10 h results in the degradation of both characteristics to 12 and 8%, respectively, and the appearance of a significant residual strain of 5%.
Note that the effect of ageing time in the material with a grain size of 11 μm is not so pronounced. After recrystallisation annealing, \({\varepsilon }_{\mathrm{r}}^{\mathrm{t}\mathrm{o}\mathrm{t}}\) decreases gradually from 15 to 12.5% after ageing for 1 and 10 h, while \({\varepsilon }_{\mathrm{r}}\) does not practically change after ageing for 1 h (13%) compared with the initial state (12%) and decreases to 11% after 10 h. The residual strain increases from 1% (in the initial state) to 6% after ageing for 10 h (Fig. 5b).
In the coarse-grained material (grain size of 15 μm), \({\varepsilon }_{\mathrm{r}}^{\mathrm{t}\mathrm{o}\mathrm{t}}\) amounts to 10% after recrystallisation annealing, grows up to 13% after ageing for 1 h and reduces to 12% after ageing for 10 h. The \({\varepsilon }_{\mathrm{r}}\) value increases gradually from 7 to 12%, and after ageing for 10 h reaches the value of \({\varepsilon }_{\mathrm{r}}^{\mathrm{t}\mathrm{o}\mathrm{t}}\). The residual strain decreases compared with the unaged material (Fig. 5c).
The described results allow us to draw the conclusion that the maximum values of SME recovery strain and total recovery strain are realised in the fine-grained structured material in the initial state (after recrystallisation annealing) and does not need the following ageing.
The material with a coarse-grained structure and with the worst functional property combination in the initial state should be aged. The ageing time must be determined on the basis of obtaining the desired result. Note that the maximum TWSME value (4%) is realised in a material with a grain size of 5 μm in the initial state (after annealing at 600 °C).
The obtained values of the total recovery strain \({\varepsilon }_{\mathrm{r}}^{\mathrm{t}\mathrm{o}\mathrm{t}}\) and the recovery strain \({\varepsilon }_{\mathrm{r}}\) are abnormally high because they are almost 1.5 times the theoretical (crystallographic) resource of martensitic transformation lattice strain which amounts to 10.5% for the studied alloy composition [34]. According to [35, 36], this phenomenon is determined by an additional mechanical twinning on {113} and {201} planes in B19′ martensite, and this contribution is not associated with the stress-induced martensitic transformation. Aspects of abnormally high recovery strain were discussed in [25] in details.
The described regularities of the effect of the grain size and ageing time on functional properties can be defined as ambiguous. It was proved in [26] that the grain size has a pronounced effect on the microstructure and calorimetric effects (see Fig. 2). In the initial recrystallised state, a material with grain sizes of 5 and 11 μm manifests the continuous forward martensitic transformation B2 → R → B19′. In the case of a coarse-grained structure (grain size of 15 μm), the B2 → B19′ forward martensitic transformation is realised. The reverse B19′ → B2 martensitic transformation is recorded in all cases of the initial structure state [26]. The increase in the grain size from 5 to 15 μm and ageing duration to 10 h is accompanied by multiplication of martensitic transformations to four stages. All these changes strongly affect functional characteristics.
In order to explain the observed regularities, the analysis of the concurrent factors that affect functional properties must be taken into consideration.
- 1.
Ageing brings an increase of the dislocation yield stress for all studied treatments: compare Fig. 6a with Fig. 6b (corresponding to a fine-grained structure) and Fig. 6c with Fig. 6d (corresponding to a coarse-grained structure).
Fig. 6 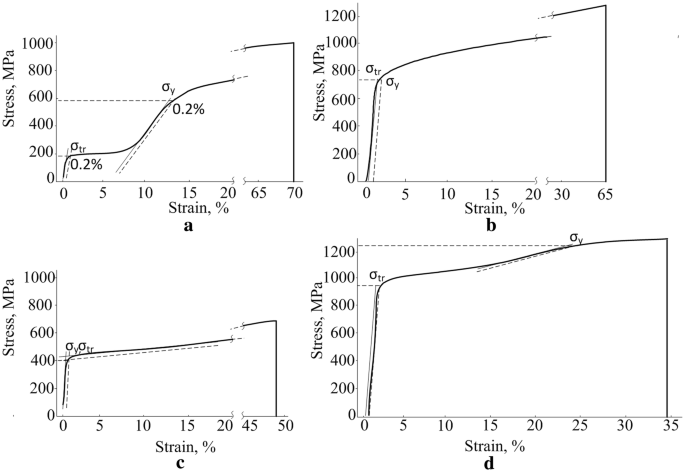
Stress–strain curves: a, c at room temperature; b, d at 100 °C; a 600 °C, 1 h; b 600 °C, 1 h + 430 °C, 10 h, 1 h; c 800 °C, 1 h; d 800 °C, 1 h + 430 °C, 10 h
- 2.
The realisation of the recovery strain is determined by the difference between the dislocation (conventional) and the transformation yield stress [37]. The higher this difference, the later the irreversible plastic yielding by the dislocation mechanism that is involved in the deformation process under SME inducing. The stress–strain curves presented in Fig. 6 permit analysis of the obtained regularities.

To analyse the described results, tensile tests were carried out. Fig. 6 illustrates obtained strain–stress diagrams. To compare mechanical characteristics for all studied structures, the tensile test was performed at the same conditions, regarding TR temperature.
The peak temperatures TR are the same (− 33 °C) for the material after heat treatment 600 °C, 1 h and 800 °C, 1 h (see Table 2) and (43 °C) after subsequent ageing for 10 h (after quenching from 600 °C and 800 °C).
Therefore, the tensile test temperature was chosen 57 °C higher than TR: 25 °C the material after heat treatment 600 °C, 1 h and 800 °C, 1 h and 100 °C after after quenching from 600 °C and 800 °C and subsequent ageing for 10 h (see Table 2). In both cases the test temperature was 57 °C higher than the temperature TR (the used machine “Zwick/Roell” cannot provide the test temperature lower than the room temperature).
The material with the fine-grained structure manifests the maximum difference between the dislocation (conventional) and the transformation yield stress and compounds 400 MPa (see Fig. 1a, Table 2).
The degradation of functional properties in the material with the fine-grained structure, which is observed after the subsequent ageing is logically connected with the suppression of the R → B19′ martensitic transformation (see Fig. 2). At the same time, ageing results in the growth of transformation and dislocation yield stresses and their converging (compare Fig. 6a, b); the difference between them drops. These changes explain the functional properties degradation which is caused by early involvement of the irreversible plastic yielding in the deformation process.
The grain sizes growth after recrystallisation annealing at 800 °C (initial state) results in the decrease of the dislocation yield stress, its converging with the transformation yield stress and, as a consequence, the early start of plastic deformation under SME inducing (compare Fig. 6a, c). These changes become the governing factor of the functional properties degradation.
After ageing at 430 °C for 10 h, the dislocation and transformation yield stresses increase in a material with the grain size of 15 μm up to 950 MPa and 1250 MPa, respectively, (Δσ = 300 MPa) compared with the initial state after recrystallisation annealing (see Table 2), which results in the improvement of the recovery strain.
The above arguments confirm that the obtained results are logical and regular, and they can be used as an additional approach for precise regulation of the SMA functional properties.
Conclusions
In the present work, we studied the effect of grain size and ageing-induced microstructure on functional characteristics of titanium nickelide. We reached the following conclusions.
- 1.
The maximum recovery strain of 15.5% and total recovery strain of 16% are realised in the material with a fine-grained structure (grain size of 5 μm) in the initial recrystallised state without ageing. The grain growth up to 15 μm brings degradation of these parameters caused by the decrease of the difference between the dislocation and transformation yield stresses.
- 2.
The effect of further ageing at 430 °C on functional properties depends on ageing time and a grain size. The fine-grained material manifests the degradation of the functional properties as a result of ageing time increase. On the contrary, the coarse-grained material (grain size of 15 μm) manifests the improvement of functional properties. In the material with the intermediate grain size of 11 μm the effect of ageing time is weakly pronounced; the maximum TWSME value (3.3%) is realised as a result of ageing for 10 h.
- 3.
The described newly revealed peculiarities are caused by the influence of various factors: age hardening and change of the difference between the dislocation and transformation yield stresses after ageing. The contribution of these factors is maximal in the coarse-grained structure.
- 4.
The obtained results are actually original; the revealed regularities can be used as an additional arsenal for precise regulation of the SMA functional characteristics.
References
Serruys PW (1997) Handbook of coronary stents. Rotterdam Thoraxcentre Interventional Cardiology Group, Rotterdam
Razov AI (2004) Application of titanium nickelide-based alloys in engineering. Phys Met Metallogr 97(1):97–126
Duerig TW, Melton KN, Stockel D, Wayman CM (1990) Engineering aspects of shape memory alloys. Butterworth-Heinemann, Oxford
Prokoshkin SD, Ryklina EP, Khmelevskaya IYu, Pushin VG (2004) Application of titanium nickelide-based alloys in medicine. Phys Met Metallogr 97(1):56–96
Ryklina EP, Prokoshkin SD, Khmelevskaya IYu (2003) Medical Applications. In: Brailovski V, Prokoshkin S, Terriault P, Trochu F (eds) Shape memory alloys: fundamentals, modeling and applications. ETS, Canada, pp 775–806
Khmelevskaya I, Ryklina E, Korotitskiy A (2015) Application of thermomechanically treated Ti-Ni SMA. In: Resnina N, Rubanik V (eds) Shape memory alloys: properties, technologies, opportunities. Trans Tech Publication, Pfaffikon, pp 603–637
Ryklina EP, Khmelevskaya IYu, Prokoshkin SD (2004) Use of thermomechanically treated titanium nickelide for medical implants and tools. Met Sci Heat Treat 46(5–6):179–183
Muslov SA, Shelyakov AV, Andreev VA (2018) Shape memory alloys: properties, manufacture and application in technique and medicine. Mozartika, Moscow (in Russian)
Ryklina EP, Khmelevskaya IYu, Prokoshkin SD (2001) Some medical devices based on shape memory and superelasticity of thermomechanically treated titanium nickelide. Metallofiz Noveishie Tekhnol 23(9998):38–41
Khmelevskaya IYu, Ryklina EP, Prokoshkin SD, Markossian GA, Tarutta EP, Iomdina EN (2008) A shape memory device for the treatment of high myopia. Mater Sci Eng A 481–482:651–653. https://doi.org/10.1016/j.msea.2007.02.171
Prokoshkin SD, Butckevitch AC, Chadaev AP, Ryklina EP, Khmelevskaya IY (1996) Elaboration and description of the first application of nitinol extravessel corrector with the shape memory effect. Proc SPIE 2779:986–990
Ryklina, E.P., Khmelevskaya, I.Y., Morozova, T.V., Prokoshkin, S.D: Biomedical engineering in design and application of nitinol stents with shape memory effect. Proceedings of SPIE - The International Society for Optical Engineering 2779, 991–993 (1996)
Saburi T, Tatsumi T, Nenno S (1982) Effects of heat treatment on mechanical behavior of Ti–Ni alloys. J Phys (FY.) 43(12):261–266. https://doi.org/10.1051/jphyscol:1982435
Liu Y, McCormick PG (1989) Influence of heat treatment on the mechanical behavior of a NiTi alloy. ISIJ Int 29(5):417–422. https://doi.org/10.2355/isijinternational.29.417
Scherngell H, Kneissl AC (1998) Inducing and stability of the intrinsic two-way shape memory effect in Ni-Ti alloys. Scripta Mater. 39(2):205–212. https://doi.org/10.1016/S1359-6462(98)00155-9
Kim, J.I., Miyazaki, S.: Effect of nano-scaled precipitates on shape memory behavior of Ti-50.9at.%Ni alloy. Acta Mater. 53 (17), 4545–4554 (2005) https://doi.org/10.1016/j.actamat.2005.06.009
Prokoshkin, S.D., Brailovski, V., Khmelevskaya, I.Yu., Inaekyan, K.E., Demers, V., Dobatkin, S.V., Tatyanin, E.V.: Structure and properties of Severely Cold-Rolled and Annealed Ti-Ni Shape Memory Alloys. Mater. Sci. Eng., A 481−482, 114−118 (2008) https://doi.org/10.1016/j.msea.2007.02.150
Wang, X., Kustov, S., Li K., Schryvers, D., Verlinden, B., Humbeeck, J.V.: Effect of nanoprecipitates on the transformation behavior and functional properties of a Ti–50.8 at.% Ni alloy with micron-sized grains. Acta Mater. 82, 224–233 (2017). https://doi.org/10.1016/j.actamat.2014.09.018
Ryklina EP, Prokoshkin SD, Chernavina AA, Perevoshchikova NN (2010) Investigation on the influence of thermomechanical conditions of induction and structure on the shape memory effects in Ti−Ni alloy. Inorg Mater Appl 1(3):188–194. https://doi.org/10.1134/S2075113310030032
Mohammad Sharafi E, Kermanpur A (2018) Superelastic behavior of nanostructured Ti50Ni48Co2 shape memory alloy with cold rolling processing. Trans Nonferrous Met. Soc. China 28:515–523. https://doi.org/10.1016/S1003-6326(18)64773-9
Lim, Y.G., Han, S.H., Choi, E., Kim, W.J.: Shape memory and superelasticity of nanograined Ti–51.2 at.% Ni alloy processed by severe plastic deformation via high-ratio differential speed rolling. Mater. Charact. 145, 284–293 (2018) https://doi.org/10.1016/j.matchar.2018.08.017
Ryklina, E.P., Prokoshkin, S.D., Chernavina, A.A.: Shape-memory behavior of nanostructured Ti–Ni alloy. ESOMAT 0502516 (2009) https://doi.org/10.1051/esomat/200905025
Ryklina EP, Prokoshkin SD, Chernavina AA (2013) Peculiarities of implementation of abnormally high shape memory effects in thermomechanically treated Ti−Ni alloys. Inorg Mater Appl 4(4):348–355
Ryklina EP, Prokoshkin SD, Kreytsberg AY (2013) Abnormally high recovery strain in TiNi-based shape memory alloys. J Alloys Compd 577:255258. https://doi.org/10.1016/j.jallcom.2012.02.138
Ryklina, E., Prokoshkin, S., Vachiyan, K.: Nanostructured titanium nickelide: realization of abnormally high recovery strain, IOP Conf. Series: Mater. Sci. Eng. 63 (2014) https://dx.doi.org/10.1088/1757-899X/63/1/012110
Ryklina EP, Polyakova KA, Tabachkova NYu, Resnina NN, Prokoshkin SD (2018) Effect of B2 austenite grain size and aging time on microstructure and transformation behavior of thermomechanically treated titanium nickelide. J Alloys Compd 764:626–638. https://doi.org/10.1016/j.jallcom.2018.06.102
Kolobova AYu, Ryklina EP, Prokoshkin SD, Inaekyan KE, Brailovskii V (2018) Study of the evolution of the structure and kinetics of martensitic transformations in a titanium nickelide upon isothermal annealing after hot helical rolling. Phys Met Metallogr 119(2):134–145. https://doi.org/10.1134/S0031918X17120079
Khmelevskaya I, Ryklina E, Prokoshkin S, Soutorine M (2013) Peculiarities of behaviour of Ti−50.7% Ni alloy for suturing of blood vessels. J Alloys Compd 577:752–755
Ryklina E, Korotitskiy A, Khmelevskaya I, Prokoshkin S, Polyakova K, Kolobova A, Soutorine M, Chernov A (2017) Control of phase transformations and microstructure for optimum realization of one-way and two-way shape memory effects in removable surgical clips. Mater Des 136:174–184. https://doi.org/10.1016/j.matdes.2017.09.024
Ryklina EP, Khmelevskaya IYu, Prokoshkin SD, Ipatkin RV, Turilina VYu, Inaekyan KE (2004) Device for urgent bleeding control produced from titanium nickelide with reversible shape memory effect. Met Sci Heat Treat 46(7–8):319–323
Ryklina EP, Khmelevskaya IYu, Prokoshkin SD (2004) Application of thermomechanically treated titanium nickelide to development of medical implants and tools. Met Sci Heat Treat 5:3–7
Ryklina EP, Khmelevskaya IY, Prokoshkin SD, Ipatkin RV (2003) The device «Klyost» for clipping vessels and soft-elastic tubular structures. J Phys IV 112:1129–1132
Polyakova-Vachiyan KA, Ryklina EP, Prokoshkin SD, Dubinskii SM (2016) Dependence of the functional characteristics of thermomechanically processed titanium nickelide on the size of the structural elements of austenite. Phys Met Metallogr 117:817–827. https://doi.org/10.1134/S0031918X16080123
Prokoshkin SD, Korotitskiy AV, Dubinskiy SM, Brailovski V, Inaekyan KE (2011) Crystal lattice of martensite and the reserve of recoverable strain of thermally and thermomechanically treated Ti-Ni shape-memory alloys. Phys Met Metallogr 112:170–187. https://doi.org/10.1134/S0031918X11020244
Chumlyakov Yu, Kireeva I, Panchenko E, Karaman I, Maier HJ, Timofeeva E (2013) Shape memory effect and high-temperature superelasticity in high-strength single crystals. J Alloys Compd 577:393398. https://doi.org/10.1016/j.jallcom.2012.02.003
Chumlyakov YI, Kireeva IV, Panchenko EY, Timofeeva EE, Kretinina IV, Kuts OA (2015) Physics of thermoelastic martensitic in transformation in high-strength single crystals in shape memory alloys. In: Resnina N, Rubanik V (eds) Shape memory alloys: properties, technologies, opportunities. Trans Tech Publication, Pfaffikon, pp 107–173
Brailovski V, Prokoshkin S, Terriault P, Trochu P (2003) Shape memory alloys: fundamentals, modeling and applications. ETS Publ., Montreal
Acknowledgements
The work was carried out with the financial support of the Russian Science Foundation, Project No. 19-79-00365.
Author information
Authors and Affiliations
Corresponding author
Additional information
Publisher's Note
Springer Nature remains neutral with regard to jurisdictional claims in published maps and institutional affiliations.
Rights and permissions
About this article

Cite this article
Polyakova, K.A., Ryklina, E.P. & Prokoshkin, S.D. Effect of Grain Size and Ageing-Induced Microstructure on Functional Characteristics of a Ti-50.7 at.% Ni Alloy. Shap. Mem. Superelasticity 6, 139–147 (2020). https://doi.org/10.1007/s40830-020-00269-z
Published:
Issue Date:
DOI: https://doi.org/10.1007/s40830-020-00269-z