
Abstract
Purpose of Review
Ultrasound of gynecologic diseases has evolved with growing understanding of disease pathophysiology and technical advancements. We review recent literature and summarize relevant changes in practice guidelines for evaluation of endometrial thickening, ovarian masses, and polycystic ovarian syndrome.
Recent Findings
Endometrial thickening can be a sign of endometrial cancer, but normal thickness varies greatly by menstrual state and medication use. Endometrial thickness should raise suspicion at cut-offs of > 5 mm by SRU and > 4 mm by ACOG guidelines for symptomatic postmenopausal women and ≥ 11 mm for asymptomatic postmenopausal women, but is less useful in the premenopausal state or with tamoxifen use. It is now understood that simple ovarian cysts are widely prevalent with a very low likelihood of malignancy, and follow-up and treatment guidelines have been revised. The recently proposed Ovarian-Adnexal Reporting and Data System provides consistent terminology and management guidelines for additional ovarian masses. Polycystic ovarian syndrome diagnosis includes imaging and clinical criteria, with imaging findings requiring > 20 follicles per ovary and/or ovarian volume ≥ 10 mL without presence of corpora lutea, cysts, or dominant follicles.
Summary
This review provides updates of recent changes in female pelvic ultrasound imaging, and we hope it will aid radiologists in accurate diagnosis and management of gynecologic diseases.
Introduction
Gynecologic disease is a source of significant morbidity and mortality in women, with 9% of estimated female cancer deaths in the United States in 2016 due to uterine or ovarian malignancies [1]. Management of these diseases is constantly evolving with growing understanding of disease etiologies and improvements in diagnosis and treatment. Imaging guidelines naturally change to reflect these advancements, and up-to-date knowledge of these changes is important for radiologists. This work provides a review of the newest characterization and management guidelines for ultrasound (US) evaluation of the endometrial stripe, ovarian masses, and polycystic ovarian syndrome.
Endometrial Stripe
Normal Endometrial Stripe
Ultrasound is the usually the first imaging modality used for evaluation of the endometrial stripe. A high-frequency dedicated transvaginal probe should be utilized with a small field-of-view. Measurement of endometrial stripe thickness (ET) is taken as the anterior–posterior dimension of the endometrial stripe on a long-axis image of the uterus. Fluid present in the endometrial cavity is subtracted from the ET measurement [2–••4]. Review of cine clips of the endometrium in long-axis view may improve detection of subtle endometrial pathology and determination of extension of pathology into the myometrium.
The appearance of the endometrial stripe varies greatly with hormone influence, and an understanding of the changes with menstrual state is necessary for accurate assessment. The average menstrual cycle lasts 28 days, with ovulation occurring at day 14. This can be viewed as the ovarian cycle (follicular phase, ovulation, luteal phase) or as the uterine cycle (menses, proliferative phase, ovulation, secretory phase). The follicular/proliferative phase length varies by the length of the menstrual cycle, while the luteal/secretory phase is typically stable at 14 days [5, 6].
Based on the average 28 day cycle, the follicular phase starts at the first day of menstruation (day 0) and lasts until ovulation (day 14) [5]. In the follicular phase, follicle-stimulating hormone (FSH) increases and results in growth of several follicles from each ovary, with typically one dominant follicle reaching maturity and undergoing ovulation. A luteinizing hormone (LH) surge occurs at the end of the follicular phase marking the beginning of ovulation [5]. In the early proliferative phase of the uterine cycle (days 4–7), the endometrium is linear, echogenic, and thin (Fig. 1a). By the late proliferative phase (days 11–14), the endometrium develops a thick trilaminar structure with a thin echogenic inner line and outer basilar layers and a hypoechoic central rim (Fig. 1b) [6]. The endometrial stripe thickness increases in the proliferative phase, with one study showing the average ET increasing from 5.4 mm after menstruation (days 7–8) to 9.2 mm in the late proliferative phase (days 13–14) [7].

Endometrium changes with menstrual cycle. Sagittal ultrasound image of the uterus in the a early proliferative phase shows a thin, linear, echogenic endometrial stripe. The endometrium thickens with the b late proliferative phase, which has a characteristic trilaminar composition. Continued endometrial thickening occurs in the c secretory phase, with a homogenous hyperechoic appearance
After ovulation, the luteal/secretory phase is characterized by the presence of a corpus luteum, which secretes progesterone and prepares the endometrium for potential implantation by a fertilized ovum. The peak vascularization and function of the corpus luteum occurs 8–9 days after ovulation and afterwards declines [6]. In this phase, the endometrium obtains a thick, homogeneous, and hyperechoic appearance (Fig. 1c). The endometrial stripe continues to increase in thickness, to an average of 11.1 mm on day 18, with a 90th percentile average measurement of 17.4 mm [7].
The endometrium decreases in thickness after menopause, which is typically defined as the absence of menses for ≥ 1 year or a FSH serum level of ≥ 40 IU/L [8, 9]. In a study including 201 premenopausal and 133 postmenopausal asymptomatic women, the median ET decreased from 4.8 to 2.8 mm from pre to post-menopause, respectively [10].
Endometrial Cancer
Endometrial cancer (EC) is the most common gynecologic malignancy in developed countries and is increasing in incidence due to its association with obesity and unopposed estrogen [1, 2]. Vaginal bleeding is the primary presenting symptom in 90% of postmenopausal women with EC [•4]. While EC usually occurs after menopause, 20–25% of cases are in premenopausal women [1, 2].
Ultrasound is usually the first imaging modality used to evaluate abnormal uterine bleeding, of which EC is the most concerning etiology. Common benign structural causes of bleeding are first excluded, such as endometrial polyps, adenomyosis, leiomyomas, and endometrial hyperplasia [11]. Abnormal thickness of the endometrial stripe is a key suspicious finding for EC (Fig. 2); this has a complex dependence on the menstrual state, and cut-off values for worrisome findings are subsequently discussed below. Additional ultrasound abnormalities associated with EC include irregular endomyometrial junction, nonuniform echogenicity, and increased vascularity [12]. When suspicious findings are present on ultrasound, endometrial biopsy is necessary for confirmation [13].

Endometrial cancer. Sagittal ultrasound image of the uterus shows a thickened 2.4 cm heterogenous endometrium with irregular endomyometrial junction in this patient with endometrioid type endometrial cancer
The FIGO (International Federation of Gynecology and Obstetrics) system is used for EC staging [2]. While MRI is superior for staging of local disease and CT and PET/CT are used to assess metastatic disease, many findings may also be seen on ultrasound. In Stage 1 disease, FIGO 1A involves < 50% of the myometrium and FIGO 1B involves > 50% (a marker of potential lymphovascular invasion and nodal metastases). Myometrial invasion on ultrasound is visualized as iso- or hyperechoic tissue compared to the surrounding myometrium, and can sometimes only be visualized as an irregular endomyometrial junction; subjective assessment of myometrial invasion on ultrasound has a sensitivity of 77% compared to 87% on MRI [2]. In Stage 2 disease, FIGO 2A is involvement of the cervix while 2B is disruption of the cervical stroma. Iso- or hyperechoic endometrial thickening of the cervical canal is suggestive of cervical involvement on ultrasound, although stages 2A and 2B are difficult to separate [2]. Stage 3 is characterized by tumor extension beyond the uterus but not outside of the pelvis. Ultrasound has been shown to be useful in detection of metastases to the ovaries, with sensitivity of 84–91% and specificity of 94–100% [2]. Stage 4 disease is invasion of the mucosa of the rectum or bladder (4A) or distant metastases (4B) [2].
Endometrial Stripe in Symptomatic Postmenopausal Women
Postmenopausal women with vaginal bleeding are the highest risk group to have EC, and assessment of ET in this population has been well-studied. A large meta-analysis including 5892 postmenopausal women with vaginal bleeding found that an ET cut-off of 5 mm yielded abnormal results in 96% of patients with cancer; normal results conferred a cancer risk of only 1% [14]. Another meta-analysis of 2896 symptomatic postmenopausal women showed a sensitivity of 90.3% with ET of 5 mm, but a sensitivity of 97.9% with an ET of 3 mm, suggesting a 3 mm cut-off may be appropriate [15]. A recent retrospective analysis of 254 symptomatic women found that all ET cut-off values with sensitivity rates > 90% had a false positive rate of ≥ 70%, emphasizing the importance of histological evaluation in any woman with postmenopausal bleeding [16]. A very recent large meta-analysis including 17,339 women with postmenopausal bleeding found that an ET cut-off of ≥ 5 mm had a sensitivity of 96.2% and specificity of 51.5%, which had a similar sensitivity and improved specificity compared to using a cut-off of 3–4 mm, suggesting that 5 mm was an acceptable compromise between sensitivity and specificity [17].
In agreement with many of the large research studies, the 2001 Society of Radiologists in Ultrasound (SRU) consensus statement regards ET > 5 mm as abnormal [18]. More recently, the American College of Obstetricians and Gynecologists (ACOG) in 2018 recommended using a cut-off of ≤ 4 mm to signify normal results. Since type 2 endometrial carcinomas (uterine papillary serous, mucinous, and clear cell) may not have endometrial thickening, persistent or recurrent bleeding still warrants histologic evaluation. Also, failure to identify a thin, distinct endometrial stripe should trigger further work-up [••4].
Ultrasound findings in addition to endometrial thickness may improve EC detection. A prospective study of 1714 women with biopsy-proven EC found that high-risk tumors compared to low-risk tumors were more likely to be larger and have heterogeneous echotexture, irregular endomyometrial junction, and moderate or high vascularity [12]. Dueholm et al. used a quantitative risk of EC (REC) score combining endometrial thickness and additional parameters (e.g., body mass index (BMI), vascularity, interrupted endomyometrial junction, irregular endometrial outline). They found that the REC score could be used to risk stratify patients with ET ≥ 4 mm into low, intermediate, and high probability groups for cancer. A score indicating high probability of malignancy has a predicted sensitivity of 92% and specificity of 94% [19].
Endometrial Stripe in Asymptomatic Postmenopausal Women
Assessment of the endometrial stripe in asymptomatic postmenopausal women may potentially be useful to detect EC prior to development of symptoms and at early disease stage. The majority of studies have indicated that 11 mm is an appropriate ET cut-off in this group. In one study using a theoretical cohort of asymptomatic postmenopausal women, the risk of cancer was calculated to be 6.7% with ET > 11 mm, and 0.002% if ET ≤ 11 mm, suggesting 11 mm is a reasonable cut-off [20]. Similarly, a nested case–control study found that using ET ≥ 10 mm in asymptomatic postmenopausal women yielded a 5.9% risk of EC [3], and a meta-analysis including 4751 asymptomatic postmenopausal women found that the risk of EC/endometrial hyperplasia with atypia was 2.6 times greater in women with ET > 11 mm versus ET 5–10 mm [21]. A recent large prospective study with a final cohort of 900 asymptomatic postmenopausal women found that ET > 11 mm conferred a risk of EC ± hyperplasia with atypia of 6.7–7.9% [13]. Compatible with these findings, ACOG does not recommend further evaluation for an ET > 4 mm incidentally found in asymptomatic postmenopausal women; further, they do not recommend transvaginal ultrasound (TVS) screening for EC in asymptomatic postmenopausal women [••4].
Endometrial Stripe in Premenopausal Women
Evaluation for EC in premenopausal women is complex given the relatively low incidence compared to postmenopausal women and the normal variability of endometrial thickness with menstrual phase. Multiple studies have addressed the use of TVS for EC screening in premenopausal women. A study including 217 asymptomatic premenopausal women showed that an ET of 5.2 mm had a NPV of 99% and PPV of 10% for focal intrauterine pathology, of which only a small subset was EC [10]. A cross-sectional study of 78 symptomatic premenopausal women found that an ET cut-off of 19 mm had a sensitivity of 80% and specificity of 72% for EC [22]. A large retrospective study including 9888 pre- and perimenopausal women found that a thickened endometrium was not associated with endometrial hyperplasia or cancer [8]. Overall, these works indicate that while a normal endometrial stripe effectively excludes uterine pathology, a thickened endometrial stripe is not specific, and TVS should not be used for EC screening in the premenopausal population.
In symptomatic premenopausal women, we suggest correlation of the endometrial appearance with the provided last menstrual period. If the appearance is inconsistent, further evaluation with a sonohysterogram may be beneficial. If the appearance is compatible with the secretory phase, repeat imaging in the early proliferative phase may be useful to exclude pathologies such as an endometrial polyp, which may not be visible in the secretory phase.
Endometrial Stripe with Tamoxifen Use
Tamoxifen is commonly used for breast cancer treatment. While it has an anti-estrogenic effect on breast tissue, it also has an estrogenic effect on the endometrium that can lead to development of endometrial polyps, endometrial hyperplasia, fibroids, adenomyosis, and an increased risk of EC [23, 24]. Tamoxifen characteristically causes endometrial proliferation and thickening and subendometrial cysts (Fig. 3), which can complicate evaluation for EC on ultrasound [25].

Tamoxifen effect on endometrium. Sagittal ultrasound image of the uterus shows a thickened 8 mm endometrium with subendometrial cysts in a 57-year-old woman on tamoxifen treatment
Studies have repeatedly demonstrated changes in the endometrial stripe with tamoxifen use. In a case–control study including 247 postmenopausal women on tamoxifen and 98 controls, the mean ET increased from 3.5 to 9.2 mm after 3 years of tamoxifen use, which was significantly thicker than the control group. After stopping tamoxifen for 6–12 months, the mean ET decreased to 5.0 mm but remained significantly thicker than the baseline value. They found using an ET cut-off of 10 mm had a high false positive rate so endometrial screening by TVS was poor in tamoxifen treated patients [26]. A prospective study in 138 asymptomatic postmenopausal women receiving tamoxifen found that using ET > 6 mm had a sensitivity of 85.1% but a low specificity of 55.7% for endometrial abnormalities such as polyps and submucosal fibroids, noting that no cases of EC were found [24]. One retrospective study assessed 207 patients on tamoxifen or anastrozole (an aromatase inhibitor). They found that ET increased in proportion to duration of tamoxifen treatment (premenopausal ET 3.72–5.50 mm in 3 years and postmenopausal ET 3.45–5.33 mm) but did not increase with anastrozole. Endometrial biopsy was performed for ET > 5 mm, and no cases of EC were found [9]. The difficulty of distinguishing benign tamoxifen-induced changes from EC has led to the idea that ultrasound should only be used in patients on tamoxifen in the setting of abnormal uterine bleeding, and that the “only value of TVS is a normal finding” [27].
Endometrial Stripe Summary
-
Symptomatic postmenopausal women with an ET > 5 mm on ultrasound need further work-up per SRU guidelines. To achieve a higher negative predictive value, ET > 4 mm may be applied according to ACOG recommendations.
-
Asymptomatic postmenopausal women should not undergo ultrasound screening for endometrial cancer. If an ET ≥ 11 mm is incidentally found, tissue sampling may be considered.
-
In the premenopausal state and with Tamoxifen use, a normal endometrial stripe on ultrasound is reassuring, but a thickened endometrium is not specific.
Ovarian Masses
Simple Ovarian Cysts
Simple ovarian cysts are a common finding in female pelvic ultrasound. With a growing understanding of high prevalence of simple ovarian cysts and their low association with malignancy, prior guidelines led to unnecessarily high imaging utilization and overtreatment. In 2019, the SRU issued a consensus update in response to these developments [••28].
Simple Ovarian Cyst Definition
A simple ovarian cyst is defined as a round or oval fluid collection without internal echoes, with thin and smooth walls, no internal septations or solid component, and with no internal blood flow detected by color Doppler imaging (Fig. 4). The prior ultrasound finding of increased through transmission is not always present with use of compound imaging, so it is no longer a requirement [••28]. Ultrasound images should include three orthogonal measurements, with the largest measurement used to direct management [••28].

Simple ovarian cyst. Ultrasound image of the ovary shows a simple cyst characterized by a 4.8 cm anechoic fluid collection with thin, smooth walls, and no internal solid component or septation. No internal blood flow was present on color Doppler images (not shown)
Simple Ovarian Cyst Prevalence and Risk of Malignancy
Many studies have now shown high prevalence of simple ovarian cysts with risk of malignancy similar to the overall population risk. A nested case–control study including 72,093 women showed a high prevalence of simple ovarian cysts, present in 23.8% of women < 50 years old and 13.4% of women ≥ 50 years old. Patients with simple cysts did not have a significantly increased risk of ovarian cancer compared to those with normal ovaries [29]. Similarly, another study showed simple cysts were present in 14% of a cohort of 15,735 women at the time of first ultrasound. The risk of developing invasive ovarian cancer in women with simple ovarian cysts (0.41%) and without simple cysts (0.44%) was not significantly different (p = 0.85) [30]. An autopsy study including 104 adnexa from 52 postmenopausal women found that 54% had adnexal cysts, leading to the conclusion that adnexal cysts ≤ 5 cm were “so common in postmenopausal women that their presence may be regarded as normal [31].” Furthermore, there is a growing understanding that the most common type of epithelial ovarian cancer, serous cystadenocarcinomas, arises from lesions in the distal fallopian tubes and not from the ovary [32].
Reporting and Follow-Up
With the high prevalence of simple ovarian cysts in both pre- and postmenopausal women and low accompanying risk of malignancy, it is important to offer accurate diagnoses and appropriate follow-up recommendations when indicated to reduce overtreatment and potential harm. Over-utilization of imaging follow-up can lead to increased patient anxiety, detection of incidental lesions, and increased surgical intervention [••28]. Surgery for benign adnexal lesions has been shown to result in complications in 8–15% of patients in screening trials [33].
The SRU 2019 consensus statement recommends the following documentation and follow-up of ovarian cysts for patients of average risk [••28]:
-
Postmenopausal: ≤ 1 cm is normal, > 1 cm to ≤ 3 cm (≤ 5 cm for superior visualization) is described to document with no follow-up, > 3 cm (> 5 cm for superior visualization) needs follow-up
-
Premenopausal: ≤ 3 cm is normal, > 3 cm to ≤ 5 cm (≤ 7 cm for superior visualization) is described to document with no follow-up, > 5 cm (> 7 cm for superior visualization) needs follow-up
-
Follow-up imaging timing:
-
Initial: 2–6 months for early determination or better characterization, 6–12 months otherwise
-
Additional follow-up: annual for total of 2 years
-
-
Follow-up outcomes:
-
Decrease (> 10–15% average linear dimension) or stable in size, no further follow-up (benign or non-neoplastic)
-
Increase (> 10–15% largest diameter) in size, likely benign enlarging neoplasm, clinical management
-
New features which are not simple warrant characterization (O-RADS below) and gynecology–oncology consult as appropriate
-
Ovarian-Adnexal Reporting and Data System (O-RADS)
It is important to have standardized descriptors and consistent reporting for accurate diagnosis of ovarian masses and to optimize patient outcomes. Several algorithms have been proposed for the evaluation and risk stratification of ovarian masses. The International Ovarian Tumor Analysis (IOTA) group consensus opinion in 2000 developed definitions and measurement procedures for intended use in ovarian mass research studies [34]. This led to the development of ten “simple rules” to classify benign and malignant ovarian masses [35]. These rules were assessed in a prospective trial including 1938 women with adnexal masses and yielded conclusive results in 77% of cases (sensitivity 92%, specificity 96%); however, inconclusive results needed further evaluation such as by an expert ultrasound examiner [36]. This was further developed in a prospective cohort study that assessed use of the IOTA-ADNEX model incorporating three clinical and six ultrasound predictors developed using 3506 patients and validated on 2403 patients. This model resulted in an area under the receiver operating characteristic curve of 0.94 to distinguish benign from malignant tumors [37]; while this model has been utilized in Europe, adoption in the United States and Canada has been limited [••38], possibly related to the countries of origin and complexity of application. In 2008, Gynecologic Imaging Reporting and Data System was developed and applied to 187 adnexal masses with 92% sensitivity and 97% specificity [39]. The 2010 Society of Radiologists in Ultrasound Consensus Statement also gave ovarian mass characterization and management guidelines [40]. These latter two systems, however, are not inclusive of all lesions.
Many ovarian mass classification and management systems have been developed but suffered from lack of universal adoption or management of lesions of all risk categories. To address these shortcomings, the American College of Radiology developed the Ovarian-Adnexal Reporting and Data System (O-RADS) US lexicon in 2018 and risk stratification and management system in 2020 applicable for the average risk patient. The following is a summary of O-RADS, with full details found in the original comprehensive publications [••38, ••41].
O-RADS Lexicon
There are six categories of ovarian masses in the O-RADS lexicon [••38, ••41]:
-
1.
Major categories:
-
a.
Physiologic: premenopausal follicle, corpus luteum
-
b.
Lesion (not physiologic): unilocular, no solid component; unilocular with solid component; multilocular cyst, no solid component; multilocular cyst with solid component; solid or solid-appearing (≥ 80%).
-
a.
-
2.
Size: maximum diameter in any plane
-
3.
Solid or solid-appearing lesions:
-
a.
External contour: smooth/irregular (lobulated is irregular)
-
b.
Internal contents: acoustic shadowing
-
a.
-
4.
Cystic lesions:
-
a.
Inner margin or walls including solid component: papillary projection or nodule (≥ 3 mm), smooth, irregular, anechoic, hyperechoic
-
a.
-
5.
Vascularity: color score (CS) (1 = no flow, 2 = minimal flow, 3 = moderate flow, 4 = very strong flow)
-
6.
General and extra-ovarian findings: benign findings (paraovarian cyst, peritoneal inclusion cyst, fallopian tube), cul-de-sac fluid, ascites, peritoneal thickening, or nodules
O-RADS Benign Lesions
O-RADS provides descriptors and management for a number of classic benign entities. A corpus luteum is characterized by an anechoic center with a smooth, thick soft tissue rim, and peripheral vascularity (Fig. 5), but may also have an irregular wall or central hemorrhage. Corpora lutea are normal physiologic structures that do not require follow-up [••38]. Paraovarian and paratubal simple cysts are separate from the adnexa and originate from the Wolffian or Mullerian ducts or peritoneal mesothelial lining (Fig. 6) [••28]. Several studies have shown that simple paraovarian and paratubal simple cysts have a very low chance of malignancy [42, 43], and optional 1-year follow-up imaging may be considered for postmenopausal women [••38]. A peritoneal inclusion cyst may have septations, follows the contour of adjacent structures, does not have mass effect, and contains the suspended ovary. A hydrosalpinx is tubular, has incomplete septations, and demonstrates endosalpingeal folds (Fig. 7). Both the peritoneal inclusion cyst and hydrosalpinx are managed by gynecologists without follow-up imaging required [••38]. A classic hemorrhagic cyst has a reticular pattern or retracting clot characterized by angular, concave, or straight margins (Fig. 8). In the premenopausal state, a hemorrhagic cyst ≤ 5 cm does not require follow-up, but one > 5 cm to < 10 cm should have an 8–12-week follow-up with referral to an US specialist, gynecologist, or MRI for persistence or enlargement; in the postmenopausal state, detection of a hemorrhagic cyst also necessitates referral [••38]. Of note, an US specialist is often referred to but not defined by O-RADS, a potential weakness of the system. A typical dermoid may be characterized by echogenic shadowing components, echogenic lines and dots, and floating echogenic spherical contents (Fig. 9). A typical endometrioma has homogeneous low-level internal echoes (Fig. 10). Both dermoids and endometriomas in the premenopausal state may be evaluated by an optional 8–12-week follow-up based on confidence of diagnosis, annual US surveillance if not surgically removed, and referral to an US specialist or MRI for concerning findings (enlargement, changing morphology, new vascular component). In the postmenopausal state, evaluation by an US specialist, gynecologist, or MRI is first recommended, with annual US follow-up if not removed surgically, and MRI follow-up for concerning findings [••38].

Corpus Luteum. Ultrasound image shows a thick-walled cystic structure in the ovary with peripheral vascularity and no internal blood flow on power Doppler images, compatible with a physiologic corpus luteum

Paraovarian simple cyst. Ultrasound image of the adnexa shows a paraovarian simple cyst, which is separate from the ovary (“O”). It does not have internal color Doppler flow (not shown)

Hydrosalpinx. Ultrasound image of the adnexa shows an anechoic tubular structure (“H”) with endosalpingeal folds (white arrow) separate from the ovary (“O”) compatible with a hydrosalpinx

Hemorrhagic Cyst. Ultrasound image of a hemorrhagic cyst shows retractile clot with angular and concave margins and internal reticular pattern

Dermoid. Ultrasound image of a dermoid shows an echogenic shadowing component (“*”) and echogenic lines and dots (white arrow)

Endometrioma. Ultrasound image of a typical endometrioma with homogeneous low-level internal echoes. No internal Doppler flow is present (not shown)
O-RADS Risk Classification and Management
There are six O-RADS risk categories [••38]:
-
O-RADS 0: incomplete evaluation
-
Requires a repeat or different study
-
-
O-RADS 1: normal ovary
-
No follow-up
-
-
O-RADS 2: almost certainly benign (< 1% risk)
-
Simple cysts < 10 cm, see simple ovarian cysts section
-
Benign lesions, see O-RADS benign lesions section
-
Non-simple unilocular cyst with smooth inner margin
-
≤ 3 cm: In the postmenopausal state, perform 1-year follow-up, with consideration for MRI or US specialist if concerning.
-
> 3 cm to < 10 cm: In the premenopausal state, perform 8–12-week follow-up and/or US specialist. In the postmenopausal state, refer to US specialist or MRI.
-
-
-
O-RADS 3: low risk (1–< 10%) (Fig. 11)
-
Evaluation by an US specialist or MRI, and managed by a gynecologist
-
Dermoid cysts, endometriomas, or hemorrhagic cysts ≥ 10 cm
-
Unilocular cyst: ≥ 10 cm or with irregular inner wall < 3 mm height
-
Multilocular cyst < 10 cm, smoother inner wall, CS 1–3
-
Solid: smooth, CS 1
Fig. 11 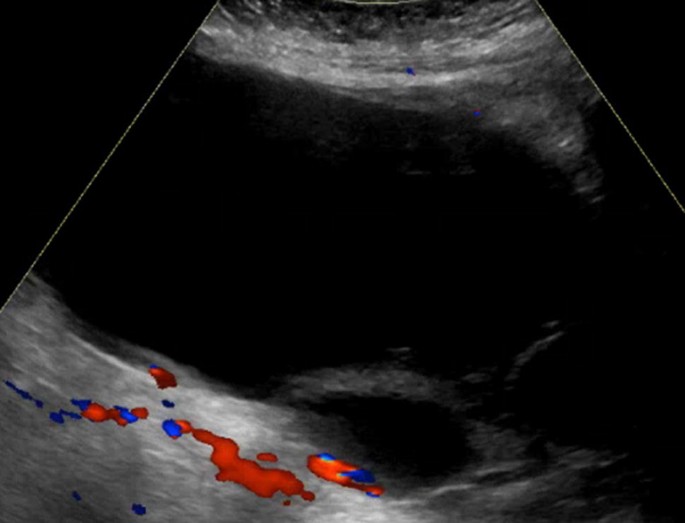
O-RADS 3. Ultrasound image shows a multilocular cyst measuring 18.0 cm with smooth inner walls, no solid component, and no internal color Doppler flow. This was a serous cystadenofibroma by pathology
-

-
O-RADS 4: intermediate risk (10–< 50%) (Fig. 12)
-
Evaluation by an US specialist or MRI, and managed by a gynecologist and/or gynecologist-oncologist
-
Unilocular cyst: 0–3 papillary projections, any CS
-
Multilocular cyst:
-
No solid component: ≥ 10 cm, CS 1–3; CS 4; irregular inner wall or septation, any CS
-
Solid component: CS 1–2
-
-
Solid: smooth, CS 2–3
Fig. 12 
O-RADS 4. Ultrasound image shows a multilocular cyst measuring 8.3 cm with single 1.5 cm solid component with internal Doppler blood flow. Pathology showed endometriosis with a paratubal cyst, but no malignancy
-

-
O-RADS 5: high risk (≥ 50%) (Fig. 13)
-
Management by gynecologist–oncologist
-
Unilocular cyst: ≥ 4 papillary projections, CS any
-
Multilocular cyst: solid component, CS 3–4
-
Solid: smooth, CS 4; irregular, CS any
-
Ascites ± peritoneal nodules
-

O-RADS 5. Ultrasound image shows a multilocular cyst measuring 11.1 cm with extensive solid components and color Doppler flow. Pathology showed a high-grade serous carcinoma
Polycystic Ovarian Syndrome
Polycystic ovary syndrome (PCOS) was originally described and given the eponym “Stein–Leventhal syndrome” in 1935 when the authors identified an association among dysmenorrhea, hirsutism, and polycystic ovaries [44]. Over the years, there have been a number of papers that have incorporated evolving research and provided diagnostic and treatment guidelines for clinicians. The guidelines reviewed here include the 1990 NIH Consensus Guidelines, the 2003 European Society of Human Reproduction and Embryology and the American Society for Reproductive Medicine Guidelines (also known as the Rotterdam criteria), the 2009 Androgen Excess and PCOS Society guidelines, the 2012 NIH acceptance of Rotterdam 2003 and most recently the 2018 International Evidence-based Guideline for the Assessment and Management of PCOS [44,45,46,47].
Polycystic, technically polyfollicular, ovaries have been associated with PCOS since the syndrome’s first description in 1935; however, polycystic ovarian morphology (PCOM) was only added as a diagnostic criterion in 2003. The subsequent guidelines for diagnosing PCOS have not significantly differed from the original Rotterdam criteria; however, the role of imaging and specific imaging criteria of PCOM has changed over the years. The Rotterdam consensus defined PCOS as meeting two out of the three following diagnostic criteria: (1) ovulatory dysfunction (oligo- or amenorrhea), (2) clinical and/or biochemical hyperandrogenism, and (3) polycystic ovaries on ultrasound [46].
PCOS Clinical Context
Prevalence
PCOS is estimated to affect approximately 7–13% of the global population, and up to 70% of affected women may be undiagnosed [47,48,49,50,51,52]. PCOS can be difficult to diagnose given its phenotypic variability. The Rotterdam criteria address these variable presentations by requiring that patients meet only two out of three diagnostic criteria, thereby creating 4 PCOS phenotypes [46]. PCOS is important to diagnose given its associated health risks, medical implications, and impact on quality of life.
Pathophysiology
Hyperandrogenism and hyperinsulinism are implicated in the pathogenesis of many PCOS features and associated medical conditions [53]. PCOM results from androgen related inhibition of follicle development and failure to select a dominant follicle. Antral follicles measuring 2–9 mm accumulate resulting in the classic PCOM [54]. Hyperandrogenism is in part due to an impaired hypothalamic–pituitary–gonadal axis. Increased LH compared to FSH results in increased gonadotrophin-releasing hormone, which causes ovarian theca cells to overproduce and secrete androgens [46]. Insulin works synergistically with LH to secrete androgens from the ovary, as well as inhibiting the hepatic synthesis of sex hormone binding globulin, which ultimately leads to increased circulating unbound testosterone [54,55,56,57].
Medical Implications
Short-term and long-term health implications include increased risk of metabolic syndrome, increased atherosclerotic burden for age, cardiovascular complications, endometrial hyperplasia and carcinoma, infertility, and pregnancy complications [51, 58,59,60,61,62,63,64]. Approximately 30–70% of women with PCOS are obese (BMI > 30 kg/m2) with a mean BMI in United States of 35–38 kg/m2 [65]. Increased BMI likely exacerbates the clinical features of PCOS including hyperinsulinemia [53]. Endometrial hyperplasia and carcinoma are caused by unopposed estrogen and absent progesterone-induced endometrial inhibition and differentiation [60, 66]. PCOS is associated with infertility due to anovulation, and PCOM even in the absence of PCOS places patient at risk for ovarian hyperstimulation while undergoing assisted reproductive technology/ovulation induction [67].
PCOS Diagnostic Work-Up
Diagnostic work-up for PCOS includes testing for biochemical hyperandrogenism. Recommended blood tests include free testosterone, calculated bioavailable testosterone, and free androgen index. Anti-Mullerian hormone is typically elevated with PCOS; however, currently there is not enough evidence to recommend standardized use [••45]. The diagnosis of PCOS should exclude other medical conditions including thyroid dysfunction, hyperprolactinemia, Cushing disease, androgen secreting tumor, and non-classical congenital adrenal hyperplasia [68].
Role of Imaging
Since PCOM was added as a diagnostic criterion for PCOS in 2003, the specific imaging criteria for PCOM has been continually updated reflecting advancements in imaging and attempts to find a balance between sensitivity and specificity of follicular thresholds. PCOM alone is not enough to diagnose PCOS as approximately 23% of reproductive age women will have polycystic ovaries on ultrasound, while only 5–10% of women will have clinical features of PCOS [69, 70].
Current Guidelines
The 2018 international consensus guidelines state that PCOM is defined as follicle number per ovary (FNPO) > 20 and/or ovarian volume ≥ 10 mL in the absence of corpora lutea, cysts, or dominant follicles [••45] (Fig. 14). PCOM can be diagnosed if either ovary meets diagnostic criteria. Other features of PCOM that are often present but not required for diagnosis include central hyperechoic stroma, uniform size of follicles ranging from 2 to 9 mm, and peripheral follicles, often referred to as a “string of pearls” [••45].

Polycystic Ovarian Syndrome. Ultrasound images of a 30-year-old women with secondary amenorrhea show polycystic ovarian morphology of her left (“LT”) and right (“RT”) ovaries, with hyperechoic ovarian stroma, subcentimeter peripheral follicles, and enlarged ovarian volumes of 12.3 mL on the left and 12.5 mL on the right
Changes from Prior Guidelines
The Rotterdam consensus (2003) defined PCOM as FNPO ≥ 12 with follicles measuring 2–9 mm and ovarian volume > 10 mL [46]. The Rotterdam consensus was a paradigm shift from prior literature that defined PCOM based on size and number of follicles within a single ultrasound plane (follicle number per section, FNPS). Prior to the Rotterdam consensus, PCOM was defined as FNPS > 10, with follicles located peripherally around central echogenic stroma [71].
The 2018 guidelines use a higher FNPO threshold compared to 2009 guidelines and a lower FNPO threshold compared to the 2013 guidelines: 20, 12, and 26, respectively. The 2013 guideline attempted to increase specificity of PCOM taking into account advanced ultrasound technology and the ability to use a grid system to count follicles; however, the FNPO of 26 was only 85% sensitive, while being 94% specific [72, 73].
Threshold ovarian volume of ≥ 10 mL has remained the same since the 2003 Rotterdam consensus; however, some studies suggest implementing a higher threshold to increase the specificity [54, 74, 75].
Ultrasound Specifics
The 2018 consensus recommends using a high-frequency 8 MHz transducer and obtaining TVS when possible. If using older technology or only the transabdominal approach, ovarian volume is the most reliable predictor of PCOM, as FNPO is not typically accurate [••45]. The minimum reporting standard suggested includes last menstrual period, transducer frequency, approach, FNPO measuring 2-9 mm, 3 dimensions and volume of each ovary, endometrial thickness and appearance, and other uterine or ovarian pathologies including cysts, corpora lutea, and dominant follicles ≥ 10 mm [••45].
Calculation of ovarian volume is not discussed in the 2018 guidelines; however, prior radiology literature states that volume should be calculated by using a simplified formula for an ellipsoid (0.5 × length × width × thickness of ovary) [74, 76,77,78].
Special Circumstances
The 2018 guidelines address diagnosing PCOS in adolescents and postmenopausal women, which can be challenging due to changes in ovarian function and morphology. Adolescents typically have multi-follicular ovaries and postmenopausal patients are by definition no longer ovulating.
PCOS in adolescents should be based on clinical features of hyperandrogenism and/or ovulatory dysfunction instead of ultrasound. Adolescents are defined as females < 8 years post-menarche or < 20 years old if age of menarche is unknown [••45]. Postmenopausal patients can still be diagnosed with PCOS if dysmenorrhea, hyperandrogenism, and/or PCOM were present during the reproductive years. However, if a postmenopausal patient is experiencing acute onset or worsening hyperandrogenism, androgen secreting tumors and ovarian hyperthecosis should be excluded [••45].
PCOM can be diagnosed on MRI even though it is not typically a first-line screening tool. The same criteria of > 20 FNPO and/or ovarian volume ≥ 10 can be applied to MRI. The follicles are T2 hyperintense and the ovarian stroma is intermediate in T1 signal intensity compared to myometrium [••45].
PCOS Future
Due to the evolving criteria for diagnosing PCOM, some radiologists have found it easier to simply report FNPO rather than ascribing a diagnosis of PCOM. Therefore, it is important to continually make revised criteria available in the radiology literature and for radiologists to be included in future consensus meetings. Radiologists will be required to ensure sonographers are educated on meticulous follicle counting, use of grid systems, and adequately calculating ovarian volume.
As research and technologic innovations continue to advance, there will likely be a continuing revision of threshold FNPO for diagnosing PCOM and possibly determination of age-specific follicle and ovarian volume thresholds. With increased use of assisted reproductive technology, there may also be a need for ultrasound monitoring when using gonadotrophins. Follicle counting may also be an area with artificial intelligence algorithms can be implemented in the future.
Conclusions
There have been many recent advancements in understanding and management of gynecologic disease and use of ultrasound imaging. Assessment of the endometrium for potential cancer relies heavily on measures of endometrial thickness, of which the accepted cut-offs for suspicion vary greatly by menstrual state and presence of symptoms. Simple ovarian cysts are now known to be widely prevalent with low likelihood of malignancy in the average risk population, with a realization that the most common form of ovarian cancer originates from the fallopian tube [32]. There has been concordant revision to follow-up and treatment guidelines for simple ovarian cysts [••28]. The recently proposed Ovarian-Adnexal Reporting and Data System provides consistent terminology and management guidelines for additional ovarian masses [••38, ••41]. PCOS imaging criteria have been updated a number of times to balance the sensitivity and specificity of diagnosis. We hope this review of recent guideline updates will aid radiologists in accurate diagnosis and management of gynecologic diseases.
References
Papers of particular interest, published recently, have been highlighted as: •• Of major importance
Siegel RL, Miller KD, Jemal A. Cancer statistics, 2016. CA Cancer J Clin. 2016;66(1):7–30.
Rizzo S, Femia M, Buscarino V, Franchi D, Garbi A, Zanagnolo V, et al. Endometrial cancer: an overview of novelties in treatment and related imaging keypoints for local staging. Cancer Imaging. 2018;18(1):45.
Jacobs I, Gentry-Maharaj A, Burnell M, Manchanda R, Singh N, Sharma A, et al. Sensitivity of transvaginal ultrasound screening for endometrial cancer in postmenopausal women: a case-control study within the UKCTOCS cohort. Lancet Oncol. 2011;12(1):38–48.
••ACOG Committee Opinion No. 734: The role of transvaginal ultrasonography in evaluating the endometrium of women with postmenopausal bleeding. Obstet Gynecol. 2018;131(5):e124–e9. Guidelines for endometrial stripe ultrasound evaluation.
Monis CN, Tetrokalashvili M. Menstrual cycle proliferative and follicular phase. StatPearls. Treasure Island (FL): StatPearls Publishing LLC; 2000.
Reed BG, Carr BR. The normal menstrual cycle and the control of ovulation. In: Feingold KR, Anawalt B, Boyce A, Chrousos G, Dungan K, Grossman A, et al., editors. Endotext. South Dartmouth (MA): MDText.com Inc; 2000.
Tsuda H, Ito YM, Todo Y, Iba T, Tasaka K, Sutou Y, et al. Measurement of endometrial thickness in premenopausal women in office gynecology. Reprod Med Biol. 2018;17(1):29–35.
Kim MJ, Kim JJ, Kim SM. Endometrial evaluation with transvaginal ultrasonography for the screening of endometrial hyperplasia or cancer in premenopausal and perimenopausal women. Obstet Gynecol Sci. 2016;59(3):192–200.
Kim HS, Jeon YT, Kim YB. The effect of adjuvant hormonal therapy on the endometrium and ovary of breast cancer patients. J Gynecol Oncol. 2008;19(4):256–60.
Dreisler E, Sorensen SS, Ibsen PH, Lose G. Value of endometrial thickness measurement for diagnosing focal intrauterine pathology in women without abnormal uterine bleeding. Ultrasound Obstet Gynecol. 2009;33(3):344–8.
Munro MG, Critchley HO, Broder MS, Fraser IS. FIGO classification system (PALM-COEIN) for causes of abnormal uterine bleeding in nongravid women of reproductive age. Int J Gynaecol Obstet. 2011;113(1):3–13.
Epstein E, Fischerova D, Valentin L, Testa AC, Franchi D, Sladkevicius P, et al. Ultrasound characteristics of endometrial cancer as defined by International Endometrial Tumor Analysis (IETA) consensus nomenclature: prospective multicenter study. Ultrasound Obstet Gynecol. 2018;51(6):818–28.
Hefler L, Lafleur J, Kickmaier S, Leipold H, Siebenhofer C, Tringler B, et al. Risk of endometrial cancer in asymptomatic postmenopausal patients with thickened endometrium: data from the FAME-Endo study: an observational register study. Arch Gynecol Obstet. 2018;298(4):813–20.
Smith-Bindman R, Kerlikowske K, Feldstein VA, Subak L, Scheidler J, Segal M, et al. Endovaginal ultrasound to exclude endometrial cancer and other endometrial abnormalities. JAMA. 1998;280(17):1510–7.
Timmermans A, Opmeer BC, Khan KS, Bachmann LM, Epstein E, Clark TJ, et al. Endometrial thickness measurement for detecting endometrial cancer in women with postmenopausal bleeding: a systematic review and meta-analysis. Obstet Gynecol. 2010;116(1):160–7.
Schramm A, Ebner F, Bauer E, Janni W, Friebe-Hoffmann U, Pellegrino M, et al. Value of endometrial thickness assessed by transvaginal ultrasound for the prediction of endometrial cancer in patients with postmenopausal bleeding. Arch Gynecol Obstet. 2017;296(2):319–26.
Long B, Clarke MA, Morillo ADM, Wentzensen N, Bakkum-Gamez JN. Ultrasound detection of endometrial cancer in women with postmenopausal bleeding: systematic review and meta-analysis. Gynecol Oncol. 2020. https://doi.org/10.1016/j.ygyno.2020.01.032.
Goldstein RB, Bree RL, Benson CB, Benacerraf BR, Bloss JD, Carlos R, et al. Evaluation of the woman with postmenopausal bleeding: society of radiologists in ultrasound-sponsored consensus conference statement. J Ultrasound Med. 2001;20(10):1025–36.
Dueholm M, Hjorth IMD, Dahl K, Hansen ES, Ortoft G. Ultrasound scoring of endometrial pattern for fast-track identification or exclusion of endometrial cancer in women with postmenopausal bleeding. J Minim Invasive Gynecol. 2019;26(3):516–25.
Smith-Bindman R, Weiss E, Feldstein V. How thick is too thick? When endometrial thickness should prompt biopsy in postmenopausal women without vaginal bleeding. Ultrasound Obstet Gynecol. 2004;24(5):558–65.
Alcazar JL, Bonilla L, Marucco J, Padilla AI, Chacon E, Manzour N, et al. Risk of endometrial cancer and endometrial hyperplasia with atypia in asymptomatic postmenopausal women with endometrial thickness >/=11 mm: a systematic review and meta-analysis. J Clin Ultrasound. 2018;46(9):565–70.
El-Sharkawy M, El-Mazny A, Ramadan W, Hatem D, Abdel-Hafiz A, Hammam M, et al. Three-dimensional ultrasonography and power Doppler for discrimination between benign and malignant endometrium in premenopausal women with abnormal uterine bleeding. BMC Women's Health. 2016;16:18.
Lee S, Kim YH, Kim SC, Joo JK, Seo DS, Kim KH, et al. The effect of tamoxifen therapy on the endometrium and ovarian cyst formation in patients with breast cancer. Obstet Gynecol Sci. 2018;61(5):615–20.
Fong K, Kung R, Lytwyn A, Trudeau M, Chapman W, Nugent P, et al. Endometrial evaluation with transvaginal US and hysterosonography in asymptomatic postmenopausal women with breast cancer receiving tamoxifen. Radiology. 2001;220(3):765–73.
Neven P, Vergote I. Should tamoxifen users be screened for endometrial lesions? Lancet (London, England). 1998;351(9097):155–7.
Gerber B, Krause A, Muller H, Reimer T, Kulz T, Makovitzky J, et al. Effects of adjuvant tamoxifen on the endometrium in postmenopausal women with breast cancer: a prospective long-term study using transvaginal ultrasound. J Clin Oncol. 2000;18(20):3464–70.
Neven P, Froyman W, Timmerman S, Timmerman D. Uterine ultrasound and endometrial biopsy in tamoxifen users. Breast Cancer Res Treat. 2020;180(3):833–4.
••Levine D, Patel MD, Suh-Burgmann EJ, Andreotti RF, Benacerraf BR, Benson CB, et al. Simple adnexal cysts: SRU consensus conference update on follow-up and reporting. Radiology. 2019;293(2):359–71. Simple ovarian cyst guidelines.
Smith-Bindman R, Poder L, Johnson E, Miglioretti DL. Risk of malignant ovarian cancer based on ultrasonography findings in a large unselected population. JAMA Intern Med. 2019;179(1):71–7.
Greenlee RT, Kessel B, Williams CR, Riley TL, Ragard LR, Hartge P, et al. Prevalence, incidence, and natural history of simple ovarian cysts among women >55 years old in a large cancer screening trial. Am J Obstet Gynecol. 2010;202(4):373.e1–9.
Valentin L, Skoog L, Epstein E. Frequency and type of adnexal lesions in autopsy material from postmenopausal women: ultrasound study with histological correlation. Ultrasound Obstet Gynecol. 2003;22(3):284–9.
Erickson BK, Conner MG, Landen CN Jr. The role of the fallopian tube in the origin of ovarian cancer. Am J Obstet Gynecol. 2013;209(5):409–14.
Baldwin LA, Pavlik EJ, Ueland E, Brown HE, Ladd KM, Huang B, et al. Complications from surgeries related to ovarian cancer screening. Diagnostics (Basel, Switzerland). 2017;7(1):16.
Timmerman D, Valentin L, Bourne TH, Collins WP, Verrelst H, Vergote I. Terms, definitions and measurements to describe the sonographic features of adnexal tumors: a consensus opinion from the International Ovarian Tumor Analysis (IOTA) Group. Ultrasound Obstet Gynecol. 2000;16(5):500–5.
Timmerman D, Testa AC, Bourne T, Ameye L, Jurkovic D, Van Holsbeke C, et al. Simple ultrasound-based rules for the diagnosis of ovarian cancer. Ultrasound Obstet Gynecol. 2008;31(6):681–90.
Timmerman D, Ameye L, Fischerova D, Epstein E, Melis GB, Guerriero S, et al. Simple ultrasound rules to distinguish between benign and malignant adnexal masses before surgery: prospective validation by IOTA group. BMJ (Clinical research ed). 2010;341:c6839.
Van Calster B, Van Hoorde K, Valentin L, Testa AC, Fischerova D, Van Holsbeke C, et al. Evaluating the risk of ovarian cancer before surgery using the ADNEX model to differentiate between benign, borderline, early and advanced stage invasive, and secondary metastatic tumours: prospective multicentre diagnostic study. BMJ (Clinical research ed). 2014;349:g5920.
••Andreotti RF, Timmerman D, Strachowski LM, Froyman W, Benacerraf BR, Bennett GL, et al. O-RADS US risk stratification and management system: a consensus guideline from the ACR Ovarian-Adnexal Reporting and Data System Committee. Radiology. 2020;294(1):168–85. O-RADS risk stratification and management.
Amor F, Vaccaro H, Alcazar JL, Leon M, Craig JM, Martinez J. Gynecologic imaging reporting and data system: a new proposal for classifying adnexal masses on the basis of sonographic findings. J Ultrasound. 2009;28(3):285–91.
Levine D, Brown DL, Andreotti RF, Benacerraf B, Benson CB, Brewster WR, et al. Management of asymptomatic ovarian and other adnexal cysts imaged at US Society of Radiologists in Ultrasound consensus conference statement. Ultrasound Quart. 2010;26(3):121–31.
••Andreotti RF, Timmerman D, Benacerraf BR, Bennett GL, Bourne T, Brown DL, et al. Ovarian-adnexal reporting lexicon for ultrasound: a white paper of the ACR ovarian-adnexal reporting and data system committee. J Am Coll Radiol. 2018;15(10):1415–29. O-RADS lexicon.
Savelli L, Ghi T, De Iaco P, Ceccaroni M, Venturoli S, Cacciatore B. Paraovarian/paratubal cysts: comparison of transvaginal sonographic and pathological findings to establish diagnostic criteria. Ultrasound Obstet Gynecol. 2006;28(3):330–4.
Sharma A, Gentry-Maharaj A, Burnell M, Fourkala EO, Campbell S, Amso N, et al. Assessing the malignant potential of ovarian inclusion cysts in postmenopausal women within the UK Collaborative Trial of Ovarian Cancer Screening (UKCTOCS): a prospective cohort study. BJOG. 2012;119(2):207–19.
Stein IF, Leventhal ML. Amenorrhea associated with bilateral polycystic ovaries. Am J Obstet Gynecol. 1935;29(2):181–91.
••Teede HJ, Misso ML, Costello MF, Dokras A, Laven J, Moran L, et al. Recommendations from the international evidence-based guideline for the assessment and management of polycystic ovary syndrome. Hum Reprod (Oxford, England). 2018;33(9):1602–18. PCOS guidelines.
Rotterdam ESHRE/ASRM-Sponsored PCOS Consensus Workshop Group. Revised 2003 consensus on diagnostic criteria and long-term health risks related to polycystic ovary syndrome. Fertil Steril. 2004;81(1):19–25.
Azziz R, Carmina E, Dewailly D, Diamanti-Kandarakis E, Escobar-Morreale HF, Futterweit W, et al. Positions statement: criteria for defining polycystic ovary syndrome as a predominantly hyperandrogenic syndrome: an Androgen Excess Society guideline. J Clin Endocrinol Metab. 2006;91(11):4237–45.
Diamanti-Kandarakis E, Kandarakis H, Legro RS. The role of genes and environment in the etiology of PCOS. Endocrine. 2006;30(1):19–26.
March WA, Moore VM, Willson KJ, Phillips DI, Norman RJ, Davies MJ. The prevalence of polycystic ovary syndrome in a community sample assessed under contrasting diagnostic criteria. Hum Reprod (Oxford, England). 2010;25(2):544–51.
Bozdag G, Mumusoglu S, Zengin D, Karabulut E, Yildiz BO. The prevalence and phenotypic features of polycystic ovary syndrome: a systematic review and meta-analysis. Hum Reprod (Oxford, England). 2016;31(12):2841–55.
Boomsma CM, Eijkemans MJ, Hughes EG, Visser GH, Fauser BC, Macklon NS. A meta-analysis of pregnancy outcomes in women with polycystic ovary syndrome. Hum Reprod Update. 2006;12(6):673–83.
Azziz R, Woods KS, Reyna R, Key TJ, Knochenhauer ES, Yildiz BO. The prevalence and features of the polycystic ovary syndrome in an unselected population. J Clin Endocrinol Metab. 2004;89(6):2745–9.
Dunaif A. Insulin resistance and the polycystic ovary syndrome: mechanism and implications for pathogenesis. Endocr Rev. 1997;18(6):774–800.
Franks S, Stark J, Hardy K. Follicle dynamics and anovulation in polycystic ovary syndrome. Hum Reprod Update. 2008;14(4):367–78.
Nestler JE, Powers LP, Matt DW, Steingold KA, Plymate SR, Rittmaster RS, et al. A direct effect of hyperinsulinemia on serum sex hormone-binding globulin levels in obese women with the polycystic ovary syndrome. J Clin Endocrinol Metab. 1991;72(1):83–9.
Barbieri RL, Makris A, Randall RW, Daniels G, Kistner RW, Ryan KJ. Insulin stimulates androgen accumulation in incubations of ovarian stroma obtained from women with hyperandrogenism. J Clin Endocrinol Metab. 1986;62(5):904–10.
Nestler JE, Jakubowicz DJ, de Vargas AF, Brik C, Quintero N, Medina F. Insulin stimulates testosterone biosynthesis by human thecal cells from women with polycystic ovary syndrome by activating its own receptor and using inositolglycan mediators as the signal transduction system. J Clin Endocrinol Metab. 1998;83(6):2001–5.
Talbott EO, Guzick DS, Sutton-Tyrrell K, McHugh-Pemu KP, Zborowski JV, Remsberg KE, et al. Evidence for association between polycystic ovary syndrome and premature carotid atherosclerosis in middle-aged women. Arterioscler Thromb Vasc Biol. 2000;20(11):2414–21.
Dokras A, Bochner M, Hollinrake E, Markham S, Vanvoorhis B, Jagasia DH. Screening women with polycystic ovary syndrome for metabolic syndrome. Obstet Gynecol. 2005;106(1):131–7.
Navaratnarajah R, Pillay OC, Hardiman P. Polycystic ovary syndrome and endometrial cancer. Semin Reprod Med. 2008;26(1):62–71.
Balen A. Polycystic ovary syndrome and cancer. Hum Reprod Update. 2001;7(6):522–5.
Giudice LC. Endometrium in PCOS: implantation and predisposition to endocrine CA. Best Pract Res Clin Endocrinol Metab. 2006;20(2):235–44.
Apridonidze T, Essah PA, Iuorno MJ, Nestler JE. Prevalence and characteristics of the metabolic syndrome in women with polycystic ovary syndrome. J Clin Endocrinol Metab. 2005;90(4):1929–35.
Legro RS, Kunselman AR, Dodson WC, Dunaif A. Prevalence and predictors of risk for type 2 diabetes mellitus and impaired glucose tolerance in polycystic ovary syndrome: a prospective, controlled study in 254 affected women. J Clin Endocrinol Metab. 1999;84(1):165–9.
Azziz R, Ehrmann D, Legro RS, Whitcomb RW, Hanley R, Fereshetian AG, et al. Troglitazone improves ovulation and hirsutism in the polycystic ovary syndrome: a multicenter, double blind, placebo-controlled trial. J Clin Endocrinol Metab. 2001;86(4):1626–32.
Plymate SR, Jones RE, Matej LA, Friedl KE. Regulation of sex hormone binding globulin (SHBG) production in Hep G2 cells by insulin. Steroids. 1988;52(4):339–40.
Dewailly D, Lujan ME, Carmina E, Cedars MI, Laven J, Norman RJ, et al. Definition and significance of polycystic ovarian morphology: a task force report from the Androgen Excess and Polycystic Ovary Syndrome Society. Hum Reprod Update. 2014;20(3):334–52.
ACOG Practice Bulletin No. 108: polycystic ovary syndrome. Obstet Gynecol. 2009;114(4):936–49.
Polson DW, Adams J, Wadsworth J, Franks S. Polycystic ovaries—a common finding in normal women. Lancet (London, England). 1988;1(8590):870–2.
Lakhani K, Seifalian AM, Atiomo WU, Hardiman P. Polycystic ovaries. Br J Radiol. 2002;75(889):9–16.
Adams J, Franks S, Polson DW, Mason HD, Abdulwahid N, Tucker M, et al. Multifollicular ovaries: clinical and endocrine features and response to pulsatile gonadotropin releasing hormone. Lancet (London, England). 1985;2(8469–70):1375–9.
Azziz R, Carmina E, Dewailly D, Diamanti-Kandarakis E, Escobar-Morreale HF, Futterweit W, et al. The Androgen Excess and PCOS Society criteria for the polycystic ovary syndrome: the complete task force report. Fertil Steril. 2009;91(2):456–88.
Lujan ME, Jarrett BY, Brooks ED, Reines JK, Peppin AK, Muhn N, et al. Updated ultrasound criteria for polycystic ovary syndrome: reliable thresholds for elevated follicle population and ovarian volume. Hum Reprod (Oxford, England). 2013;28(5):1361–8.
Fulghesu AM, Ciampelli M, Belosi C, Apa R, Pavone V, Lanzone A. A new ultrasound criterion for the diagnosis of polycystic ovary syndrome: the ovarian stroma/total area ratio. Fertil Steril. 2001;76(2):326–31.
Pavlik EJ, DePriest PD, Gallion HH, Ueland FR, Reedy MB, Kryscio RJ, et al. Ovarian volume related to age. Gynecol Oncol. 2000;77(3):410–2.
Pache TD, Wladimiroff JW, Hop WC, Fauser BC. How to discriminate between normal and polycystic ovaries: transvaginal US study. Radiology. 1992;183(2):421–3.
Swanson M, Sauerbrei EE, Cooperberg PL. Medical implications of ultrasonically detected polycystic ovaries. J Clin Ultrasound. 1981;9(5):219–22.
Saxton DW, Farquhar CM, Rae T, Beard RW, Anderson MC, Wadsworth J. Accuracy of ultrasound measurements of female pelvic organs. Br J Obstet Gynaecol. 1990;97(8):695–9.
Author information
Authors and Affiliations
Corresponding author
Ethics declarations
Conflict of interest
The authors have no conflicts of interest to disclose regarding the material in this manuscript.
Research involving Human and Animal Rights
This article does not contain any studies with human or animal subjects performed by any of the authors.
Additional information
Publisher's Note
Springer Nature remains neutral with regard to jurisdictional claims in published maps and institutional affiliations.
This article is part of the Topical collection on Ultrasound.
Rights and permissions
About this article

Cite this article
Liau, J., Schultz, H. Recent Updates in Female Pelvic Ultrasound. Curr Radiol Rep 8, 10 (2020). https://doi.org/10.1007/s40134-020-00353-3
Published:
DOI: https://doi.org/10.1007/s40134-020-00353-3