
Abstract
Reduced abundance of non-native Tamarix shrubs in western U.S. riparian systems following biological control by a defoliating beetle has led to concerns that replacement plant communities could be dominated by other invasive species and/or not provide some of the ecosystem services that Tamarix was providing. In previous studies, Tamarix decline following biocontrol was accompanied by small increases in native and non-native herbaceous species, with variable responses of woody vegetation. However, none of these studies spanned periods longer than a decade since beetle release. This is an important caveat, given the cyclical nature of plant-herbivore interactions and potential lags in vegetation recovery. We report plant community response to an eight-year-long second cycle of Tamarix defoliation-refoliation in two reaches of the upper Colorado River in eastern Utah, 11–13 years after beetle arrival. Tamarix cover across sites initially declined an average of ca. 50% in response to the beetle, but then recovered. Changes in the associated plant community were small but supported common management goals, including a 47% average increase in cover of a native shrub (Salix exigua), and no secondary invasions by other non-native plants. We suggest that the effectiveness of biocontrol programs must be assessed case-by-case, and on a long-term basis.
Introduction
Riparian ecosystems provide important ecological functions and services to society, but these are jeopardized by human activities such as hydrological regulation, overexploitation of water resources, and floodplain occupation by agriculture, and urbanization (González et al. 2017a). One of the primary impacts of human activities in riparian zones has been the spread of invasive plants (Richardson et al. 2007), and controlling plant invasions is a central focus of riparian zone management worldwide (González et al. 2015). Along North American rivers, for example, managing invasive shrubs and small trees in the genus Tamarix (saltcedar, tamarisk) has been a priority of natural resources managers for decades (Bowser 1957; Shafroth and Briggs 2008; Stromberg et al. 2009; Douglass et al. 2013).
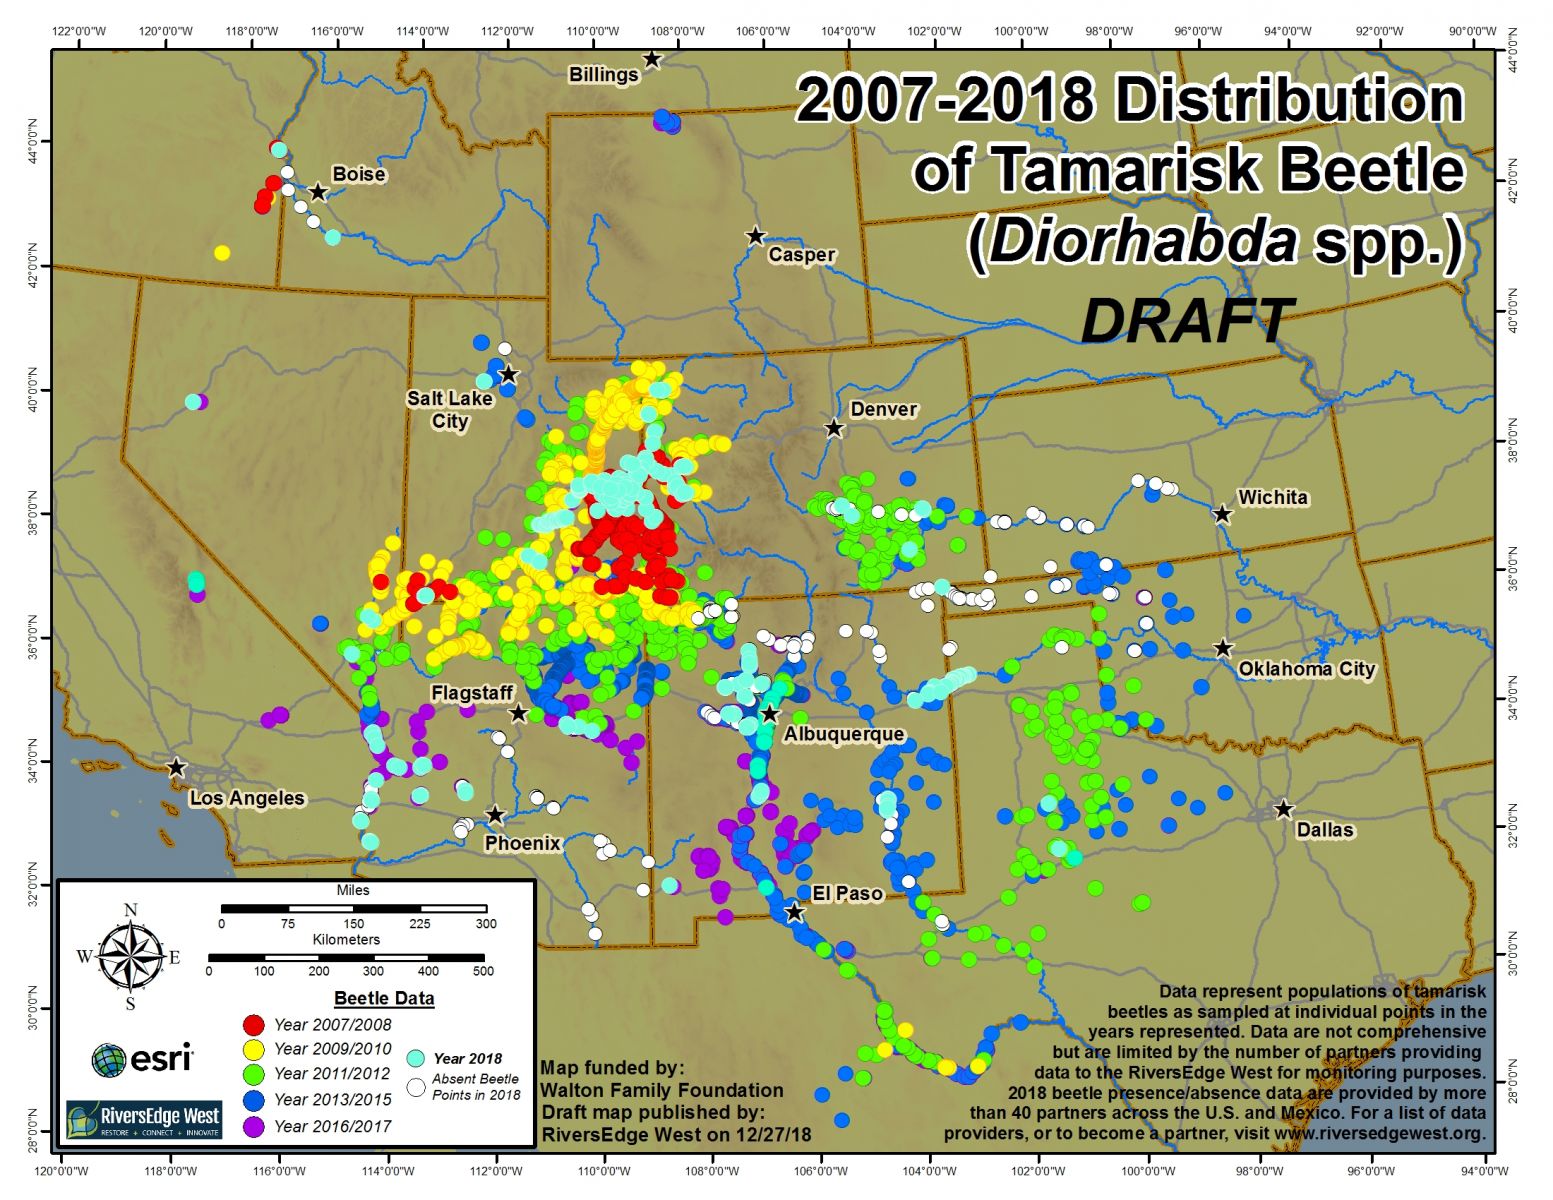
The low cost-effectiveness of mechanical and chemical Tamarix control methods, along with challenges applying them in remote areas, as well as negative ecological effects, has led to the development of a biological control program using host-specific, folivore beetles in the genus Diorhabda (DeLoach et al. 2003; Hultine et al. 2010; commonly referred to as the “Tamarix beetle”). Beetle adults and larvae feed on Tamarix leaves and petioles, causing repeated intra- and inter-annual cycles of defoliation and refoliation that, in turn, can cause the death of Tamarix plants through carbon starvation (Hudgeons et al. 2007; Bean et al. 2013). During the early 2000s, Diorhabda beetles were released in multiple locations across the southwestern U.S. Natural migration rates and extent soon exceeded expectations and, by 2017, the beetles had expanded across a region encompassing ca. two million km2 (RiversEdge West 2018), causing extensive defoliation, canopy dieback, and Tamarix mortality in many of the main watersheds of the region (e.g., Bateman et al. 2013; González et al. 2017b; Nagler et al. 2018; González et al. 2020).
The long-term outcome of biological control on riparian ecosystems dominated by Tamarix spp. is determined by Tamarix dieback and mortality, as well as by the type and functional attributes of the vegetation that occupies the space vacated by declining Tamarix. The response of the riparian community following dieback can include a range of possibilities, such as recovery and/or reestablishment of Tamarix, an increase in a variety of native and/or other non-native species, and a lack of vegetation response (i.e., dead Tamarix remains and other plants do not fill the space). Replacement vegetation can strongly influence key ecosystem functions and properties, such as provision of wildlife habitat (including for the endangered willow flycatcher (Paxton et al. 2011)), biodiversity, erosion control, nutrient and water cycling, flammability, and ecosystem services such as livestock use, recreation, and aesthetics enjoyment (e.g., Shafroth et al. 2008). Accordingly, understanding how riparian plant communities change with reduced Tamarix dominance is important for a wide range of stakeholders.
An improved understanding of the long-term patterns and drivers of plant community response in the face of Tamarix decline is needed. Changes to riparian vegetation following biocontrol-induced Tamarix decline thus far have been generally small and are not yet well-understood. Some research has documented slight increases in diversity, richness, and cover of native herbs, while recovery of a native woody vegetation layer dominated by cottonwoods and willows has been slower, patchy, and generally less certain (Kennard et al. 2016; González et al. 2017b, c; Sher et al. 2018; González et al. 2020). Secondary invasions of non-native herbs and forbs have occurred frequently, with considerable variability in their persistence (Kennard et al. 2016; González et al. 2017b, c, 2020). However, none of the abovementioned studies spanned more than eight years of monitoring or included observations beyond nine years since beetle arrival. It is possible that replacement vegetation needs more time to fully develop. Moreover, each study showed that the response of vegetation can have an important local component that should be addressed on a case-by-case basis. With few studies reporting the response of plant communities to biocontrol, little is known about the environmental factors that determine the replacement vegetation. For example, in a mostly unregulated river (the lower Virgin, AZ and NV), González et al. (2020) showed that fluvial processes (e.g., sediment erosion and deposition) may play an important role in explaining species composition following biocontrol. Variation in soil moisture and flood regime along topographic gradients is frequently the primary factor shaping riparian plant communities (Corenblit et al. 2009; McCoy-Sulentic et al. 2017; Janssen et al. 2019). Thus, an improved understanding of the drivers of plant community response and variation in the face of Tamarix decline would be of great value.
In this study we assessed plant community responses to Tamarix biocontrol in two reaches along the upper Colorado River in eastern Utah where beetles were released in 2004 and 2006. Beetle populations subsequently consolidated and have recurrently defoliated Tamarix (Nagler et al. 2018). To understand the responses of the riparian plant community to Tamarix dieback, we conducted five surveys between 2010 and 2017, during a second cycle of defoliation: in other words, after a first inter-annual cycle of Tamarix defoliation and regrowth was completed (Nagler et al. 2018). At the time of our last survey (2017), beetles had been in the area for 11–13 years, which is the longest time following beetle introduction yet reported in the literature. We hypothesized that Tamarix cover would decrease over time as a result of repeated beetle defoliation, and that native species cover would increase. We also expected that the plant communities replacing the declining Tamarix would differ along a topographic gradient from the uplands to the river water channel, as well as between the two study reaches.
Methods
Study Area
The Colorado River flows 2330 km from La Poudre Pass in the southern Rocky Mountains of Colorado to the Gulf of California in northwestern Mexico. The study area was included within a river segment located in the Colorado Plateau ecoregion in eastern Utah that extends 208 river km (rkm) from the Colorado/Utah border to the confluence with the Green River (Fig. 1). The climate is semi-arid and, in nearby Moab, UT, the mean daily temperature is 14 °C with a mean annual precipitation of 241 mm, including 152 mm as snow (U.S. Climate Data 2019). The main tributaries of the Colorado River in this segment are the Dolores and the Green rivers.

Location of the 10 study sites (A – J) in two distinct reaches (Cisco Wash and Gold Bar) of the Upper Colorado River in eastern Utah. The white dashes on the photograph of the river reaches indicate the upstream and downstream limit of each study site. Rkm = river kilometers, USGS = United States Geological Survey
At the gauging station “Colorado River near Cisco” (USGS gage #09180500), within the study segment, the drainage area of the river is 62,419 km2 and the average annual daily discharge is 171 m3 s−1 (1988–2017). Flow in the river is dominantly derived from snowmelt. High flows historically occur in spring, and the lowest flows occur in the late fall and early winter (Rasmussen and Shafroth 2016). This segment of the Colorado River has been heavily regulated since the second half of the twentieth century, with numerous dams on the main stem and tributaries, and water diversions upstream of the study area (Rasmussen and Shafroth 2016; Bureau of Reclamation 2019). As a result of flow regulation, peak flows are lower, and summer flows and sediment supply have substantially decreased, leading to channel narrowing and vegetation encroachment (Van Steeter and Pitlick 1998; Rasmussen and Shafroth 2016). The largest flood events recorded at this gage were in July 1884 (instantaneous peak of 3540 m3 s−1), June 1917 (2175 m3 s−1), and May 1984 (1991 m3 s−1). The most recent large flood occurred in June 2011 (1384 m3 s−1), the fourth largest peak since 1984, the end of the main era of dam construction upstream (1947–1984; Rasmussen and Shafroth 2016).
The riparian corridor is dominated by woody vegetation. Xeric native shrubs in the genera Artemisia, Atriplex, Sarcobatus and Chrysothamnus dominate the more elevated, less frequently inundated landforms. The lower surfaces near the water are mainly occupied by native coyote or sandbar willow (Salix exigua Nutt.) and tamarisk (Tamarix spp.), with native Fremont cottonwood (Populus fremontii S. Watson), desert olive (Forestiera neomexicana Nutt. var. pubescens) and skunkbush sumac (Rhus trilobata Nutt.) also being frequent.
Within the Colorado River segment, we selected two river reaches for study: “Cisco Wash to Dry Gulch” (Cisco, hereafter) and “Gold Bar” (Rasmussen and Shafroth 2016; Fig. 1). The Cisco reach begins 1.6 rkm upstream of the mouth of Cisco Wash and extends upstream 10 rkm to the mouth of Dry Gulch at rkm 171 (rkm 0 is the confluence with the Green River). This reach flows through a valley that cuts through geologic formations that are primarily siltstone, mudstone, and shale. The valley is shallow (60 to 110 m deep), and variable in width (370 to 760 m wide). The channel is straight to moderately sinuous (average sinuosity 1.3) and average river gradient is 0.057. Channels are relatively dynamic, with secondary channels present.
The Gold Bar reach begins at rkm 78 and extends for 20 rkm upstream to the downstream end of the Matheson Wetlands Preserve near the town of Moab (UT) at rkm 98. The reach consists of two large meander bends with an average sinuosity of 2.4. The river flows through a sandstone-walled canyon that is from 120 to 245 m deep and 760 to 1070 m wide. The average gradient along this reach is approximately 0.028.
Active removal of Tamarix mechanically and by prescribed fires is frequent in the study region (Gonzalez et al. 2017b, c). Our study sites, however, had not been subjected to any treatment at the beginning of the study (see below for more details). Disturbance by natural fires and floods occurs occasionally. The northern tamarisk beetle (Diorhabda carinulata) was released at eight locations in the study segment, between 2004 and 2006 (Henry et al. 2018). By 2006, defoliation effects were already noticeable (Nagler et al. 2018).
Within these two reaches we obtained permission from landowners to sample 10 study sites: two in Cisco and eight in Gold Bar (Fig. 1). A study site represented the depositional low surfaces and adjacent floodplains and terraces along the concave half of the meander wavelength in meander bends, or the vegetated surfaces along cut banks in more straight river sections (between meanders). A study site had a relatively homogeneous genesis, spanned from tens to hundreds of meters longitudinally, and could include a variety of fluvial landforms (e.g., point bars, riverbanks, levees, floodplains, secondary channels, and terraces) laterally, across the river valley.
Field Surveys
In the fall of 2010, at each study site we established from one to 10 transects; this number varied with the size, shape and vegetative and geomorphological heterogeneity of the site, for a total of 60 transects (20 in Cisco, 40 in Gold Bar, Appendix S1). Transects were oriented perpendicular to the main river channel and extended from the transition between upland and riparian vegetation to the river water’s edge (i.e., capturing the riparian community), or to the river bank if sampling to the edge could not be done safely. For the Gold Bar sites, the transition occurred at Highway 279.
Along the transects, vegetation and ground cover constituents were sampled five times over eight years in the fall of 2010, 2012, 2013, 2015 and 2017. The vegetation along 12 of the 40 transects in the Gold Bar reach was altered by Tamarix removal efforts and therefore could not be sampled for the entire study period (six of them were last sampled in 2012 and the remaining six in 2015), but all sites kept at least one intact transect for the entire study period. Across each transect, vegetation was sampled using the line-point intercept method (Bonham 1989). All species intercepted on a vertical line (pinpoint hereafter) from ground-level to the canopy top were identified and noted every 50 cm along the transect in the Gold Bar reach for the 2010–2015 surveys, and every 1 m in the Cisco reach and in the Gold Bar reach for the 2017 survey. Pinpoint spacing differed in order to achieve a consistent number of total pinpoints per transect, which could greatly differ in length (see below for more details). We did not distinguish between the two most common Tamarix species in the U.S., T. ramosissima and T. chinensis, and their hybrids (Gaskin 2013), and treated them as a group: Tamarix spp. For the top canopy (>3 m height), the presence of dead material was also recorded by species.
Our study was sensitive to permanent reductions of cover due to canopy dieback or mortality across years but not necessarily to beetle defoliation within years. Refoliation of Tamarix plants occurs during the same growing season of defoliation but, after repeated defoliation events, less resources are available for regrowth, potentially causing permanent dieback (i.e., branch dieback) or mortality (Nagler et al. 2014, 2018). We did not quantify beetle presence, abundance or activity. We assumed that most Tamarix dieback was caused by beetle defoliation; and observed that the effects of other factors on dieback, such as drought stress, self-thinning, or competition, were minor. We will use the term “cycle” to refer to the inter-annual dynamics of defoliation and refoliation. Intra-annual defoliation-refoliation patterns were not the object of study.
The presence of the following ground cover constituents was also registered at the pinpoint level: bare ground, bedrock, small rock (<2 cm), large rock (>2 cm), cyanobacteria and lichens, moss, plant base, coarse litter (>0.75 cm diameter), and fine litter (<0.75 cm diameter). Only one ground cover category was registered at each pinpoint.
We conducted a high-resolution topographic survey [real time kinematic (RTK) global positioning system (GPS)] along the transects in the fall of 2011 (November). Point measurements were recorded at major topographic breaks and water’s edge locations. Estimated vertical accuracy was ±5 cm. All measurements were referenced to the elevation of the water’s edge at each transect (i.e., water’s edge = 0 cm of elevation). Then, the elevation above the water level of each pinpoint was calculated by linearly extrapolating the elevation of the closest two measured topographic breaks. A typical site had a transect length of 48 m, vertical topographic variation of 5.2 m (difference between highest pinpoint and water’s edge) and a 16.3% lateral slope, but the ranges of transect length (22–99 m), topographic variation (3.9–6.5 m), and lateral slope (6.5–31.8%) were wide (Appendix S1). The topographic survey was conducted after the June 2011 flood, which may have partially flooded the study sites and caused some sediment erosion and deposition. No other large floods occurred during the study period that could have altered the topography of the study sites.
Data Processing and Analysis
We first explored the effect of biocontrol on the plant community along the topographic gradient. For this goal, a vegetation matrix was created with observations (i.e., pinpoints across transects surveyed in a given year, 12 transects in Gold Bar with incomplete data series included) as rows and presence/absence of living species, or higher taxa when species identification was not possible, as columns. For this analysis, we discarded rare species, with less than 1% frequency of occurrence, which have a disproportionately high influence on chi-square (X2) distance-based models (Checon and Amaral 2016). The resulting vegetation matrix of dimension 20,047 (rows) × 53 (columns) was subject to a canonical correspondence analysis (CCA), a constrained ordination method that preserves the X2 distance and is the most adequate for species presence/absence data (Ter Braak 1986; Legendre and Legendre 2012). The constraining variables were elevation above river water level and distance to the water’s edge of the main channel, both obtained through the high-resolution topographic survey, and year of survey (presumably reflecting biocontrol effects over time). The three variables were scaled prior to analyses.
As the CCA revealed that only an extremely small percentage of variability in the plant community was explained by the topographic gradient, and that this relationship was essentially not affected by change over time (see Results section), we calculated a frequency of occurrence for each species (including rare species) at each transect with the following formula: (number of counts along the transect divided by the total number of pinpoints along the transect) * 100. We then created a new vegetation matrix with 50 rows (10 sites x five surveys) and the mean frequency of occurrence (%, transects with incomplete data series excluded from calculations) of 119 living species (includes rare species), or higher taxa when species identification was not possible, at each site and year, calculated from transect-level data, as columns. This matrix was Hellinger-transformed (Legendre and Gallagher 2001) and then subjected to a Principal Component Analysis (PCA, Legendre and Legendre 2012) to summarize the plant community of the 10 study sites into fewer ecological gradients illustrated by the main principal components. Analyses based on a Hellinger distance are less sensitive to the effect of rare species (Checon and Amaral 2016), and therefore we used all the taxa in this analysis.
For each transect, site and year, we calculated the Shannon’s diversity and the Pielou’s evenness index. For each site and year, we calculated beta diversity among transects (within-site beta diversity), with the following formula Σ (Hellinger’s transformed distances of the n transects)2 / (n*(n-1)). Using the same formula but replacing transect with site, we also calculated beta diversity among sites for each year (among-site beta diversity). The frequency of occurrence of woody species (trees and shrubs) and herbs (including herbs, forbs and graminoids) was calculated for native and non-native species (obtained from the USDA Plants Database, USDA-NRCS 2017).
Change over time of the entire plant community was explored with analysis of similarity (ANOSIM) from year to year, with Euclidean distance on the Hellinger-transformed data, and, for each of the main principal components (PCs) of the PCA, with Wilcoxon signed-rank tests for paired samples on the site scores of the PCs of interest. To assess change over time for the rest of the vegetation metrics (e.g., Shannon diversity, Pielou evenness, frequency of occurrence of species and groups of species), we also used mixed effect models with transect nested within site as random effects and year of survey as a fixed factor. The significance of all mixed models was checked using a likelihood ratio test, a comparison of full model with fixed factors and random effects and null model with random effects only (Pinheiro and Bates 2000; Bolker et al. 2009).
All analyses were done in RStudio v. 1.1.463 (RStudio Team 2016). The functions cca, decostand, rda, and anosim of package vegan (Oksanen et al. 2019) were used to run the CCA, Hellinger transformation, PCA and the ANOSIM, respectively. Wilcoxon tests were run with the function “wilcox.test” of package “stats” (R Development Core Team 2019). Mixed models were performed using the function “lmer” of the “lme4” package (Bates et al. 2015).
Results
Tamarix
Across the entire study area, Tamarix spp. cover decreased sharply from 2010 to 2013 (ca. -50% from baseline on average for the 10 sites; black bars in Fig. 2 and light red bars in Fig. 3), then increased between 2013 and 2017 to cover levels similar to 2010 (+10% from baseline; but the mixed model with transect nested within site as random, year as fixed, was not significant; likelihood ratio test P = 0.1492). Variability in Tamarix spp. cover across sites was large (see standard error bars in Fig. 2). During the study period (2010–2017), changes in Tamarix cover also varied considerably among sites, with some sites increasing in cover, while others decreased (interquartile range of change in Tamarix cover was 60%). The dead cover of Tamarix also fluctuated widely over time but did not track the changes in the live canopy and had no pattern we could discern (white bars in Fig. 2 and dark red bars in Fig. 3).

Mean frequency of occurrence of the 15 most abundant taxa in the 10 study sites along the Upper Colorado River in eastern Utah, USA over the study period (2010–2017). Error bars are ±1 SE of the mean. The frequency of occurrence of the taxa at each site was obtained from the mean of n (from one to 10) transects. The dead material was only registered for the top canopy (>3 m height). Error bars are not shown to improve visual clarity. “Bromus spp.” are Bromus diandrus ssp. rigidus and B. tectorum; “Sporobolus spp.” are Sporobolus airoides, S. contractus, S. cryptandrus, and Sporobolus spp. “Various grasses” are Calamagrostis spp., Dactylis glomerata, Glyceria striata, Phalaris arundinacea, and Phragmites australis

Total cover of different vegetation life forms and dominant woody species obtained from averaging the sum of frequency of occurrence of individual species by transect in the 10 study sites over the study period (2010–2017). Study sites were along the Upper Colorado River in eastern Utah, USA. The 12 transects disturbed by Tamarix removal efforts (Appendix S1) were not included in calculations. The frequency of occurrence of all categories of plants at a transect could be >100% as more than one species could be present at a given point (e.g., understory and overstory species) and the frequency is calculated as the sum of frequencies of occurrence of individual species
Composition of Plant Communities
We identified a total of 93 species and 26 higher taxa in the study area (Appendix S2). The most abundant species and higher taxa were Tamarix spp. (found in 29.1% of the 20,047 observations), Salix exigua s.l. (19.0%), Forestiera neomexicana (10.0%), Bromus spp. (9.2%), and Rhus trilobata (5.9%). Woody species dominated over herbs in terms of total abundance. Most non-native species were herbs (Fig. 3); with the exception of Tamarix, the occurrence of non-native woody species was very low.
The CCA model incorporating elevation above river water, distance to water’s edge, and year of survey explained only 1.49% of the variability of the plant community at the pinpoint level, including the 53 species and higher taxa with a total frequency of >1% (d.f. = 3, X2 = 0.540, F = 75.159, P = 0.001). Only the first gradient of the CCA had a meaningful ecological interpretation. It explained 0.85% of the variation and separated pinpoints at lower elevation that were closer to the river (positive) from those at higher elevation that were further from the river (negative end of axis). Species typically associated with wetter soils, such as the forbs Carex spp. and Xanthium strumarium and the graminoid macrophyte Typha latifolia had the most positive scores (1.84, 1.71 and 1.49, respectively). Species with no particular preference for wet soils, such as the graminoid Eremopyrum triticeum and the sub-shrubs Suaeda moquinii and Atriplex confertifolia, were the most negatively loaded (−2.79, −1.79, −1.68, respectively). Year of survey was irrelevant in this first axis (CCA1), with a constrained variable score of −0.02 (compared to the −0.45 and − 0.41 for elevation and distance), and in general in the ordination, with a score of 0.06 in CCA2 (which explained 0.47% of total variability, scores of −0.23 and 0.27 for elevation and distance), and 0.25 in CCA3, which only explained 0.17% of total variability.
The initial decrease in Tamarix from 2010 to 2013 was accompanied by a small increase in Shannon and within-site beta diversity. Thereafter, both metrics decreased following Tamarix 2013–2017 recovery. Shannon diversity finished lower than in 2010 (mixed model with transect nested within site as random, year as fixed, likelihood ratio test; P = 0.013), and within-site beta diversity finished at similar levels (mixed models likelihood ratio test; P = 0.586; Fig. 4). Pielou evenness and among-site beta diversity were very stable over time and barely changed (mixed model P > 0.05 for Pielou evenness; no errors and no mixed models as only one value per year was obtained for among-site beta diversity; Fig. 4).

Diversity and evenness of plant communities in 10 study sites along the Upper Colorado River in eastern Utah, USA. (top left) Mean (± 1 SE of the mean of 10 sites) Shannon diversity, (bottom left) Pielou evenness, (top right) within- and (bottom right) among-site beta diversity (see Methods for definition) in the 10 study sites over the study period (2010–2017). The mean Shannon diversity and Pielou evenness at each site were obtained from the mean of n transects, with errors not shown. Among-site beta diversity has no errors as only one value is obtained per year. n for each site = number of transects – number of transects disturbed by Tamarix removal efforts (Appendix S1). The total number of transects used was 48 as the 12 transects disturbed by Tamarix removal efforts were excluded from calculations
Differences in plant community composition among sites (species abundance, transect level) reflected differences between the two river reaches under study and were mainly driven by woody species. The first axis of the Hellinger-based PCA separated Gold Bar (positive end) from Cisco sites (negative end) and explained 27% of the total variability. Gold Bar had more Tamarix, Salix exigua and Forestiera neomexicana (means = 41.0, 24.4, and 14.1) than Cisco (means = 13.6, 8.3, and 7.1) (PC1, Fig. 5). Cisco had more Rhus trilobata, Populus fremontii, and Sarcobatus vermiculatus (means = 20.1, 5.2, and 4.9) compared to Gold Bar, where these species were almost absent (means = 0.1, 0.3, and 1.1) (PC1, Fig. 5). Cisco also had a more abundant and diverse understory, but was dominated by non-native herbs, mainly Bromus spp. (mean = 14.5 vs. 5.6 in Gold Bar) and Centaurea repens (mean = 8.4 vs. 0.7 in Gold Bar) (negative end PC1, Fig. 5). The second axis (16% of total variability) reflected differences among sites within each river reach and were mainly driven by sites with a higher presence of either Salix exigua (positive end PC2, Fig. 5) or Forestiera neomexicana (negative end PC2, Fig. 5).

Differences in plant community composition among 10 study sites along the Upper Colorado River in eastern Utah, USA. (left) Species scores (scaling = 2) along the two first principal components of a Principal Component Analysis (PCA) with the Hellinger-transformed plant community recorded in 10 study sites monitored from 2010 to 2017, only the species with the highest loadings are labeled; (right) temporal trajectories of the 10 study sites as given by site scores (scaling = 2). The position of the letters indicates the end of the trajectories. See Fig. 1 for location of the 10 sites; A-B were in the Cisco reach, C-J in the Gold Bar reach
Plant composition in the ten sites changed very little over time. Not only did differences between sites outweigh differences among survey years along the main gradients of ecological variability (overall short trajectories along PC1 and PC2 while sites were spread out over the bidimensional space, Fig. 5), but the entire plant composition only changed significantly, and marginally, from 2010 to 2012 according to ANOSIM analyses, with an extremely low ANOSIM value (1 = total dissimilarity, 0 = total similarity) (Table 1). A pattern of change of site scores across sites over time was not detected for PC1 (Wilcoxon tests for the 10 sites between 2010 and 2017, P = 0.285), but site scores increased along PC2 (Wilcoxon test, P = 0.022). The only remarkable changes over time across all sites were: the defoliation-refoliation cycle of Tamarix reported above, a 47% increase in Salix exigua, and a fluctuating cover of herbs. Herbs showed a marked drop from 2010 to 2012, with non-natives (−61%) dropping substantially more than native (−33%) species (Figs. 2 and 3).
Ground cover was mainly dominated by fine litter, with more than 50% cover in all years (Fig. 6), followed by coarse litter and bare ground. The presence of other categories was negligible, with less than 4% cover in all years. Fine litter increased over time, while coarse litter and bare ground decreased (mixed models, P < 0.05). Coarse litter peaked in 2013, when fine litter reached its lowest cover. Fine litter was positively correlated with Tamarix cover (Pearson’s correlation coefficient = 0.166, P = 0.001). Most fine litter was comprised of Tamarix leaves (field observations).

Mean (± 1 SE) frequency of occurrence of ground cover constituents in the 10 study sites over the study period (2010–2017) along the Upper Colorado River in eastern Utah, USA
Discussion
Changes in Tamarix Cover Reflect a Second Inter-annual Cycle of Defoliation-Refoliation Typical of Plant-Herbivore Interactions
Our results did not support our hypothesis that the cover of non-native Tamarix spp. in the upper Colorado River in eastern Utah would decrease over time. Instead the data reflected a second inter-annual cycle of defoliation-refoliation. Overall, Tamarix cover first decreased but then rebounded to remain stable across the study period (+10% on average across sites, but this difference was not significant). We began to monitor our sites from four to six years after the arrival of the biocontrol tamarisk beetles in the study area, and therefore missed the first years of defoliation that usually cause the most damage. However, our results were consistent with Nagler et al. (2018) who used a remote sensing time-series from 2004 to 2016 along the Colorado River at the Matheson Wetland Preserve (within our broader study segment and adjacent to our Gold Bar reach), to show that MODIS Enhanced Vegetation Index (EVI), a proxy of vegetation greenness that can capture defoliation, displayed a substantial decrease in riparian vegetation of ca. 30% from 2004 to 2008 (reaching a lowest value in the series). This was followed by a recovery to 2010 levels and then a second cycle of defoliation (until 2013) and recovery (until 2016, when 90% of the pre-beetle EVI values were reached; Fig. 2A in Nagler et al. 2018).
Other studies have found a similar pattern of initial dieback followed by a partial recovery and a new, second defoliation cycle. For example, in a study conducted along the Colorado River and main tributaries in western Colorado (upstream from the Cisco reach), Kennard et al. (2016) reported a sharp decrease in Tamarix canopy area and crown volume of ca. 60% during the first two years of their survey (starting from 1 to 3 years since beetle arrival), followed by a small recovery and a progressive decline towards a ca. 70% reduction from the initial values at the end of their survey (seven to nine years since beetle arrival). This cyclical pattern is typical of plant-herbivore interactions, where the population of the former is reciprocally affected by the latter (e.g., Buckley et al. 2005 also in a biocontrol context), and underscores the need to monitor the effects of biocontrol on a long-term basis. Previous studies with fewer years of observations described net decreases in Tamarix abundance, often up to at least ca. 50% (Appendix S3), but it is possible that some of these were only capturing the defoliating phase of the inter-annual cycle and therefore overestimating the effects of biocontrol on Tamarix dieback. Cycles of coupled increasing and decreasing populations also have been reported for other types of biocontrol, such as predator-prey relationships (Ong and Vandermeer 2015).
High Variability in Tamarix Response to Biocontrol Among Study Sites Suggests that Biocontrol Effectiveness is Site-Specific
The high variability in change in Tamarix cover from 2010 to 2017 between our study sites is also consistent with previous studies that have reported a very patchy nature of defoliation (Henry et al. 2018; Nagler et al. 2018; González et al. 2020). Biocontrol has many potential drivers, from environmental conditions (Hultine et al. 2015) to beetle dispersal and colonisation (Bean et al. 2013; Nagler et al. 2014; Jamison et al. 2015; Nagler et al. 2018), and population genetics of both beetles and plants (Bean et al. 2013; Hultine and Dudley 2013; Hultine et al. 2015; Williams et al. 2014; Long et al. 2017). Moreover, these drivers operate at multiple spatial and temporal scales (Henry et al. 2018). We could not discern the causes of the extremely high spatial variability we observed in Tamarix dieback, and future work determining the mechanisms and ecosystem attributes that determine dieback and recovery in the context of Tamarix biocontrol would be of great value.
Riparian Plant Composition Changed Little During a Second Inter-annual Cycle of Defoliation-Refoliation
As expected, differences in plant composition between the two study river reaches were found, but the results did not support the hypothesis of increasing native species cover overall. Only small changes to riparian plant composition following a second cycle of Tamarix defoliation and recovery occurred. Salix exigua was the only species that notably increased in abundance over time, and dominated or co-dominated with Tamarix, reaching a cover of >20% on average. Salix exigua is a native shrub with a great clonal growth capacity (Douhovnikoff et al. 2005; Rood et al. 2011), which could have helped it to quickly occupy the space opened by declining Tamarix. Sher et al. (2018) found that increases of S. exigua cover were correlated with decreases of Tamarix cover in a tributary of the Colorado River whose confluence is immediately downstream from the Cisco reach (the Dolores River), but we did not find any clear correlation between change in Tamarix spp. and Salix exigua cover in our study sites (data not shown). Another native shrub that spreads by rhizomes, Pluchea sericea (arrowweed), absent in our study area, greatly increased in cover after Tamarix dieback in the lower Virgin River (Arizona and Nevada) (González et al. 2020). It is possible that functional differences determine the rate at which different species fill ephemeral openings left by reductions in Tamarix cover. For example, adjacent clonal plants (e.g., S. exigua) may colonize bare soil more quickly than plants that depend on seed. However, there were other clonal species that, despite being relatively abundant, did not increase in our study area following defoliation (e.g., Centaurea repens, Forestiera neomexicana). It is possible that the observed increase in S. exigua was due to factors other than Tamarix dynamics, which warrants further research. It is well known, for example, that population dynamics of S. exigua are intimately connected to the flood regime. Reduced flood disturbance as a result of flow regulation may favor clonal growth (Douhovnikoff et al. 2005), but S. exigua seed colonization and clonal expansion also occurs following sediment deposition during floods (Rood et al. 2011). The large flood of 2011 in the study area did not have a clear effect on S. exigua abundance (small difference in S. exigua frequency of occurrence between 2010 and 2012, Fig. 2). Regardless of life history strategies, if more vegetation had occupied the space vacated by defoliated Tamarix, its rebound might have been weaker.
The cover of native understory plants was low and rather stable over time and therefore our results do not support the small recovery of native understory observed in previous work (González et al. 2017b; Sher et al. 2018). We cannot exclude the possibility that some recovery may have occurred during the first cycle of defoliation (2004/2006–2009), prior to our sampling. Regardless, the cover of native herbs following defoliation, despite being low, was not much lower than in other rivers where Tamarix decline has been sharper (e.g., lower Virgin River, González et al. 2020). It is notable that, while non-native herbs dominated the understory, especially in the Cisco sites, we did not detect a peak following the Tamarix 2010–2013 decline. Other studies reported a peak in non-native herbs and forbs following a first (González et al. 2020) and a second (Kennard et al. 2016) cycle of defoliation. While it is possible that we missed an initial increase in cover of non-native herbaceous species during the first years of defoliation, our results may support González et al.’s (2017c) conclusion that secondary invasions of non-native herbs and forbs are idiosyncratic (species- and site-dependent) and can be persistent, as they were more abundant than native herbs, and had a stable cover over time. Nevertheless, in our study sites they had relatively low abundance compared to other rivers (González et al. 2017b, c) and were not increasing. It is also possible that Tamarix recovery was too fast (or the second cycle of defoliation-refoliation too short) for the accompanying vegetation to respond. For example, seed germination may require some set of climate conditions that do not occur regularly or often. Finally, the observed increase in fine litter at the end of the monitoring period, relative to baseline levels, could have affected germination and growth of understory species by changing nutrients, organic matter and salts in soils (Sherry et al. 2016).
A Small But Clear Effect of the Topographic Gradient in Structuring Plant Communities was Detected but was Not Affected by Defoliation-Induced Changes in Tamarix Cover
Exploration of the plant community composition conducted at the pinpoint level showed that, contrary to one of our initial hypotheses, the response of vegetation to biocontrol did not differ greatly along the topographic gradient (elevation and distance from water’s edge). First, the role of the topographic gradient and underlying flood regime in driving plant communities was not affected by biocontrol, as the main ecological gradient primarily represented by a wet-to-dry transition was not affected by change in Tamarix cover over time (i.e., Tamarix presence/absence and year was not relevant in the CCA). Second, the proportion of variability in the plant community explained by the topographic gradient (associated with CCA1) was extremely low (<1%), which was unexpected given that the transects occupied several fluvial landforms across the river valley width. This could result from landforms other than floodplains being under-represented and thus our sites were less geomorphologically heterogeneous than anticipated. Moreover, the sites do not flood regularly and therefore may be subject to a relatively homogeneous flood regime.
Despite the extremely low proportion of variability explained, the first gradient of variability in the entire plant community (CCA1) reflected a wet-to-dry transition, with plants associated with wetter soils occupying lower elevation locations presumably with greater access to river water, and more exposure to flooding (closer to the main channel). This underscores the role of the flood regime in structuring plant communities in riparian zones (Stromberg et al. 1993; Cordes et al. 1997; Stromberg et al. 2005; Stromberg and Merritt 2015; Tabacchi et al. 2019). Additional possible evidence of (small) effects of the flood regime on plant community composition is that both native and non-native understory cover had their largest fluctuation, a decline, from 2010 to 2012. The largest flood that occurred in the study area during the monitoring period was in June 2011 and could have scoured and buried some of that vegetation. We believe, however, that the impact of the 2011 flood on channel morphology was small, as the composition of the entire plant community barely changed between 2010 and 2012 (ANOSIM, Table 1), and large topographic changes were not obvious during our field campaigns. No other floods occurred during the rest of the study period 2012–2017, and understory vegetation, not surprisingly, changed little.
Conclusions
As a result of a second cycle of Tamarix defoliation and recovery, contrary to our initial hypotheses, Tamarix cover did not decrease, native cover did not increase, and the role of the topographic gradient and underlying flood regime in driving plant communities was not affected by the impacts of biocontrol. We observed, however, great variability in change of Tamarix cover between and within two river reaches and across ten study sites of the upper Colorado River. We also reported remarkable differences in the composition of plant communities between reaches and across sites, but in this case, they changed little over time and, in general, remained stable from the beginning to the end of the study. Ours is the first study, to our knowledge, that reports the response of Tamarix and the entire plant community to biocontrol defoliation more than a decade after the arrival of the beetle (Appendix S3).
In a context of uncertainty about the response of vegetation to Tamarix biocontrol and concern about a loss of ecosystem functions and services of riparian systems in southwestern U.S. rivers, we demonstrate that episodic defoliation events are not necessarily always followed by long-term Tamarix dieback at a river segment level, and that changes in the associated plant community may be small. We suggest that the effectiveness of biocontrol programmes and the need for compensatory restoration measures (e.g., active introduction of native vegetation) must be assessed case by case, and on a long-term basis. For this, more research on the environmental factors that determine the composition of riparian plant communities in a new scenario with the Tamarix beetle being present is needed. It is likely, however, that the effects of Tamarix biocontrol on riparian plant communities will not fully unfold until a few more decades have passed.
Data Availability
Data associated with this paper are available in the USGS ScienceBase repository https://doi.org/10.5066/P9EFZVG8
References
Bateman HL, Nagler PL, Glenn EP (2013) Plot- and landscape-level changes in climate and vegetation following defoliation of exotic saltcedar (Tamarix sp.) from the biocontrol agent Diorhabda carinulata along a stream in the Mojave Desert (USA). Journal of Arid Environments 89:16–20
Bates D, Maechler M, Bolker B, Walker S (2015) Fitting linear mixed-effects models using lme4. Journal of Statistical Software 67:1–48
Bean DW, Dudley T, Hultine K (2013) Bring on the beetles! History and impact of tamarisk biological control. In: Sher A, Quigley MF (eds) Tamarix: a case study of ecological change in the American West. Oxford University Press, New York, pp 377–403
Bolker BM, Brooks ME, Clark CJ, Geange SW, Poulsen JR, Stevens MHH, White JSS (2009) Generalized linear mixed models: a practical guide for ecology and evolution. Trends in Ecology & Evolution 24:127–135
Bonham CD (1989) Measurements for terrestrial vegetation. Wiley, New York
Bowser CW (1957) Introduction and spread of the undesirable tamarisks in the Pacific Southwestern section of the United States and comments concerning the Plants' influence upon the indigenous vegetation. Bureau of Reclamation
Buckley YM, Rees M, Sheppard AW, Smyth MJ (2005) Stable coexistence of an invasive plant and biocontrol agent: a parameterized coupled plant-herbivore model. Journal of Applied Ecology 42:70–79
Bureau of Reclamation (2019). https://www.usbr.gov/uc/rm/crsp/index.html. Last accessed 12-December-2019
Checon HH, Amaral ACZ (2016) Taxonomic sufficiency and the influence of rare species on variation partitioning analysis of a polychaete community. Marine Ecology 38:e12384
Cordes LD, Hughes FMR, Getty M (1997) Factors affecting the regeneration and distribution of riparian woodlands along a northern prairie river: the Red Deer River, Alberta, Canada. Journal of Biogeography 24:675–695
Corenblit D, Steiger J, Gurnell AM, Tabacchi E, Roques L (2009) Control of sediment dynamics by vegetation as a key function driving biogeomorphic succession within fluvial corridors. Earth Surface Processes and Landforms 34:1790–1810
DeLoach CJ, Lewis PA, Herr JC, Carruthers RI, Tracy JL, Johnson J (2003) Host specificity of the leaf beetle, Diorhabda elongata deserticola (Coleoptera: Chrysomelidae) from Asia, a biological control agent for saltcedars (Tamarix: Tamaricaceae) in the Western United States. Biological Control 27:117–147
Douglass CH, Nissen SJ, Heart CR (2013) Tamarix management: lessons and techniques. In: Sher A, Quigley MF (eds) Tamarix: a case study of ecological change in the American West. Oxford University Press, New York, pp 333–353
Douhovnikoff V, McBride JR, Dodd RS (2005) Salix exigua clonal growth and population dynamics in relation to disturbance regime variation. Ecology 86:446–452
Gaskin J (2013) Genetics of Tamarix. In: Sher A, Quigley MF (eds) Tamarix: a case study of ecological change in the American West. Oxford University Press, New York
González E, Sher AA, Tabacchi E, Masip A, Poulin M (2015) Restoration of riparian vegetation: a global review of implementation and evaluation approaches in the international, peer-reviewed literature. Journal of Environmental Management 158:85–94
González E, Felipe-Lucia MR, Bourgeois B, Boz B, Nilsson C, Sher AA (2017a) Integrative conservation of riparian zones. Biological Conservation 211:20–29
González E, Sher AA, Anderson RM, Bay RF, Bean DW, Bissonnete GJ, Cooper DJ, Dohrenwend K, Eichhorst KD, El Waer H, Kennard DK, Harms-Weissinger R, Henry AL, Makarick LJ, Ostoja SM, Reynolds LV, Robinson WW, Shafroth PB, Tabacchi E (2017b) Secondary invasions of noxious weeds associated with control of invasive Tamarix are frequent, idiosyncratic and persistent. Biological Conservation 213:106–114
González E, Sher AA, Anderson RM, Bay RF, Bean DW, Bissonnete GJ, Bourgeois B, Cooper DJ, Dohrenwend K, Eichhorst K, El Waer H, Kennard DK, Harms-Weissinger R, Henry AL, Makarick LJ, Ostoja SM, Reynolds LV, Robinson WW, Shafroth PB (2017c) Vegetation response to invasive Tamarix control in southwestern U.S. rivers: a collaborative study including 416 sites. Ecological Applications 27:1789–1804
González E, Shafroth PB, Lee SR, Ostoja SM, Brooks ML (2020) Combined effects of biological control of an invasive shrub and fluvial processes on riparian vegetation dynamics. Biological Invasions 22:2339–2356
Henry AL, González E, Robinson WW, Bourgeois B, Sher AA (2018) Spatial modeling improves understanding patterns of invasive species defoliation by a biocontrol herbivore. Biological Invasions 20:3545–3562
Hudgeons JL, Knutson AE, Heinz KM, DeLoach CJ, Dudley TL, Pattison RR, Kiniry JR (2007) Defoliation by introduced Diorhabda elongata leaf beetles (Coleoptera: Chrysomelidae) reduces carbohydrate reserves and regrowth of Tamarix (Tamaricaceae). Biological Control 43:213–221
Hultine K, Dudley T (2013) Tamarix from organism to landscape. In: Sher A, Quigley MF (eds) Tamarix: a case study of ecological change in the American West. Oxford University Press, New York, pp 149–167
Hultine KR, Belnap J, van Riper IIIC, Ehleringer JR, Dennison PE, Lee ME, Nagler PL, Snyder KA, Uselman SM, West JB (2010) Tamarisk biocontrol in the western United States: ecological and societal implications. Frontiers in Ecology and the Environment 8:467–474
Hultine KR, Dudley TL, Koepke DF, Bean DW, Glenn EP, Lambert AM (2015) Patterns of herbivory-induced mortality of a dominant non-native tree/shrub (Tamarix spp.) in a southwestern US watershed. Biological Invasions 17:1729–1742
Jamison LR, van Riper C, Bean DW (2015) The influence of Tamarix ramosissima defoliation on population movements of the northern tamarisk beetle (Diorhabda carinulata) within the Colorado plateau. The Colorado Plateau VI, In, pp 281–292
Janssen P, Piégay H, Pont B, Evette A (2019) How maintenance and restoration measures mediate the response of riparian plant functional composition to environmental gradients on channel margins: insights from a highly degraded large river. Science of the Total Environment 656:1312–1325
Kennard D, Louden N, Gemoets D, Ortega S, González E, Bean D, Cunningham P, Johnson T, Rosen K, Stahlke A (2016) Tamarix dieback and vegetation patterns following release of the northern tamarisk beetle (Diorhabda carinulata) in western Colorado. Biological Control 101:114–122
Legendre P, Legendre L (2012) Numerical ecology, third, English edn. Elsevier Science, Amsterdam
Legendre P, Gallagher ED (2001) Ecologically meaningful transformations for ordination of species data. Oecologia 129(2):271–280
Long RW, Bush SE, Grady KC, Smith DS, Potts DL, D’Antonio CM, Dudley TL, Fehlberg SD, Gaskin JF, Glenn EP, Hultine KR (2017) Can local adaptation explain varying patterns of herbivory tolerance in a recently introduced woody plant in North America? Conservation Physiology 5:1–13
McCoy-Sulentic ME, Kolb TE, Merritt DM, Palmquist E, Ralston BE, Sarr DA, Shafroth PB (2017) Changes in community-level riparian plant traits over inundation gradients, Colorado River, grand canyon. Wetlands 37:635–646
Nagler PL, Pearlstein S, Glenn EP, Brown TB, Bateman HL, Bean DW, Hultine KR (2014) Rapid dispersal of saltcedar (Tamarix spp.) biocontrol beetles (Diorhabda carinulata) on a desert river detected by phenocams, MODIS imagery and ground observations. Remote Sensing of Environment 140:206–219
Nagler PL, Nguyen U, Bateman HL, Jarchow CJ, Glenn EP, Waugh WJ, van Riper IIIC (2018) Northern tamarisk beetle (Diorhabda carinulata) and tamarisk (Tamarix spp.) interactions in the Colorado River basin. Restoration Ecology 26:348–359
Oksanen J, Blanchet FG, Friendly M, Kindt R, Legendre P, McGlinn D, Minchin PR, O'Hara RB, Simpson GL, Solymos P, Henry M, Stevens H, Szoecs E, Wagner H (2019) Vegan: community ecology package. R package version 2:5–5 https://CRAN.R-project.org/package=vegan
Ong TW, Vandermeer JH (2015) Coupling unstable agents in biological control. Nature Communications 6:1–9
Paxton EH, Theimer TC, Sogge MK (2011) Tamarisk biocontrol using tamarisk beetles: potential consequences for riparian birds in the southwestern United States. The Condor 113:255–265
Pinheiro JC, Bates DM (2000) Mixed-effects models in S and SPLUS. Springer, New York
R Core Team (2019) R: a language and environment for statistical computing. In: R Foundation for statistical computing. Austria. URL, Vienna https://www.R-project.org/
Rasmussen CG, Shafroth PB (2016) Conservation planning for the Colorado River in Utah. Colorado Mesa University
Richardson DM, Holmes PM, Esler KJ, Galatowitsch SM, Stromberg JC, Kirkman SP, Pysek P, Hobbs RJ (2007) Riparian vegetation: degradation, alien plant invasions, and restoration prospects. Diversity and Distributions 13:126–139
RiversEdge West (2018). 2017-2018 tamarisk beetle distribution map. RiversEdge West, Grand Junction, CO. [online] https://riversedgewest.org/sites/default/files/images/2018_Draft_Yearly_Distribution_Map.jpg accessed on 2019-02-04
Rood SB, Goater LA, Gill KM, Braatne JH (2011) Sand and sandbar willow: a feedback loop amplifies environmental sensitivity at the riparian interface. Oecologia 165:31–40
RStudio Team (2016) RStudio: integrated development for R. RStudio, Inc., Boston, MA URL http://www.rstudio.com/
Shafroth PB, Briggs MK (2008) Restoration ecology and invasive riparian plants: an introduction to the special section on Tamarix spp. in Western North America. Restoration Ecology 16:94–96
Shafroth PB, Beauchamp VB, Briggs MK, Lair K, Scott ML, Sher AA (2008) Planning riparian restoration in the context of Tamarix control in Western North America. Restoration Ecology 16:97–112
Sher AA, El Waer H, González E, Anderson R, Henry AL, Biedron R, Yue P (2018) Native species recovery after reduction of an invasive tree by biological control with and without active removal. Ecological Engineering 111:167–175
Sherry RA, Shafroth PB, Belnap J, Ostoja S, Reed SC (2016) Germination and growth of native and invasive plants on soil associated with biological control of tamarisk (Tamarix spp). Invasive Plant Science and Management 9:290–307
Stromberg JC, Merritt DM (2015) Riparian plant guilds of ephemeral, intermittent and perennial rivers. Freshwater Biology 61:1259–1275
Stromberg JC, Richter BD, Patten DT, Wolden LG (1993) Response of a Sonoran riparian forest to a 10-year return flood. Great Basin Naturalist 53:118–130
Stromberg JC, Bagstad KJ, Leenhouts JM, Lite SJ, Makings E (2005) Effects of stream flow intermittency on riparian vegetation of a semiarid region river (San Pedro River, Arizona). River Research and Applications 21:925–938
Stromberg JC, Chew MK, Nagler PL, Glenn EP (2009) Changing perceptions of change: the role of scientists in Tamarix and river management. Restoration Ecology 17:177–186
Tabacchi E, González E, Corenblit D, Garófano-Gómez V, Planty-Tabacchi AM, Steiger J (2019) Species composition and plant traits: characterization of the biogeomorphological succession within contrasting river corridors. River Research and Applications 35(8):1228–1240
Ter Braak CJ (1986) Canonical correspondence analysis: a new eigenvector technique for multivariate direct gradient analysis. Ecology 67:1167–1179
U.S. Climate Data (2019) https://www.usclimatedata.com/climate/united-states/us. Last accessed on 18-nov-2019
USDA-NRCS (U.S. Department of Agriculture-Natural Resources Conservation Service) (2017) The PLANTS database. http://plants.usda.gov
Van Steeter MM, Pitlick J (1998) Geomorphology and endangered fish habitats of the upper Colorado River, 1. Historic changes in streamflow, sediment load and channel morphology. Water Resources Research 34:287–302
Williams WI, Friedman JM, Gaskin JF, Norton AP (2014) Hybridization of an invasive shrub affects tolerance and resistance to defoliation by a biological control agent. Evolutionary Applications 7:381–393
Acknowledgments
The U.S. Geological Survey, Ecosystems Mission Area, Invasive Species Program supported field data collection, analysis, and overall manuscript preparation. Eric Wahlig, Cherokee Nation Technologies, conducted the field topographic surveys. Thanks to Erika Geiger, Hilda Smith, and Jennifer Shostrand for data management. We thank the numerous USGS field crews for their dedicated work in sampling the vegetation and environmental variables. Any use of trade, firm, or product names is for descriptive purposes only and does not imply endorsement by the U.S. Government.
Author information
Authors and Affiliations
Corresponding author
Additional information
Publisher’s Note
Springer Nature remains neutral with regard to jurisdictional claims in published maps and institutional affiliations.
Electronic supplementary material
ESM 1
(DOCX 35.5 kb)
Rights and permissions
About this article

Cite this article
González, E., Shafroth, P.B., Lee, S.R. et al. Riparian Plant Communities Remain Stable in Response to a Second Cycle of Tamarix Biocontrol Defoliation. Wetlands 40, 1863–1875 (2020). https://doi.org/10.1007/s13157-020-01381-7
Received:
Accepted:
Published:
Issue Date:
DOI: https://doi.org/10.1007/s13157-020-01381-7