
Abstract
Plant community responses to biocontrol of invasive plants are understudied, despite the strong influence of the composition of replacement vegetation on ecosystem functions and services. We studied the vegetation response to a folivore beetle (Diorhabda genus, Coleoptera) that has been introduced along southwestern US river valleys to control the invasion of non-native shrubs in the genus Tamarix (Tamaricaceae). We collected detailed plant compositional and environmental data during four different surveys over 7 years (2010–2017), including two surveys prior to when substantial beetle-induced dieback occurred in summer 2012, along the lower Virgin River, Nevada. The study river was of special interest because it is one of only a few largely unregulated rivers in the region, and a large flood of 40-year return period occurred between the first and second surveys, allowing us to study the combined effects of fluvial processes, which typically drive riparian plant community assembly, and biocontrol. Vegetation trajectories differed as a function of the dominant geomorphological process. Tamarix cover declined an average of 75% and was replaced by the native shrub Pluchea sericea as the new dominant species in the floodplain, especially where sediment deposition predominated. Following deposition, and especially erosion, opportunistic native herbs, Tamarix seedlings, and noxious weeds colonized the understory layer but did not increase in cover over time. Stands of the native shrub Salix exigua, a desirable replacement species following Tamarix control, only increased slightly and remained subordinate in the floodplain. Overall, our results showed that, by successfully controlling the target non-native plant, a biocontrol agent can substantially modify the replacement plant communities in a riparian system, but that fluvial processes also strongly influence the resulting communities.
Introduction
Biological control (hereafter biocontrol) of invasive plants can serve as an alternative to more expensive and sometimes environmentally undesirable mechanical and chemical control methods, especially in sensitive habitats and at large scales where traditional methods may be impractical to apply (Culliney 2005). Despite a long history of biocontrol use and scientific study (Schwarzländer et al. 2018), the broader influence on plant communities remains generally unknown (Clewley et al. 2012). In a meta-analysis including 130 biocontrol agents and 39 non-native plant species in Australia, Thomas and Reid (2007) found only two studies that reported plant community response to biocontrol. Understanding vegetation trajectories after non-native plant control is particularly important if the target alien is a “passenger” rather than a “driver” of biodiversity change (MacDougall and Turkington 2005). When the alien is a “passenger”, control will not necessarily result in replacement by native, desirable vegetation, but possibly by other undesirable vegetation communities including new non-native plants (a.k.a. secondary invasions, Pearson et al. 2016; González et al. 2017a). When the alien is a “driver”, recolonization by native vegetation is more likely, but legacy effects that hamper recovery may persist, especially in the short term (Johnson 2013).
Riparian corridors are particularly prone to plant invasions (Richardson et al. 2007) and therefore are candidates for biocontrol. It is well known that vegetation composition and dynamics in riparian systems are mainly driven by the flow regime and fluvial processes which vary both among riverine systems and longitudinally and laterally between different fluvial landforms within the same river system (Hughes 1997; Stromberg et al. 1993, 2005; Stromberg and Merritt 2015). Thus, riparian plant community responses to biocontrol are expected to be conditioned by the dominant fluvial processes.
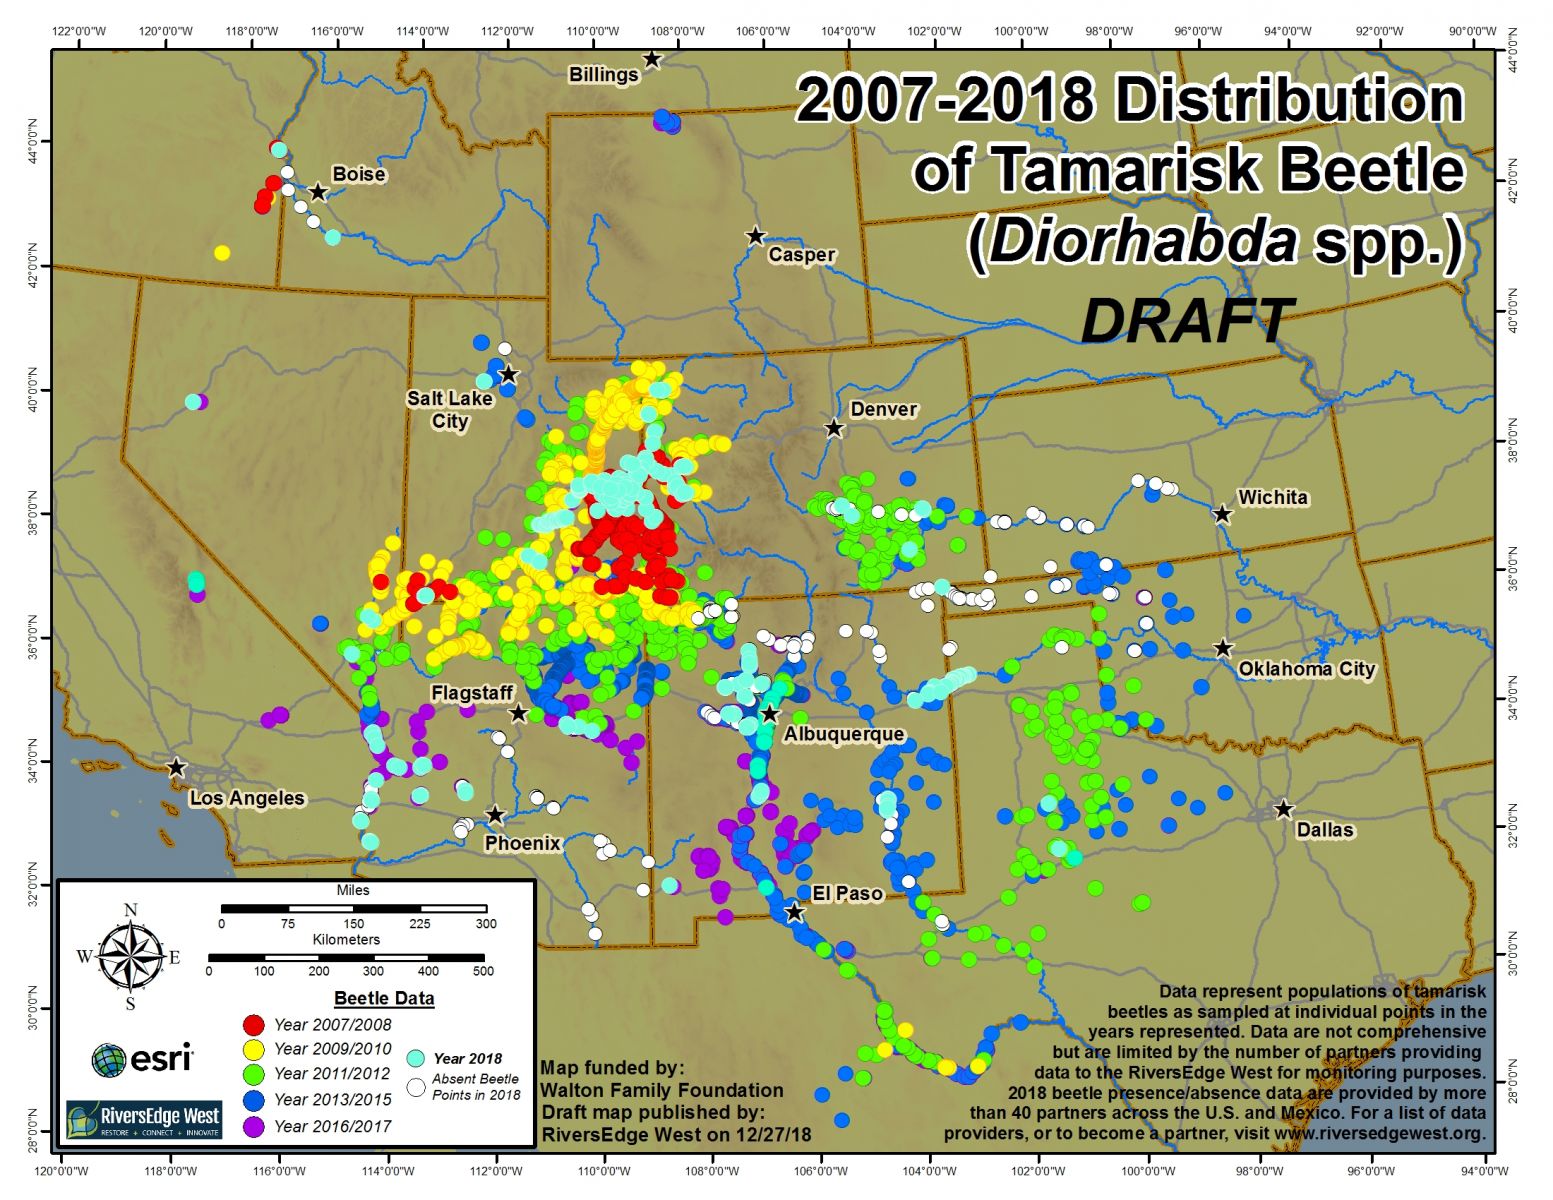
Tamarix L. (Tamaricaceae) and their hybrids have extensively invaded riparian areas in western North America since their introduction in the nineteenth century and are now among the most frequently occurring and abundant riparian plants in that region (Nagler et al. 2011). The United States Department of Agriculture (USDA) Animal and Plant Health Inspection Service (APHIS) put in place a biological control program using folivore beetles in the genus Diorhabda, which are native to Central Asia and feed exclusively on Tamarix. Beetles were first released in 2001 at eight sites in the US States of California, Colorado, Nevada, Utah, Texas, and Wyoming (DeLoach et al. 2003) and, after several more releases in other sites and natural migration, have since permanently established in Tamarix-dominated riparian corridors in the US States of Arizona, California, Colorado, Idaho, Kansas, Nevada, New Mexico, Oklahoma, Oregon, Utah, Texas, and Wyoming, and the Mexican states of Coahuila, Chihuahua, Sonora, and Baja California Norte (RiversEdge West 2018). The beetle is now almost ubiquitous along western North American rivers, having expanded across a region encompassing ca. two million km2 (RiversEdge West 2018). This has led to defoliation, canopy dieback, and Tamarix mortality in many locations (Hultine et al. 2015; Bean and Dudley 2018; Nagler et al. 2018).
The success of Diorhabda in controlling Tamarix lies in contrast to the general lack of understanding of the plant communities likely to replace it. Replacement plant communities determine key ecosystem functions and properties such as provision of wildlife habitat, preservation of biodiversity, erosion control, nutrient and water cycling, flammability, and the delivery of ecosystem services such as livestock use, recreational experiences, and aesthetic enjoyment (Shafroth et al. 2008). Of common interest in the context of Tamarix control is whether the replacement vegetation will provide suitable habitat for various types of wildlife, including federally listed endangered species such as the southwestern willow flycatcher (SWFL), which, facing a decline in natural cottonwood–willow habitats, now utilize tamarisk habitat (Sogge et al. 2008; Hultine et al. 2010). The few studies assessing vegetation response to Tamarix biocontrol (after 4–9 years of defoliation) have reported frequent secondary invasions of noxious weeds, mainly non-native graminoids and forbs (Kennard et al. 2016; González et al. 2017a, b), and only slight increases in native species diversity, richness, and cover, mainly in the understory layer (González et al. 2017b; Sher et al. 2018). The recovery of a native woody vegetation layer dominated by cottonwoods and willows has been slower, site-specific, and generally less certain. These studies are limited to parts of the upper Colorado River basin in eastern Utah and western Colorado (Kennard et al. 2016; González et al. 2017a, b; Sher et al. 2018), which limits their utility when inferring responses elsewhere in the North American West.
Reports of vegetation response to biocontrol span a range of hydrological conditions from ephemeral canyon drainages to medium- and large-size regulated rivers (Colorado R. and its tributaries, Green and Dolores rivers), and from more or less frequently flooded fluvial landforms. Kennard et al. (2016) and González et al. (2017b) found that readily measurable hydro-geomorphological metrics such as river width, distance to main channel, longitudinal slope and sediment properties can partially explain the abundance of certain plant groups such as noxious weeds, and native and hydric species. However, they also observed that the relationships between their hydro-geomorphological metrics and plant communities following defoliation were weak and suggested that the response of vegetation may also have an important site-specific component, which warrants further research on the combined effects of hydro-geomorphological processes and biocontrol on vegetation recovery.
Another limitation of published Tamarix-biocontrol field studies is that none include monitoring data before the beetle arrived, and thus lack pre-intervention information that can be key to interpret beetle effects (e.g., propagule availability, plant species pool, etc.). Additionally, the early response of plant communities is unknown, as vegetation monitoring did not begin until at least the fourth year of beetle activity in previous studies (Kennard et al. 2016; González et al. 2017a, b). With the bulk of defoliation generally occurring during the first few years following beetle arrival (Pattison et al. 2011; Nagler et al. 2018), this shortcoming limits our ecological interpretation of vegetation response.
The goal of this study was to expand our knowledge of the vegetation response to biocontrol of Tamarix. Specific objectives were to assess plant community responses to biocontrol in the context of site-specific edaphic, and geomorphological drivers of change along the lower sections of the Virgin River of SE Nevada and NW Arizona, USA. The Virgin River provides an opportunity to explore how different fluvial processes associated with a large flood (40-year return interval) set the stage for different vegetation responses to Tamarix biocontrol. This article builds upon the observations of González et al. (2019), which reported the short-term geomorphological and vegetation responses to this flood event. The outcome of the study was intended to help inform regional management priorities, such as planning and implementing riparian restoration actions to influence wildlife habitat quality (e.g., for SWFL).
Methods
Study area
The Virgin River flows through a watershed of approximately 35,000 km2 from the mountains of southern Utah, US (1147 m a.s.l.), into the eastern Mojave Desert in Arizona and Nevada, to its confluence with the Colorado River at Lake Mead reservoir (366 m a.s.l.). The 250 river-km-long river is characterized by a single-thread channel in bedrock-constrained canyons and a compound channel in wider alluvial valleys (Graf 1988) (Fig. 1). The flow regime of the Virgin River is largely unregulated due to the absence of any on-channel water-storage dams and reservoirs, though there are several small-scale irrigation diversions operated seasonally in the upper and lower reaches, and several small reservoirs on major tributaries, that primarily affect baseflows but not the river’s flood hydrology (Enzel et al. 1994; Beck and Wilson 2006). Moderate to large floods of short duration (few hours to days) occur in the winter after rainstorms and snowmelt, and in the summer and fall following monsoon thunderstorms.

Location of the five study river reaches and field transects in the Lower Virgin River (Nevada, SW USA). The star represents the city of Mesquite, NV. The UTM coordinates of the transects and their absolute elevation above sea level are available online (see Data Accessibility). Note that the lowest elevation of any of our transects (Lake Mead transect 3, 364.75 m) has not been reached by the lake since January 2001 (US Bureau of Reclamation 2020)
This study took place along 62 river-km in the lower segment of the Virgin River (Fig. 1). The lower Virgin is a broad alluvial valley that begins downstream from the Virgin River gorge and is extensively dominated by Tamarix. In Mesquite (Nevada), the mean annual precipitation is 230 mm and the temperature is 20.4 °C (monthly maximum in July 42.1 °C, minimum in December 0.7 °C, US Climate Data 2020). Using the rkm = 0 reference at the confluence of the Colorado and Virgin rivers, approximately in the middle of Lake Mead (36.145 N, 114.413 W), we selected five river reaches starting near the Arizona-Nevada border at river-kilometer (rkm) 119 and ending approximately 15 rkm upstream from the confluence with the Muddy River. The reaches were Littlefield (rkm 119–103), Mesquite (rkm 103–97), Gold Butte (rkm 84–67), Mormon Mesa (rkm 67–62), and Lake Mead (rkm 62–57). Only the Lake Mead reach was affected by the lake backwaters in the past (but not later than 2001, US Bureau of Reclamation 2020). Each reach had distinctive hydrogeomorphological and vegetation characteristics (Stillwater Sciences 2014). The biocontrol beetle first arrived near the upstream end of our study area in the fall of 2009 (field observations), but their defoliation effects did not result in substantial Tamarix dieback until the summer of 2011 at our upstream sites and summer of 2012 at our downstream sites (Bateman et al. 2013; Hultine et al. 2015; Nagler et al. 2018).
Streamflow is well-represented by a gaging station located at the upstream end of our study segment (USGS gage #09415000 − “Virgin River near Littlefield”; drainage area = 13,183 km2). Average annual discharge is 7 m3 s−1 (period 1930–2017). The largest floods recorded at the gage occurred in 1966, 1989, 2005 and 2010, ranging from 878 to 1727 m3 s−1 (Fig. 2).

Instantaneous peak streamflow at USGS gage #09415000, “Virgin River near Littlefield”. Return periods were calculated using the Log-Pearson III method. The 1989 flood was caused by the Quail Creek Dam failure and therefore was not natural
Along the Lower Virgin River, the predominant native riparian tree and shrub species include Fremont cottonwood (Populus fremontii S. Watson), Goodding’s willow (Salix gooddingii C.R. Ball), coyote or sandbar willow (Salix exigua Nutt.), honey and screwbean mesquite (Prosopis glandulosa Torr. and Prosopis pubescens Benth.), Emory’s baccharis (Baccharis emoryi A. Gray), mule-fat (Baccharis salicifolia (Ruiz & Pav.) Pers.) and arrowweed (Pluchea sericea (Nutt.) Coville). Only small patches of native vegetation persist within landforms dominated by Tamarix ramosissima Ledeb., Tamarix chinensis Lour., and their hybrid forms, all of which are not easily distinguishable in the field and will be generally referred as Tamarix spp. Tamarix parviflora DC. is also present in the floodplain. D. carinulata beetles were released in 2006 near St. George, UT (ca. 45 km upstream of our study area) and then progressively moved downstream, reaching Lake Mead by 2012 (Bateman et al. 2010; Dudley and Bean 2012; Hultine et al. 2015). The beetles prefer feeding on T. ramosissima, T. chinensis, and their hybrid forms, over T. parviflora (Dudley et al. 2012).
Field surveys
In the fall of 2009, we established 24 field transects (3–6 per reach, Fig. 1). Transect locations were selected to represent the range of geomorphological landforms including active channels, bars, floodplains, and terraces, and existing riparian vegetation communities within each reach. Transects ran perpendicular to the main river channel. With variable river valley widths, transect lengths ranged from 131 to 585 m, with each starting in the adjacent uplands and extending to at least the low-flow river channel (with the exception of one transect in Mesquite and two transects in Lake Mead); many transects crossed the low-flow channel and continued across the entire valley bottom. Mechanical removal of Tamarix is a common practice in the study area (Ostoja et al. 2014), but none of the transects was affected by any mechanical treatment prior to or during the course of our study.
Along each transect, vegetation was sampled four times over 8 years in the spring (April and May) of 2010, 2012, 2015 and 2017. The 2010 survey represents conditions prior to the 40-year flood of December 2010 (pre-flood, pre-biocontrol dieback), the 2012 survey represents conditions following the December 2010 flood but prior to substantial tamarisk dieback (post-flood, pre-biocontrol dieback), while the 2015 and 2017 surveys were after both the 40-year flood and substantial beetle effects (post-flood, post-biocontrol dieback). Floods of smaller magnitude than the December 2010 flood occurred between the 2012, 2015 and 2017 surveys, namely in September of 2012 (2 years), September of 2014 (4 years) and in February of 2017 (1.5 years) (return periods calculated with Log-Pearson III method, Fig. 2).
Along the length of each transect, from 8 to 32 (depending on transect length and number of geomorphological surfaces), 10 m2 (2 × 5 m) plots were distributed at 20-m intervals within each distinct geomorphological surface, for a total of 462 plots. Within each plot, one or two observers visually estimated cover for each plant species present (0–100%), and the average cover value was recorded. For Tamarix spp. (other than T. parviflora), cover was estimated for four size classes: seedling, < 1 m tall; sapling, ≥ 1 m tall and diameter of largest stem at ca. 20 cm above the ground surface < 2.5 cm; small mature, ≥ 1 m tall and diameter of largest stem = 2.6–7.5 cm; large mature ≥ 1 m tall and diameter of largest stem > 7.5 cm. The cover of leaf litter and coarse (i.e., branches, bark, woody debris) litter (> 0.5 cm diameter) at each plot was also estimated visually. Tamarix trees are able to refoliate during the same growing season after being defoliated but this capacity declines with resource depletion after repeated defoliation events, potentially causing permanent dieback (i.e., branch dieback) and mortality (Nagler et al. 2014, 2018). Therefore, our measure of cover is sensitive to permanent reductions due to plant dieback and mortality associated with biocontrol but not necessarily to beetle defoliation. Our goal was to assess vegetation response across years, rather than within years. In fact, during our sampling, we noted very little defoliation and we did not quantify beetle presence, abundance or activity. We assumed that most dead Tamarix cover is a result of beetle defoliation (Hultine et al. 2015; Nagler et al. 2018); other causes of dieback and mortality, such as drought stress, self-thinning or self-pruning in response to competition were considered negligible.
We compared high resolution topographic surveys (Real Time Kinematic Global Positioning System RTK-GPS) along the transects in spring 2010, fall 2011, spring 2012, spring 2015 and spring 2017 to assess the topographic change associated with the December 2010 and subsequent floods. Point measurements were recorded at major topographic breaks, vegetation plot corners, and water’s edge locations. Because we were particularly interested in the combined effects of biocontrol and the geomorphological dynamics of the river on riparian vegetation, we used the topographic change caused by the largest flood (40-year, December 2010) to define four categories of plots (González et al. 2019). We defined deposition plots as those with ≥ 10 cm increase in elevation between the pre- and post-2010 flood surveys; erosion plots as those with ≥ 10 cm decrease in elevation; and no change plots as those with < 10 cm vertical change. We defined reset plots as those with < 10 cm vertical change but with strong evidence of flood disturbance (e.g., open water—being submerged, fresh alluvium, removal of vegetation). These definitions were developed given that the topographic surveys had approximately 5 cm of vertical and horizontal (x–y) error.
At each plot, a 600 ml composite soil sample was obtained by compositing 12, 50 ml subsamples collected every meter along the outside perimeter of each plot (10 cm depth). Soil samples were collected twice: in spring of 2010 and in spring of 2012. A subset of 190 samples representative of all geomorphological surfaces was sent to Brigham Young University’s Environmental Analytical Laboratory (Provo, UT) for analysis of soil texture (with only percentage in > 63 µm-sand in fine fraction being reported) using the hydrometer method (Day 1965), and electrical conductivity (EC, a measure of salinity) from a saturated paste extract (RC-16C Conductivity Bridge, Beckman Instruments, Brea, CA, USA).
Processing and statistical analyses of field survey data
A vegetation matrix was created with observations (i.e., plot surveyed in a given year) as rows and species cover (%) as columns. Tamarix size classes were entered as pseudo-species. Channel change during the study period resulted in 62, 14 and 33 plots being submerged in the 2012, 2015 and 2017 surveys; therefore, these were not re-sampled. The 1739 row vegetation matrix (i.e., 462 plots × 4 surveys = 1848, minus 109 submerged observations) was Hellinger-transformed (Legendre and Gallagher 2001) and then subjected to a Principal Component Analysis (PCA) to summarize the entire plant composition into fewer gradients (Legendre and Legendre 2012).
For each observation (i.e., plot surveyed in a given year), we calculated species richness and Shannon’s diversity index. The cover of vegetation was calculated as the sum cover of all species (total vegetation, > 100% was possible) and grouped by growth form (trees, shrubs and herbs). We also defined the origin (native, non-native) of all species from the USDA Plants Database (USDA-NRCS 2017).
To assess the effects of biocontrol on Tamarix dieback, we selected plots with Tamarix cover ≥ 30% in 2012 (post-flood, pre-biocontrol dieback survey). This value corresponded to the mean Tamarix cover for all 2012 plots (n = 400 plots, i.e., 462 minus 62 submerged) and included 41% (164) of the plots sampled in 2012, those within the 59th percentile with the highest Tamarix cover. By establishing a cover threshold, we aimed to minimize the importance of human error in estimating cover visually and to be able to assess the change in dieback over time with more certainty. We calculated the change in Tamarix dieback for the 164 plots for the 2012–2015 and 2012–2017 transitions and expressed it as a % with the formula: (cover in 2015 or 2017—cover in 2012)/cover in 2012 × 100.
To explore the response of the plant community to biocontrol in the context of key edaphic and geomorphological characteristics over time, we first compared change over time in cover of Tamarix, plant groups, species richness, Shannon’s diversity and the main gradients of the plant communities expressed as PCA principal components between the topographic change categories defined above. The “reset” category was excluded from comparisons because there were too few plots to produce interpretable results. Then, we analysed the site scores of the main two axes of the PCA, and all other plant community metrics including change in Tamarix dieback using mixed models with year as fixed factor and plot, transect, and river reach as random effects. Models were also run with soil electrical conductivity, percentage of sand in the sediments, leaf and coarse litter cover and elevation above the water level as fixed factors, to test the effect of these environmental variables on the replacement vegetation. Differences among river reaches were also explored by using river reach as a fixed effect instead of as a random effect. The significance of all mixed models was assessed using a likelihood ratio test, a comparison of the full model with fixed and random effects and the null model with random effects only (Pinheiro and Bates 2000; Bolker et al. 2009).
All statistical analyses were conducted in R 3.4.1. (R Development Core Team 2017). Mixed models were run using the function lmer of the lme4 package (Bates et al. 2015). The Hellinger transformation and PCA analyses were run using the functions decostand and rda of the vegan package (Oksanen et al. 2017).
Results
Geomorphological changes
The 40-year flood substantially changed the morphology of the river channel (González et al. 2019) and topography of the study plots, with 26% of the plots (n = 118) classified as deposition, 27% (n = 125) as erosion, and 2% (n = 9) as reset (transition 2010–2012, Fig. 3). The remaining 45% of the plots (n = 210) were classified as no change. Changes were more frequent in the Littlefield, Mesquite and Gold Butte river reaches (% for deposition–erosion–reset–no change plots: 26–33–2–39, 27–41–1–31, 39–23–5–33) than in Mormon Mesa and Lake Mead, where ca. 75% of the plots did not change (16–10–0–74, 8–14–2–76). Only 25% of the plots changed in elevation with subsequent floods that occurred from 2012 to 2015, and more than one half of those were the result of deposition occurring in plots that had been eroded during the December 2010 40-year flood (transition 2012–2015, Fig. 3). Only 16% of the plots changed in elevation as a result of the flood of February 2017 (transition 2015–2017, Fig. 3).

Change in elevation of the 462 field plots during the study period. Orange blocks represent number of plots experiencing deposition (≥ 10 cm increase in elevation compared to previous survey), blue represents erosion (≥ 10 cm decrease in elevation), gray represents no change (< 10 cm vertical change), and yellow represents reset (< 10 cm vertical change but with strong evidence of flood disturbance) at each survey. Hatched areas represent the plot categories “deposition”, “erosion”, “no change”, and “reset”, defined by the 2010–2012 transition. For example, 25 plots experienced deposition in the 2015–2017 and in the 2012–2015 transition but were defined as “erosion” plots because they experienced erosion in the 2010–2012 transition. The floods of largest magnitude occurred in December 2010 (878 m3 s−1, 40 years), September 2012 (125 m3 s−1, 2 years), September 2014 (222 m3 s−1, 4 years) and February 2017 (92 m3 s−1, 1.5 years) (return period estimated using Log-Pearson III method). To improve visual clarity, only numbers of plots ≥ 5 are shown
Decrease in Tamarix cover
Since the defoliating beetle was first detected in the study reach in the fall of 2009 (2010 along our transects), Tamarix cover decreased ca. 75%, from a mean ± 1 SE cover at each plot of 33.5 ± 1.4% in 2010 and 30.0 ± 1.6% in 2012 to 6.3 ± 0.5% in 2015 and 6.5 ± 0.5% in 2017 (mixed model with year as fixed factor P < 0.001; Table 1). Over the entire study period, Tamarix decrease was higher in erosion than in deposition and no change plots, because in erosion plots approximately one-third of the total vegetation (and consequently, one-third of the Tamarix cover) had been removed by the flood before biocontrol dieback was substantial (i.e., after 2012) (Fig. 4). The decrease in Tamarix cover from 2012 to 2017, presumably as an effect of defoliation (Tamarix dieback, see methods), was highly variable among plots (from a total loss of Tamarix (− 100%) to a small increase of + 6%). However, dieback did not differ among deposition, erosion and no change plots (i.e., from a mean cover of 67.0 to 11.8% = − 78%, n = 34; 52.6–10.0% = − 81%, n = 9; and 62.7–13.0%, = − 77%, n = 121; respectively; mixed model P = 0.625). We could not explain differences in Tamarix dieback from 2012 to 2017 either using EC or %Sand in the sediments (mixed models P = 0.280 and 0.909, respectively), or river reach as fixed effect instead of random effect (Littlefield = − 80% (n = 25), Mesquite = − 72% (n = 35), Gold Butte = − 78% (n = 27), Mormon Mesa = − 84% (n = 47) and Lake Mead = − 73% (n = 30); mixed model P = 0.402). Tamarix dieback from 2012 to 2017 was only correlated with plot elevation (i.e., more dieback at lower elevation), but weakly (mixed model P = 0.049, Pearson correlation of 17%). The change in Tamarix cover between 2012 and 2015 also fluctuated greatly among plots (from a total loss of − 100% to a small increase of + 14%), but we could not explain such variability with either the dominant geomorphological process, river reach, sediment characteristics, or elevation above water level (mixed models P > 0.05).

Mean cover of different vegetation life forms and dominant woody species over time. See main text for definition of deposition, erosion and no change plots and Tamarix size classes (vegetation not recorded in submerged observations and therefore not included in the calculations)
Effects of flooding and biocontrol on the entire plant community
Considering the combined effect of flooding and biocontrol, total vegetation cover decreased by almost one half, from 48.4 ± 1.4 to 26.5 ± 1.2% (mean ± 1 SE, Fig. 4, mixed model with year as fixed factor P < 0.001; Table 1), with this decline being more pronounced in erosion plots. We identified 146 taxa to the species level and 15 to genus or family in the four surveys (Appendix S1). We found a mean (± 1 SE) of 3.2 ± 0.1 species per observation, with Shannon’s diversity index being rather low (mean ± 1 SE = 0.51 ± 0.01). Over time, species richness and Shannon diversity followed a similar pattern: they decreased after the 40-year flood in deposition and no change plots, and increased in erosion plots; then they decreased in all plot types following substantial biocontrol dieback from 2012 to 2015, and then rebounded after a few years of biocontrol dieback by 2017, to end up slightly higher than in 2010 for richness, and slightly lower for diversity (mixed models with year as fixed factor P < 0.001; Table 1; Fig. 5).

Mean ± 1 SE species richness (top panel) and Shannon’s diversity index (bottom panel) over time in deposition, erosion, no change, and all plots combined (see main text for definitions) (vegetation not recorded in submerged observations and therefore not included in the calculations)
The differences in plant composition among observations were very highly controlled by differences in composition and structure of the woody vegetation layer. The first gradient of the PCA explained 24% of the plant community composition variability and separated observations dominated by Tamarix other than T. parviflora (positive end of PC1, Fig. 6) from those dominated by the native shrub P. sericea (negative end of PC1, Fig. 6). The second gradient explained 14% of the variability and was mainly related to the structure of the woody vegetation layer, with observations separated by the smaller sizes of Tamarix, particularly saplings and small mature individuals and P. sericea (positive end of PC2, Fig. 6), which is also of small size, from large mature individuals of Tamarix (negative end of PC2, Fig. 6). With lower species scores, a last group of species played a lesser, but notable role in the ordination, all being negatively loaded in both PC1 and PC2 (quadrant III of the bidimensional space, Fig. 6), by decreasing order of importance: the smallest Tamarix size class (seedlings), the native shrub Salix exigua, the annual non-native forb Salsola tragus, the annual non-native grasses Polypogon monspeliensis and Schismus barbatus, and the native perennial graminoid Scirpus pungens (synonym S. americanus).

First two main gradients of a Principal Component Analysis (PCA) on a Hellinger transformed species matrix with 1739 observations (i.e., site sampled in a given year) along the lower Virgin River, NV (USA). Species scores (scaling = 2), in red font, were divided by 6 to improve visual clarity. Site scores (scaling = 2) are represented with ellipses of different colors including 90% of the observations at each river reach and with the centroids of deposition (118), erosion (125) and no change (210) plots, calculated as the mean value of each plot type at each survey. Deposition, erosion and no change plots were defined for their change in elevation following the 40-year December 2010 flood. Reset plots are not represented due to their small number of plots (9), which hampered an ecological interpretation of their trajectories over time
Geomorphological processes and biocontrol had a great influence on plant composition dynamics. Sediment deposition following the 40-year flood mainly occurred in plots in which Tamarix and P. sericea were co-dominant (centroid of deposition plots in 2010, in orange, only slightly negatively loaded, PC1 in Fig. 6, 2010 bar in Fig. 4), but it was not associated with changes in plant composition (short 2010–2012 orange arrow in Fig. 6, 2012 bar in Fig. 4) as much as biocontrol dieback, which reduced Tamarix and benefitted P. sericea (long 2012–2015 orange arrow in Fig. 6, 2015 bar in Fig. 4). Erosion occurred in sites initially more dominated by Tamarix (blue centroid 2010 in Fig. 6, 2010 bar in Fig. 4) and mostly removed Tamarix saplings and small adults (long 2012–2010 blue arrow in Fig. 6, 2012 bar in Fig. 4). With less Tamarix cover to die back, the effects of biocontrol on the resulting plant community were less notable in erosion plots (short 2012–2015 blue arrow in Fig. 6, 2015 bar in Fig. 4), but P. sericea still became dominant by 2017 (blue centroid 2017 in negative side of PC1 in Fig. 6, 2017 bar in Fig. 4). The relative importance of the subordinate group of species in erosion plots was the largest among the three types of plots (blue centroids of 2012, 2015 and 2017 in quadrant III of the bidimensional space in Fig. 6). Both native and non-native herbs peaked after the 40-year flood (2012 bar in Fig. 4), then stabilized while native shrubs and trees other than P. sericea (mainly S. exigua) slightly increased in cover and relative importance (2015 and 2017 bars in Fig. 4). The plots that were not affected by the 40-year flood (no change plots) were the most dominated initially by Tamarix (grey centroid 2010 highly positively loaded in Fig. 6, 2010 bars in Fig. 4), and did not change much following the flood (short 2010–2012 grey arrow in Fig. 6), with the exception of an increase of Tamarix saplings at the expense of large adults (Fig. 4) that we believe was due to an underestimation of the stem diameters in the 2012 field survey. There, biocontrol dieback effects on vegetation were pronounced from 2012 to 2015 (long grey arrow in Fig. 6, 2012 bar in Fig. 4) and stabilized later (short 2015–2017 grey arrow in Fig. 6, 2015 bar in Fig. 4), eventually resulting in co-dominance of Tamarix with P. sericea (grey centroid 2017 only slightly positively loaded in PC1 Fig. 6, 2017 bar in Fig. 4).
Differences in plant composition among river reaches was small, with a high overlap of observations along the main ecological gradients (ellipses, Fig. 6). However, a trend of increasing Tamarix dominance in a downstream direction was still perceivable. P. sericea was more abundant in the Gold Butte reach.
Effects of litter cover, sediment characteristics and relative elevation on vegetation
Leaf litter cover averaged 34.0% ± 0.8 (mean ± 1 SE) in all observations; it decreased following the 40-year flood in deposition, and more sharply in erosion plots. In no change plots, it decreased sharply in the 2012–2015 transition following the first years of biocontrol, then rebounded over time in all plot types (Fig. 7a). Coarse litter was much less abundant than leaf litter and also decreased sharply in erosion plots after the 40-year flood but increased in deposition plots, generally stabilizing over time (Fig. 7b). No change plots were at topographically higher positions at ca. 2.5 m above the low flow channel. Erosion plot elevations ranged between 0.5 and 1 m and deposition plot elevations were ca. 2 m following the 40-year flood (Fig. 7c). Also following this flood, EC and %Sand of the sediments increased in erosion plots and EC decreased in deposition plots (Fig. 7d, e; mixed models P < 0.05, not shown).

Mean ± 1 SE of key environmental variables over time. See main text for definition of deposition, erosion and no change plots. Calculations were done with 380 observations (190 plots surveyed twice) for EC and % sand in sediments, with 1722 observations for leaf and coarse litter (1739 non-submerged observations minus 17 with missing data) and with 1848 observations from all plots surveyed four times (462) for elevation above water level
Leaf litter was highly positively correlated with P. sericea and especially with total Tamarix and total vegetation cover, and negatively with the herbaceous layer (weak relationship), species richness and Shannon’s diversity (mixed models for leaf litter, Table 1). Coarse litter was more frequently found where Tamarix cover and total vegetation cover were high, but correlations were weak (mixed models for coarse litter, Table 1). Sites dominated by Tamarix, especially with larger individuals, were less sandy and more saline than those where the abundance of herbs was higher, which were also richer in species and more diverse (mixed models for EC and %Sand, Table 1). The elevation above the water level had less explanatory power, with only non-native and native herbs respectively tending to occupy higher and lower surfaces (weak correlations, mixed models for relative elevation, Table 1).
Discussion
Tamarix dieback was similar to that found in other river systems of the southwestern US affected by biocontrol
As in other river systems of the southwestern US, effects of the Diorhabda beetle caused a sharp decrease in Tamarix cover in the lower Virgin River. The mean reduction of 75% cover following 6–8 years of beetle activity was comparable to decreases of cover > 90% after only 3 years of biocontrol in the Humboldt and Walker rivers (Nevada) (Pattison et al. 2011), and to the ca. 50% decreases after 4–9 years reported in multiple rivers in the Upper Colorado River basin (Kennard et al. 2016; González et al. 2017b; Henry et al. 2018). In other studies of the lower and middle Virgin River, Hultine et al. (2015) reported Tamarix canopy dieback of 54% by 2014, Nagler et al. (2014) found a 50% reductions in leaf area index by 2013, and Nagler et al. (2018) estimated a 75% reduction in MODIS Enhanced Vegetation Index (EVI), a proxy of vegetation cover obtained through remote sensing, by 2015. The effectiveness of Tamarix biocontrol is similar to that reported for other species; Clewley et al. (2012) reported a 56% average plant density reduction based on a meta-analysis of 61 studies.
Overall, studies have found high variability in defoliation-induced Tamarix cover reductions between and within study sites, rivers and regions, with continued uncertainty around the factors explaining this variability (Henry et al. 2018). Similarly, we found high variability in Tamarix dieback (ranging from + 14 to − 100%) across plots but were not able to explain it with either the dominant geomorphological process, sediment properties, or river reach. Henry et al. (2018) suggested that the high and unexplained spatial variability in Tamarix dieback could be caused by factors controlling defoliation operating at multiple spatial scales. Beetles operate in a “colonize–defoliate–emigrate” pattern (Nagler et al. 2018), traveling long distances along wide river corridors with dense, connected tamarisk stands (Ji et al. 2017). These conditions exist in our Lower Virgin River study area where Nagler et al. (2014) reported dispersal rates of 25–30 km year−1. This rapid dispersal rate through our 62 rkm-long study area likely helps to explain why we did not find differences in dieback among river reaches. The causes of the high local variability reflected at the plot level in our study, however, merit further research. Hultine et al. (2015) suggested that higher dieback in our study area occurred in more saline soils, but our data, which included significantly more sediment analyses, did not confirm this. Patches of fully, partially defoliated, and recovering Tamarix such as that found in the Lower Virgin River are typical along other rivers in this region (Nagler et al. 2018).
A large flood opened opportunities for understory species, but these did not become dominant in the system following Tamarix dieback
The 40-year flood produced geomorphological change, erosion of vegetated landforms and deposition of sediments that opened opportunities for other species that had remained subordinate in the floodplain before the flood (see also González et al. 2019). This reinforces the role of the flood regime in structuring riparian plant communities (Hughes 1997; Stromberg et al. 1993, 2005; Stromberg and Merritt 2015). Erosion and deposition caused disturbance, which removed biomass and benefitted opportunistic, pioneer species with ruderal traits (Grime 2001), such as Salsola tragus, Schismus barbatus and Polypogon monspeliensis (all three considered noxious weeds by the US Department of Agriculture, USDA-NRCS 2017). Their capacity to colonize recently disturbed areas could be partially explained by their ability to produce abundant small seeds (Brooks 2000; Baker et al. 2008; Palmquist et al. 2017). However, unlike in other rivers of the southwestern US (Kennard et al. 2016; González et al. 2017a, b; Sher et al. 2018), the abundance of those noxious weeds did not increase or persist following Tamarix dieback along the lower Virgin River, suggesting that secondary invasions might not be a big concern in this system. The native graminoid that best responded to fluvial disturbance, Scirpus pungens, is also an early colonizer that reproduces well in wet, even saturated, saline sediments by seed and clonally by rhizomes (Lite et al. 2005; Albert et al. 2013). Seedlings of Tamarix also colonized disturbed sites. Tamarix is also a disturbance-dependent species, with seedlings that require moist, bare and open surfaces that floods create (Auerbach et al. 2013). The 40-year flood exposed fluvial surfaces that could have been colonized during the following spring and summer when seed release occurs. As was the case for noxious weeds, neither opportunistic native herbs nor Tamarix seedlings increased over time as Tamarix cover declined with dieback, so biocontrol did not lead to the dominance of the plant community by the understory layer. With little to no fluvial disturbance, no change plots showed the least change in understory plant composition, immediately after the flood and over time with Tamarix dieback. No change plots represent the most similar conditions compared to regulated rivers where flooding and geomorphological dynamism is reduced; thus, we expect that the ecological trajectories of no change plots should most resemble those along regulated rivers.
Pluchea sericea as the new dominant species in the floodplain
With Tamarix declining in the floodplain and no understory herbs taking long-term advantage of this situation, the native shrub P. sericea expanded and became the new dominant in all types of plots (erosion, no change and, especially, deposition). A similar increase in P. sericea dominance occurred 2–5 years after mechanical control of Tamarix along the Lower Virgin River and before the arrival of the biocontrol beetles (Ostoja et al. 2014). The autecology of P. sericea is largely unknown, but it is likely that its prolific rhizomes helped it to colonize the new surfaces cleared of vegetation by fluvial disturbance, and later the openings in the canopy caused by Tamarix dieback and mortality. Butterfield et al. (2020) observed that P. sericea occupied areas prone to accumulate sand on sandbars of the Colorado River in Grand Canyon and argued that this plant creates a positive feedback with sand deposition because its dense stem structure promotes sediment deposition and its propensity for resprouting allows it to tolerate burial by sand. Likewise, P. sericea thrived in cottonwood–willow forests following fire disturbance along the Lower Colorado River (Busch 1995). A higher cover of leaf litter in the soil may have also contributed to P. sericea spread by inhibiting colonization of competing herbs.
With a great clonal growth capacity (Douhovnikoff et al. 2005; Rood et al. 2011), the native shrub Salix exigua also took advantage of the space opened up where vegetation was removed in erosion plots, although absolute increases in frequency and abundance were relatively small. Unlike the noxious weeds, Tamarix seedlings, and native herbs, S. exigua slightly decreased immediately following the flood (see González et al. 2019 for more details) and the observed small increase in abundance was only apparent over time. Still, S. exigua was much less abundant than P. sericea in the floodplain of the Virgin R. at the end of the sampling period (almost six times less frequent and when present, with half the mean cover, Appendix S1). With such low abundance, small differences in cover when present should be interpreted with caution. Our results did not indicate a significant relationship between decreases in Tamarix cover due to control measures and increases in S. exigua, which Sher et al. (2018) observed along the Dolores River (CO).
Conclusions
The combined effects of a 40-year flood, particularly the erosion of vegetated surfaces, and the subsequent biocontrol-related dieback of Tamarix starting only 1–2 years later, resulted in an overall decrease of Tamarix cover of about 75% in our study sites along the lower Virgin River, and ca. 50% of total vegetation in 7 years (Fig. 8). Defoliation-induced Tamarix dieback was highly variable between study plots but no differences were found between the dominant geomorphological process induced by the large 40-year flood, physicochemical properties of the sediments such as electrical conductivity and texture (proportion of sand) and five river reaches along 62 rkm. Beetles colonized the entire river segment relatively fast (~ 2 years) and defoliated the Tamarix stands uniformly along the upstream–downstream axis, but the explanation for high variability in dieback at the local (i.e., plot, tree stands) scale still needs further exploration.

View of the lower Virgin River near Littlefield, AZ, before and after the 40-year flood and substantial beetle dieback. Note the change in the channel morphology and stands of mostly defoliated (orange/brown), possibly dead Tamarix (grayish colored vegetation) in second photo
The replacement plant communities were notably influenced by the dominant geomorphological process. Opportunistic native and non-native understory species and Tamarix seedlings peaked after the 40-year flood, following deposition, and especially erosion of fluvial surfaces, but they did not increase dramatically over time. This highlights the importance of long-term monitoring and warrants further monitoring of the sites. Native woody species also benefitted some from the space vacated by Tamarix.
The changes in vegetation over the course of our study likely have implications for wildlife use. The significant reduction in Tamarix and relatively low cover of replacement vegetation could disfavor some wildlife taxa, depending on vegetative cover, temperature, or food source preferences (Paxton et al. 2011; Bateman et al. 2013, 2015; Mahoney et al. 2017). Although Salix exigua, a shrub desirable for hosting many bird species, increased some following Tamarix dieback, it remained subordinate in the floodplain. Pluchea sericea became the new dominant species in the system, which could result in relatively low-quality wildlife habitat due to its lack of structural diversity (Bateman and Ostoja 2012). More studies on the wildlife use of P. sericea stands and its contribution to other ecosystem processes and functions are needed to assess its desirability as replacement vegetation following Tamarix control.
Our study showed that biocontrol can efficiently control invasive Tamarix, but that recovery of diverse replacement vegetation has been relatively slow. This suggests that additional management measures (e.g., active revegetation) should be considered to speed up the development of communities that optimize particular ecosystem function and services. Such actions need to consider the dynamic nature of the river. For example, previous revegetation efforts conducted in the active river channel were ruined by the 40-year flood (e.g., “Hughes Middle School” restoration site near Mesquite, Stillwater Sciences 2014). Desiccated Tamarix can also increase fire risk (Drus et al. 2013). Thus, active restoration should be carefully planned and likely implemented on sites that are relatively safe from future flooding and fires.
Data availability
Data associated with this paper are available in the USGS ScienceBase repository https://doi.org/10.5066/p97kzjgp.
References
Albert DA, Cox DT, Lemein T, Yoon HD (2013) Characterization of Schoenoplectus pungens in a Great Lakes coastal wetland and a Pacific Northwestern estuary. Wetlands 33:445–458
Auerbach DA, Merritt DM, Shafroth PB (2013) Tamarix, hydrology, and fluvial geomorphology. In: Sher AA, Quigley MF (eds) Tamarix: a case study of ecological change in the American West. Oxford University Press, New York, pp 99–122
Baker DV, Beck G, Bienkiewicz BJ, Bjostad LB (2008) Forces necessary to initiate dispersal for three tumbleweeds. Invasive Plant Sci Manag 1:59–65
Bateman HL, Ostoja SM (2012) Invasive woody plants affect the composition of native lizard and small mammal communities in riparian woodlands. Anim Conserv 15:294–304
Bateman HL, Dudley TL, Bean DW, Ostoja SM, Hultine KR, Kuehn MJ (2010) A river system to watch: documenting the effects of saltcedar (Tamarix spp.) biocontrol in the Virgin River Valley. Ecol Restor 28:405–410
Bateman HL, Nagler PL, Glenn EP (2013) Plot- and landscape-level changes in climate and vegetation following defoliation of exotic saltcedar (Tamarix sp.) from the biocontrol agent Diorhabda carinulata along a stream in the Mojave Desert (USA). J Arid Environ 89:16–20
Bateman HL, Merritt DM, Glenn EP, Nagler PL (2015) Indirect effects of biocontrol of an invasive riparian plant (Tamarix) alters habitat and reduces herpetofauna abundance. Biol Invasions 17:87–97
Bates D, Maechler M, Bolker B, Walker S (2015) Fitting linear mixed-effects models using lme4. J Stat Softw 67:1–48
Bean D, Dudley T (2018) A synoptic review of Tamarix biocontrol in North America: tracking success in the midst of controversy. Biocontrol 63:361–376
Beck DA, Wilson JW (2006) Discharge and physical-property measurements from Virgin River Narrows, Arizona, to Lake Mead, Nevada, February 12, 2003. US Department of the Interior, US Geological Survey, New York
Bolker BM, Brooks ME, Clark CJ, Geange SW, Poulsen JR, Stevens MHH, White JSS (2009) Generalized linear mixed models: a practical guide for ecology and evolution. Trends Ecol Evol 24:127–135
Brooks ML (2000) Schismus arabicus Nees, Schismus barbatus (L.) Thell. Invasive plants of California’s wildlands, pp 287–291
Busch DE (1995) Effects of fire on southwestern riparian plant community structure. Southwest Nat 40:259–267
Butterfield BJ, Grams PE, Durning LE, Hazel J, Palmquist EC, Ralston BE, Sankey JB (2020) Associations between riparian plant morphological guilds and fluvial sediment dynamics along the regulated Colorado River in Grand Canyon. River Res Appl 36:410–421
Clewley GD, Eschen R, Shaw RH, Wright DJ (2012) The effectiveness of classical biological control of invasive plants. J Appl Ecol 49:1287–1295
Culliney TW (2005) Benefits of classical biological control for managing invasive plants. Crit Rev Plant Sci 24:131–150
Day PR (1965) Particle fractionation and particle-size analysis. In: Black CA (ed) Methods of soil analysis part 1. American Society of Agronomy, Inc., Madison, pp 562–566
DeLoach CJ, Lewis PA, Herr JC, Carruthers RI, Tracy JL, Johnson J (2003) Host specificity of the leaf beetle, Diorhabda elongata deserticola (Coleoptera: Chrysomelidae) from Asia, a biological control agent for saltcedars (Tamarix: Tamaricaceae) in the Western United States. Biol Control 27:117–147
Douhovnikoff V, McBride JR, Dodd RS (2005) Salix exigua clonal growth and population dynamics in relation to disturbance regime variation. Ecology 86:446–452
Drus GM, Dudley TL, Brooks ML, Matchett JR (2013) The effect of leaf beetle herbivory on the fire behaviour of tamarisk (Tamarix ramosissima Lebed.). Int J Wildland Fire 22:446–458
Dudley TL, Bean DW (2012) Tamarisk biocontrol, endangered species risk and resolution of conflict through riparian restoration. Biocontrol 57:331–347
Dudley TL, Bean DW, Pattison RR, Caires A (2012) Selectivity of a biological control agent, Diorhabda carinulata (Chrysomelidae) for host species within the genus Tamarix. Pan Pac Entomol 88:319–341
Enzel Y, Ely LL, Martinez-Goytre J, Vivian RG (1994) Paleofloods and a dam-failure flood on the Virgin River, Utah and Arizona. J Hydrol 153:291–315
González E, Sher AA, Anderson RM, Bay RF, Bean DW, Bissonnete GJ, Cooper DJ, Dohrenwend K, Eichhorst KD, El Waer H, Kennard DK, Harms-Weissinger R, Henry AL, Makarick LJ, Ostoja SM, Reynolds LV, Robinson WW, Shafroth PB, Tabacchi E (2017a) Secondary invasions of noxious weeds associated with control of invasive Tamarix are frequent, idiosyncratic and persistent. Biol Cons 213:106–114
González E, Sher AA, Anderson RM, Bay RF, Bean DW, Bissonnete GJ, Bourgeois B, Cooper DJ, Dohrenwend K, Eichhorst K, El Waer H, Kennard DK, Harms-Weissinger R, Henry AL, Makarick LJ, Ostoja SM, Reynolds LV, Robinson WW, Shafroth PB (2017b) Vegetation response to invasive Tamarix control in southwestern US rivers: a collaborative study including 416 sites. Ecol Appl 27:1789–1804
González E, Shafroth PB, Lee SR, Leverich GT, Real de Asua R, Sherry RA, Ostoja SM, Orr BK (2019) Short-term geomorphological and riparian vegetation responses to a 40-year flood on a braided, dryland river. Ecohydrology 12:e2152
Graf WL (1988) Fluvial processes in dryland rivers. Springer, New York
Grime JP (2001) Plant strategies, vegetation processes and ecosystem properties, 2nd edn. Wiley, Chichester
Henry AL, González E, Robinson WW, Bourgeois B, Sher AA (2018) Spatial modeling improves understanding patterns of invasive species defoliation by a biocontrol herbivore. Biol Invasions 20:3545–3562
Hughes FMR (1997) Floodplain biogeomorphology. Prog Phys Geogr 21:501–529
Hultine KR, Belnap J, van Riper IIIC, Ehleringer JR, Dennison PE, Lee ME, Nagler PL, Snyder KA, Uselman SM, West JB (2010) Tamarisk biocontrol in the western United States: ecological and societal implications. Front Ecol Environ 8:467–474
Hultine KR, Dudley TL, Koepke DF, Bean DW, Glenn EP, Lambert AM (2015) Patterns of herbivory-induced mortality of a dominant non-native tree/shrub (Tamarix spp.) in a southwestern US watershed. Biol Invasions 17:1729–1742
Ji W, Wang L, Knutson AE (2017) Detection of the spatiotemporal patterns of beetle-induced tamarisk (Tamarix spp.) defoliation along the Lower Rio Grande using Landsat TM images. Remote Sens Environ 193:76–85
Johnson TD (2013) Tamarix: Passenger or driver of ecosystem change? In: Sher AA, Quigley M (eds) Tamarix: a case study of ecological change in the American West. Oxford University Press, New York, pp 256–266
Kennard D, Louden N, Gemoets D, Ortega S, González E, Bean D, Cunningham P, Johnson T, Rosen K, Stahlke A (2016) Tamarix dieback and vegetation patterns following release of the northern tamarisk beetle (Diorhabda carinulata) in western Colorado. Biol Control 101:114–122
Legendre P, Gallagher ED (2001) Ecologically meaningful transformations for ordination of species data. Oecologia 129:271–280
Legendre P, Legendre L (2012) Numerical ecology, 3rd English edn. Elsevier, Amsterdam
Lite SJ, Bagstad KJ, Stromberg JC (2005) Riparian plant species richness along lateral and longitudinal gradients of water stress and flood disturbance, San Pedro River, Arizona, USA. J Arid Environ 63:785–813
MacDougall AS, Turkington R (2005) Are invasive species the drivers or passengers of change in degraded ecosystems? Ecology 86:42–55
Mahoney SM, Theimer TC, Johnson MJ, Foster JT (2017) Similar dietary but different numerical responses to nonnative tamarisk (Tamarix spp.) by two native warblers. Biol Invasions 19:1935–1950
Nagler PL, Glenn EP, Jarnevich CS, Shafroth PB (2011) Distribution and abundance of saltcedar and Russian olive in the western United States. Crit Rev Plant Sci 30:508–523
Nagler PL, Pearlstein S, Glenn EP, Brown TB, Bateman HL, Bean DW, Hultine KR (2014) Rapid dispersal of saltcedar (Tamarix spp.) biocontrol beetles (Diorhabda carinulata) on a desert river detected by phenocams, MODIS imagery and ground observations. Remote Sens Environ 140:206–219
Nagler PL, Nguyen U, Bateman HL, Jarchow CJ, Glenn EP, Waugh WJ, van Riper IIIC (2018) Northern tamarisk beetle (Diorhabda carinulata) and tamarisk (Tamarix spp.) interactions in the Colorado River basin. Restor Ecol 26:348–359
Oksanen J, Blanchet FG, Friendly M, Kindt R, Legendre P, McGlinn D, Minchin PR, O’Hara RB, Simpson GL, Solymos P, Henry M, Stevens H, Szoecs E, Wagner H. (2017) vegan: community ecology package. R package version 2.4-4. https://CRAN.R-project.org/package=vegan
Ostoja SM, Brooks ML, Dudley T, Lee SR (2014) Short-term vegetation response following mechanical control of saltcedar (Tamarix spp.) on the Virgin River, Nevada, USA. Invasive Plant Sci Manag 7:310–319
Palmquist EC, Ralston BE, Sarr D, Merritt DM, Shafroth PB, Scott JA (2017) Functional traits and ecological affinities of riparian plants along the Colorado River in Grand Canyon. Western North Am Nat 77:22–30
Pattison RR, D’Antonio CM, Dudley TL, Allander KK, Rice B (2011) Early impacts of biocontrol on canopy cover and water use of the invasive saltcedar tree (Tamarix spp.) in western Nevada. Oecologia 165:605–616
Paxton EH, Theimer TC, Sogge MK (2011) Tamarisk biocontrol using tamarisk beetles: potential consequences for riparian birds in the southwestern United States. Condor 113:255–265
Pearson DE, Ortega YK, Runyon JB, Butler JL (2016) Secondary invasion: the bane of weed management. Biol Cons 197:8–17
Pinheiro JC, Bates DM (2000) Mixed-effects models in S and SPLUS. Springer, New York
R Development Core Team (2017) R: a language and environment for statistical computing. R Foundation for Statistical Computing, Vienna
Richardson DM, Holmes PM, Esler KJ, Galatowitsch SM, Stromberg JC, Kirkman SP, Pysek P, Hobbs RJ (2007) Riparian vegetation: degradation, alien plant invasions, and restoration prospects. Divers Distrib 13:126–139
RiversEdge West, 2018. 2017–2018 Tamarisk Beetle Distribution Map. RiversEdge West, Grand Junction, CO (online). https://riversedgewest.org/sites/default/files/images/2018_Draft_Yearly_Distribution_Map.jpg Accessed on 02 Apr 2019
Rood SB, Goater LA, Gill KM, Braatne JH (2011) Sand and sandbar willow: a feedback loop amplifies environmental sensitivity at the riparian interface. Oecologia 165:31–40
Schwarzländer M, Hinz HL, Winston RL, Day MD (2018) Biological control of weeds: an analysis of introductions, rates of establishment and estimates of success, worldwide. Biocontrol 63:319–331
Shafroth PB, Beauchamp VB, Briggs MK, Lair K, Scott ML, Sher AA (2008) Planning riparian restoration in the context of Tamarix control in Western North America. Restor Ecol 16:97–112
Sher AA, El Waer H, González E, Anderson R, Henry AL, Biedron R, Yue P (2018) Native species recovery after reduction of an invasive tree by biological control with and without active removal. Ecol Eng 111:167–175
Sogge MK, Sferra SJ, Paxton EH (2008) Tamarix as habitat for birds: implications for riparian restoration in the southwestern United States. Restor Ecol 16:146–154
Stillwater Sciences (2014) Virgin River ecohydrological assessment: flood-scour analysis, vegetation mapping, and restoration suitability. Prepared by Stillwater sciences in collaboration with the Virgin River Watershed Restoration Science Team for the Walton Family Foundation, Freshwater Initiative Program, 144 p
Stromberg JC, Merritt DM (2015) Riparian plant guilds of ephemeral, intermittent and perennial rivers. Freshw Biol 61:1259–1275
Stromberg JC, Richter BD, Patten DT, Wolden LG (1993) Response of a Sonoran riparian forest to a 10-year return flood. Great Basin Nat 53:118–130
Stromberg JC, Bagstad KJ, Leenhouts JM, Lite SJ, Makings E (2005) Effects of stream flow intermittency on riparian vegetation of a semiarid region river (San Pedro River, Arizona). River Res Appl 21:925–938
Thomas MB, Reid AM (2007) Are exotic natural enemies an effective way of controlling invasive plants? Trends Ecol Evol 22:447–453
US Bureau of Reclamation (2020). https://www.usbr.gov/lc/region/g4000/hourly/mead-elv.html. Last Accessed on 17 Feb 2020
US Climate Data (2020) https://www.usclimatedata.com/climate/mesquite/nevada/united-states/usnv0138. Last Accessed on 23 Jan 2020
US Department of Agriculture-Natural Resources Conservation Service (USDA-NRCS), 2017. The PLANTS database. http://plants.usda.gov
Acknowledgements
The US Geological Survey, Invasive Species Program supported field data collection, analysis, and overall manuscript preparation. Eric Wahlig, Cherokee Nation Technologies, conducted the field topographic surveys. We thank the field crews for their dedicated work in sampling the vegetation, geomorphological and environmental variables. Any use of trade, firm, or product names is for descriptive purposes only and does not imply endorsement by the US Government.
Author information
Authors and Affiliations
Corresponding author
Additional information
Publisher's Note
Springer Nature remains neutral with regard to jurisdictional claims in published maps and institutional affiliations.
Electronic supplementary material
Below is the link to the electronic supplementary material.
Rights and permissions
About this article

Cite this article
González, E., Shafroth, P.B., Lee, S.R. et al. Combined effects of biological control of an invasive shrub and fluvial processes on riparian vegetation dynamics. Biol Invasions 22, 2339–2356 (2020). https://doi.org/10.1007/s10530-020-02259-9
Received:
Accepted:
Published:
Issue Date:
DOI: https://doi.org/10.1007/s10530-020-02259-9