
Abstract
Sustainable development is a concept that was introduced almost at the end of the twentieth century and quickly entered the literature. In recent years, the concept of sustainability and sustainable development (SD) has been successfully extended to mineral resources, but there have been few attempts to consider this concept in the ultimate pit limit (UPL) design. The problem of UPL determination is the first step in the open pit mine design and planning process. There are several mathematical, heuristic and meta-heuristic algorithms to determine UPL. The objective function in these algorithms is the maximization of total profit. Few models integrated some aspects of mining reclamation benefit and cost in the UPL design. However, there is not any comprehensive method for UPL design based on SD considerations. This paper provides a model for UPL designing based on SD indicators. According to this model, it is possible to integrate the SD principles in UPL design. The proposed model is explained by a simple 2D example and applied in an iron mine as a case study. Generally, using SD principles in UPL design may lead to a larger UPL than traditional method (profit maximization). The suggested method is appropriate for those ore bodies with no underground option. In cases with the underground option, before applying the suggested method, the transition level from surface to underground shall be determined.
Introduction
Open pit mining is a surface mining operation whereby ore, or waste, is excavated from the surface of the land. In the process of digging the surface of the land, a deeper and deeper pit is formed until the mining operation ends (Amankwah 2011). The main issue in the design of open pit mines is that of determining the optimum ultimate pit limit (UPL) of a mine. Based on common definition, the UPL of a mine is that contour which is the result of extracting the volume of material, which provides the total maximum profit whilst satisfying the operational requirement of safe wall slopes. The UPL gives the shape of the mine at the end of its life. Optimum pit design is important in all stages of the open pit life such as feasibility study stage, operating phase and end of a mine’s life. The UPL problem has been efficiently solved using the Lerchs–Grossmann graph theoretic algorithm (Lerchs and Grossmann 1965) or Picard’s network flow method (Picard 1976). These methods are based on a “block model” of an orebody.
Determination of UPL based on profit or net present value (NPV) maximization does not coincide with sustainable development (SD) issues. However, if one tries to consider SD in the UPL determination, he must take into account other aspects of SD other than economic aspects.
The United Nations World Commission on Environment and Development (WCED) in its 1987 report “Our Common Future” defines sustainable development as: “Development that meets the needs of the present without compromising the ability of future generations to meet their own needs” (WCED 1987). In mining, there are a few international efforts that study some SD aspects on mine design. For the design of UPL, there is not any integral approach taking into account environmental, economic and social aspects. In most cases, the focus is on one of the three aspects.
In this regard, most previous studies considered the environmental aspect of SD during mine design. A major weakness of many sustainability interpretations and assessments is that “sustainable development” was used interchangeably with “environmental management” or “environmental protection”. In such cases, there is the propensity to resolve only one type of problem—environmental deterioration—while ignoring the importance of economic and social goals, two equally important pillars of SD (Hilson 2000). For example, Burgher and Erickson (1984) developed a model for minimizing a coal mine reclamation cost and maximizing NPV using a linear programing technique. They declared that postponing mine reclamation costs leads to an increase of mine NPV. But they did not pay attention to other aspects of SD. Coccetta and Kelsey (2001) declared that there are two basic requirements for mine site rehabilitation: (i) that the site is safe, stable and non-eroding at the end of the mine life; and (ii) pollutants such as acid-producing waste must be buried and capped with impermeable material. They developed a mathematical formulation for reshaping the mined land surface problem (the first requirement). They only considered the environmental aspect of SD. King (1998) showed how rehabilitation and closure costs of mines impacted the production rate and cutoff grade strategy for a mining operation. Rashidinejad et al. (2008a) developed a model for optimum cutoff grades that not only rely on economic aspects but also minimize adverse environmental impact in the form of acid mine drainage elimination or mitigation against the approach of postponing the restoration/reclamation activities at the end of the project’s life. Rashidinejad et al. (2008b) developed another methodology that maximizes the profitability of a mining project and minimizes its adverse environmental impacts simultaneously. The acid generating potential of waste materials and tailings in each alteration zone can be estimated by laboratory and in situ tests. They developed a modified cutoff grade model with the concept of elimination or reduction of the acid mine drainage (AMD) in the original place. Four coefficients that discriminate between acid generating and non- acid generating waste material and tailings were incorporated into Lane’s model to ensure optimality of cutoff grades. Gholamnejad (2009) inserted mine rehabilitation cost into the optimization process and developed a new mathematical model based on Lane’s method. Results of the application of this method show that considering rehabilitation cost can decrease the cutoff grade. Dogan et al. (2009) studied the effects of different block size on reserve, waste amount and distributions of chemical components such as %CaO, %MgO in a quarry located at Darica, Istanbul. This mine was used to supply raw material for a cement manufacture. Scenarios with different block dimensions were created and compared. The results showed that changing block size led to different reserve, waste amount, chemical distribution, and estimation of quality of cement raw material. Craynon and Karmis (2011) tried to incorporate sustainability into Appalachia coal mine design with large surface operations by utilizing geographic information system (GIS) tools and analysis of on-the-ground issues related to sustainability. Badiozamani and Askari-Nasab (2014) proposed an integrated long-term mine planning model that included tailings capacity and reclamation material requirements. They developed a mixed integer linear programing model to test the performance of their proposed model.
Besides the environmental aspects, there are few studies that considered some social aspects of SD in mine design. Gholamnejad and Mojahedfar (2010) developed a mathematical model for determination of the largest pit with the non-negative net profit in open pit mines. They declared that this strategy can increase the life of the mine, which is in accordance with the SD principals. Ataee-pour et al. (2012) developed a mathematical model for determination of UPL with simultaneous maximization of profit and ore content. They introduced a new characteristic of ore deposits named “expansion potential” that is a guide for designers to select the UPL on the basis of resource efficiency and profitability.
A comparison of the mentioned studies related to UPL designs is listed in Table 1. As a result, there is not any comprehensive study that includes all aspects of SD in UPL design. Moreover, the SD indicators are used very limitedly in all aspects. For example, in all studies, only profit and NPV have been used as economic indicators. Also the social aspect is neglected in most studies. In addition mine reclamation is the only important issue of environmental aspects that has been studied by researchers.
UPL determination based on SD aspects
General description
As mentioned above, the general method for UPL determination is based on economic principles while other aspects of SD that are ignored or paid very little attention. According to the SD concepts there are three objectives that need to be accomplished:
-
1.
Maximizing social benefit
-
2.
Maximizing economic benefit and
-
3.
Minimizing environmental impact
In this paper, a model is developed to consider the economic and social benefits and minimize the negative environmental impacts of an open pit mine during UPL design and before exploitation. Figure 1 shows the procedure of the proposed model. The suggested model will be explained via a 2D example, step by step.

The procedure of UPL design based on SD consideration
Example
To show the effectiveness of this method to determine a pit limit according to SD requirements, consider a simple 2D block model given in Fig. 2 (geological block model). The block dimensions are assumed as 1 m × 1 m × 1 m in width, length and height, respectively. The blocks density (waste and ore) is assumed to be equal to 1 ton per cubic meter.

A 2D hypothetical geological block model (numbers are ore grade)
If the price of the product is 80 units per ton, and the costs of mining and processing are 4 and 12 per ton respectively, then one could easily determine the block economic values and economic block model (Fig. 3). The cut off grade is 0.2. The blocks with grade less than 0.2 are considered waste blocks. According to Fig. 3, the total ore block in the orebody is 26, and the average grade of the orebody is 0.35.

Economic block model corresponding to Fig. 2 (values are rounded)
Each block can take one of two values:
Step 1 (a) Determination of maximum profit pit (UPL1)
The first step is identification of the UPL subject to maximum profit. It is a general method for UPL selection and could be found easily through the following equations. Equation 1 is the objective function, used to maximize the profit of the pit. Equations 2 and 3 are constraints of the model. Equation 2 defines the slope requirements. This problem was solved by MATLAB R2011a software tool and the results are shown in Fig. 4. According to Fig. 4, the small pit containing hatched blocks is the ultimate pit limit with the maximum profit (UPL1).

UPL1 (pit with maximum profit) and UPLn (pit with the maximum ore content and approximately zero profit)
Subject to: Pit wall slope constraint:
where c ij is the block economic value, x ij a binary variable that is 1 if the block located at row i and column j is extracted, otherwise it is 0.
Determination of maximum ore content pit and zero profit (UPLn)
The mathematical model of UPL determination is given as Eqs. 4–6. Equation 4 is the objective function used to maximize the ore content of the pit. Equations 5 and 6 are constraints of the model. Equation 5 defines the slope requirements and Eq. 6 makes sure that the profit of the pit is more than the minimum required.
Subject to: Pit wall slope constraint:
where \(T_{ij}\) is the tonnage of ore in block \(b_{ij}\) and \(P_{L}\) is the minimum required profit. Other parameters were previously explained.
By changing the amount of \(P_{L}\), it is possible to determine a pit limit that provides the maximum amount of ore with the given amount of profit. Then setting \(P_{L}\) equal to zero, one could define a pit with the maximum ore content and a profit of approximately zero. This pit is called UPLn and is shown in Fig. 4.
Step 2. Determination of intermediate pits
Afterward, by decreasing the amount of \(P_{L}\) in 5 % steps (5 % of the maximum profit that is obtained in step 1-a), it is possible to determine a set of intermediate pits.
The intermediate pits are shown in Fig. 5. By applying the model in Eqs. 4–6, one could obtain 9 distinct UPLs. UPL1 is the one with the highest profit, and UPLn or UPL9 is the one with the highest amount of ore content and a profit of approximately zero.

Intermediate pits
Step 3. Selection of SD indicators
Based on the procedure illustrated in Fig. 1, one of the steps in the proposed model is the use of SD indicators. As the profit is the main economic indicator in the traditional model of UPL determination, for other SD aspects one needs other indicators. The indicators selection is very important and one needs to consider all stakeholder ideas regarding the three pillars of SD. Table 2 gives a summary of the SD indicators applied for UPL determination. According to Table 2, all the indicators are quantitative.
The aim of this paper is to apply SD indicators in UPL design. However, the indicators are selected based on some good experiences such as Azapagic (2004) and GRI (2005).
A number of issues are considered in the selection of indicators:
-
1.
The number of indicators should be limited in order to reduce the complexity in calculation;
-
2.
The indicators must be quantitative and measurable and
-
3.
Those indicators, for which values were equal for all UPLs, were removed from the indicator list.
Step 4. Weighting indicators in each group and weighting groups
There are three groups of indicators shown in Table 2, including economic, environmental and social indicators. The value of indicators is determined for each UPL separately (explained through the next steps). Then the rate of these indicators for each UPL is normalized and integrated. For obtaining the integrated sustainable development index the method developed by Krajnc and Glavic (2004) and Singh et al. (2007) is used. They proposed a hierarchical method similar to the one shown in Fig. 6.

According to Fig. 6 for calculation of the integrated sustainable development index, one needs weighting allocation in two situations including weights allocated for individual indicators in each group, and for three sub-indexes.
Weight Determination of the selected SD indicators is important and decision makers must decide about the weight of each indicator. This is a case dependent process and it also depends on decision makers priorities. These weights should be determined carefully. In this paper equal weights are used for indicators and also for three sub-indexes. The assigned weights for indicators and sub-indexes are shown in Table 3.
Step 5. Calculation of indicators for UPLs
In the next step, the values of indicators are determined separately for each possible UPL and they are presented in Table 4. For a better understanding, the calculation of indicators values for UPL3 (Fig. 7) is presented in Appendix 1. The assumed ore production per year is 3 ore blocks.

Boundary of UPL3
Step 6. Normalization of indicators
Based on Table 4, it is observed that indicators are expressed in different units. One way for solving this problem is normalizing. There are some kinds of methods for normalizing. The applied method that is more appropriate could be explained as follows:
If an indicator has positive impact (all economic and social indicators exception safety), it would be normalized through Eq. 7 (modified of Krajnc and Glavic 2004).
And for those indicators with negative impact (all environmental indicators and safety), Eq. 8 is applied for normalization.
where symbols are: \({\text{I}}_{\text{ij}}^{ + }\) is Indicator whose increasing value has positive impact on the perspective of sustainability, \({\text{I}}_{\text{ij}}^{ - }\) is indicator whose increasing value has negative impact on the perspective of sustainability \({\text{I}}_{ \hbox{min} }^{ + }\) is the indicator with minimum value and positive impact on the sustainability, \({\text{I}}_{ \hbox{min} }^{ - }\) is a indicator with minimum value and negative impact on the sustainability, \({\text{I}}_{ \hbox{max} }^{ + }\) is a indicator with maximum value and positive impact on the sustainability, \({\text{I}}_{ \hbox{max} }^{ - }\) is a indicator with maximum value and negative impact on the sustainability, \(I_{\text{N}}^{ + }\) is a normalized indicator whose increasing value has positive impact on the sustainability, \(I_{\text{N}}^{ - }\) is the normalized indicator whose increasing value has negative impact on the sustainability, i is the sustainable development indicator, i = 1, 2, …,12, j is the intermediate (alternative) pits, j = 1, 2, …,9
Using the above-mentioned formula, the normalized value of indicators is presented in Table 5.
Step 7. Calculating the integrated sustainable development index (I SDI)
According to Fig. 6, for calculating the integrated sustainable development index (I SDI), one initially needs the calculation of sustainability index (I S,j ) for each group of sustainability indicators j. The summation of all sub-indexes shows the score of that particular case. For example, calculation of ISDI for UPL3 based on the calculation procedure (Fig. 6), and the assigned weight for indicators and sub-indexes (Table 3) and value of normalized indicators for each pit (Table 5) is provided in the following:
The results of ISDI calculation for all UPLs are presented in Fig. 8.

Final score of the pits based on ISDI
Step 8. Selection of the best UPL
Using ISDI, the decision maker could determine the ranking of pits and select a pit with the highest score. According to Fig. 8, it is obvious that UPL5 is the one with the highest score; therefore UPL5 is selected as the final pit (Fig. 9). UPL5 is between the pit with the highest profit (UPL1) and the pit with the highest ore content and approximately zero profit (UPLn).

UPL5 is the best UPL based on SD aspects (with highest ISDI score)
Case study
In order to evaluate the suggested model for ultimate pit limit determination, Jalalabad iron ore deposit was selected as a case study. The deposit is located 35 km northwest of Zarand in Kerman Province south of Iran (Fig. 10) between latitudes 31°00′12″N–31°1′18″N and longitudes 56°25′00″E and 56°25′42″E. The average altitude of Jalalabad site is 1950 m. Zarand has a desert climate with hot summers and relatively cold winters. Throughout the year, there is virtually no rainfall in Zarand. The average annual temperature in Zarand is 16.6 °C and the average annual rainfall is 126 mm. Jalalabad is a large iron ore deposit and its reserve is 200,000,000 metric tons with average grade of 44.5 %. Iron mineralization occurs in a volcanic-sedimentary sequence of Rizu series. The main ore mineral is magnetite, which is located in depth, and has been oxidized to hematite in higher levels and along the fractures. The characteristics of iron mineralization at Jalalabad are comparable to hydrothermal type iron deposits. Iron mineralization in Jalalabad is related to intra-continental rift and probably the source of mineralizing fluid is from sodic alkaline magmatism that is related to uplift of the asthenosphere and partial melting of mantel (Mehrabi and Karimi 2004). The situation of orebody and ground surface is shown in Fig. 11.

Jalalabad iron orebody location

Ground surface and orebody view
Geological block model
The geological block model was determined by Datamine Studio3 software. The information of the geological block model is gathered from 86 drillholes with a total length of 25615 meters and analysis of 3055 core samples. The block model contains about 300,000 blocks (waste and ore) with the block dimensions of 25 m × 25 m × 12.5 m in length, width and height respectively. Generally the block height is equal to the bench height in the mining design. Waste bulk density is 2.6 ton/m3 but ore bulk density is variable and depends on ore grade (g):
Figure 12 displays a vertical slice of the geological block model.

A vertical slice of the geological block model
Economic block model
The geological block model data of the orebody imported from Datamine Studio3 to the NPV Scheduler software. Based on the following data and using NPV Scheduler software, the Jalalabad economic block model was determined.
A cutoff grade of 20 % is applied to the block model to generate a value for each block. The Assumed Final product of the mine is crushed iron ore with an average grade of 40 %. The final product will be sold to a processing factory that is setting up and run by another owner.
-
Final product price is 800,000 Iranian Rial (IR) per ton;
-
Ore mining cost is 180,000 IR per ore ton;
-
Waste mining cost is 96,000 IR per waste ton;
-
Crushing cost is 8,000 IR per ton of ore;
-
The mining cost for ore or waste located at bench k is calculated using the following formula: Mining Cost = Reference Mining Cost + (k-Reference Bench) × Incremental Cost
-
Reference Bench = 30; Incremental Cost = 1000 IR
-
Bench face slope is 70°
-
Ultimate pit wall slope is presented in Table 6:
Table 6 Ultimate pit wall slope
Step 1 Determination of UPL with maximum NPV (UPL1)
The NPV Scheduler software locates the economic limits to mining an open pit (the ultimate pit) for any defined set of economic parameters. Once the ultimate pit has been located, the blocks inside the pit are sequenced to deliver either the highest possible net present value over the life of the mine.
Based on the economic block model and the following information, NPV Scheduler software finds the optimal ultimate pit limit for which the objective function is profit maximization (UPL1). The mining capacity was assumed as 7,000,000 ton ore per year
-
Discount rate is 20 % (It is applied based on Iran’s economic condition);
-
Working days per year are 365;
-
Ore recovery is 90 %.
This is usual method for UPL determination. The plan views of natural land surface and UPL1 are illustrated in Fig. 13a, b.

Plan views of the natural land topography, UPL1 and UPLn. a Topography of the Natural surface (before mining), b pit with maximum profit (UPL1), c pit with maximum ore content and approximately zero profit (UPLn)
Determination of (UPLn)
UPLn and also incremental pits are obtained using the sensitivity analysis tools that are available in the NPV Scheduler software. Generally, for NPV optimization, the NPV Scheduler software needs to generate incremental pits. In the Ultimate Pit Settings dialog of the software, there is a sequencing tab. If Optimize NPV is chosen, the program will find an NPV optimal extraction sequence. In order to search for the optimal extraction sequence, one must set parameters that control the phases generation. Two parameters allow the user to control the number and size of phases to be generated by the program.
-
The “Maximum revenue factor” is a factor defining the largest phase (ultimate pit). Revenue factors larger than 100 % usually result in ultimate pits larger than the pit corresponding to the reference prices and costs. This is convenient for sensitivity analysis. If the goal is just to obtain NPV optimal extraction sequence, set the factor to 100 %. Note that setting a revenue factor to more than 100 % may result in an ultimate pit larger than the one corresponding to the reference prices and costs.
-
The incremental factor defines a percentage reduction in revenues between two consecutive phases.
Using the mentioned tools, one can find the value of “Maximum revenue factor” so that the UPL profits will be zero or approximately zero. In order to the obtain UPLn for Jalalabad orebody, after 10 trial and errors, we found 375 % for the “Maximum revenue factor”. The “Incremental factor” was selected as 5 %. At the end of this step, the largest pit was obtained with maximum ore content and approximately zero profit (Fig. 13c). It must be mentioned that with more than 375 %, for “Maximum revenue factor”, the UPL profit is changed to negative.
Step 2: Determination of intermediate pits
In the step 1, 50 intermediate pits that are located among the UPL1 and UPLn were determined. Information related to intermediate pits is displayed in Table 7.
Step 3. Selection of SD indicators
The SD indicators have been presented earlier in Table 2.
Step 4. Weighting indicators in each group and weighting groups
Weights of indicators and sub-indexes have been presented earlier in Table 3.
Step 5. Calculation of UPLs indicators
The value of indicators is determined for each possible UPL separately, as shown in Table 8.
For a better understanding, the calculation of indicators values for UPL3 is presented here. It must be mentioned that all data are based on Iran’s laws and conditions. Plan view of UPL3 is shown in Fig. 14.

Plan view of UPL3
-
(a)
Waste production = (mine waste + processing waste)
Mine waste = 425409649 ton; ore = 120514237 ton; average of ore grade = 0.4075; recovery = 0.9; Waste production = (425409649 + 120514237 × (1 − 0.4075 × 0.9)) = 501724050 ton.
-
(b)
Land use = (Surface of natural land inside pit collar area before pit opening + land area that is covered by waste dumps + other area (such as administrative buildings, crusher building, etc.)); Other area is fixed (crusher area + administrative building + …) = 1,000,000 m2; Pit collar area = 1,441,667 m2; Assume that there is one waste dump in the mine site area with a wall slop 45 degrees. Land area that is covered by waste dumps is calculated by Eq. 12 (Appendix 1).
Waste bulk density after swelling = 1.70 ton/m3; Bulk density of waste from ore processing = 1.5 ton/m3; Volume of wastes = (425409649/1.7 + (120514237 × (1 − 0.4075 × 0.9))/1.5 = 293,967,599; According to Eqs. (8) and (10): r = 1404 m; A = 1,346,657 m2; Land use = 1441667 + 1,346,657 + 1,000,000 = 3,788,324 m2.
-
(c)
Reclamation = (pit area) + (outer surface area of waste dump) + other area
All surfaces affected by mining or generated by mining (new surface) will be restored with local species of grasses and shrubs when all mining activity is finished. Also, all buildings are demolished and their land is prepared for planting. Due to the very steep faces in mine benches, only bench’s floor and pit floor are appropriate for planting. Therefore, assumed available cultivation area in the pit is 80 % of pit collar area. Also the assumed outer surface of the waste dump is appropriate for cultivation.
Pit land use = 1441667 × 0.8 = 1,153,333 m2; Other area is fixed (crusher area + administrative building + …) = 1000000 m2; According to Eqs. (10) and (11), the waste dump outer surface area is 1,904,461 m2; Reclamation area of UPL3 = 1,153,333 +1,904,461 + 1,000,000 = 4,057,794 m2.
-
(d)
Energy Consumption = [fm × (ore quantity) + fw × (waste quantity)]
Table 9 shows the energy consumption during iron ore mining. It is used for calculation of ore energy consumption. Assumed energy consumption of waste rock is equal to relative density of waste and then ore.
Table 9 Energy consumption during the mining and processing of iron ore (De Palacios 2011) Ore transportation length: 1,750 m; Waste transportation length: 1,950 m; fm = (1.8 + 3.06 + 6.66 + (53.66) × 1.75 + 0.83) = 106.225 Mj/ton; fw = (1.8 + 3.06 + 6.66 + (53.66) × 1.95) × (waste bulk density/orebulk density); Waste bulk density = 2.6 ton/m3; ore bulk density = 3.66 ton/m3; fw = 79.26 Mj/ton; Energy Consumption = [120514237 × 106.225 + 425409649 × 80.84)] = 47,886, 475, 876 Mj.
-
(e)
Job security = Life of mine = (ore in pit/ore production per year)
Life of mine = 120514237/7000000 = 17.22 year.
-
(f)
Safety = Depth of mine = (highest bench level − pit floor level)
Safety = 1,975 – 1,600 = 375 m.
-
(g)
Resource efficiency = (ore tonnage × average of ore grade)/(orebody tonnage × average of orebody grade)
Resource efficiency = (120,514,237 × 0.4075)/(200,000,000 × 0.445) = 0.552 %.
-
(h)
Number of employees = (mine personnel + crusher personnel + …)
For estimation of number of employees, the updated O’Hara cost estimator is used. According to O’Hara and Suboleski (1992):
T = tons of ore milled/day; T o = tons of ore mined/day; T w = tons of waste mined/day; T p = T o + T w = total material mined/day; Number of mine personnel: \(N_{\text{op}} = 0.024T_{\text{p}}^{0.8}\); Number of mills treating personnel: \(N_{\text{ml}} = 7.2T_{{}}^{0.3}\), but there is only a primary crusher and there is not any milling plant. Therefore, based on our experience we consider 30 employees for N mI. Number of services personnel: N sv = 25.4 % of (N op + N mI); Number of administrative and technical personnel: N at = 11 % of (N op + N mI + N sv); Total employees: N t = N op + N mI + N sv + N at; T o = 7000000 ton/365 day = 19178 ton/day; T w = 425409649 ton/(17.22 year × 365 day) = 67698 ton/day; T p = T o + T w = 19178 + 67698 = 86876 ton/day; T = T o = 19178 ton/day N op = 304; N mI = 30; N sv = 83; N at = 46; N t = 463; Number of employees = 463.
-
(i)
Net present value (NPV)
Net present value (NPV) is a formula used to determine the present value of an investment by the discounted sum of all cash flows received from the project. As described in the text, the NPV Scheduler is able to calculate NPV for UPLs. According to Table 7, the NPV for UPL3 is equal to 16,634,774,796,940 IR.
-
(j)
Post mining income = [reclaimed land × ISL − land use × IPL]
IPL = income of reclaimed land after mining ($/m2); ISL = income of land before mining (($/m2); Assumed IPL = ISL = 100,000 IR/Hectare per year from land rented to ranchers; Post mining income = (4,057,794 − 3,788,324) × 10,000,000 = 2,694,702 IR/year.
-
(k)
Taxes generation = sum of all taxes and duties
Income tax rate = 25 %; Tax exemption for mining activity: 10 years; Taxable income: (23,974,344,625,760 × 1.25) × ((17.22 − 10)/17.22) = 12,561,230,901,969 IR; Tax on income = 12,564,951,021,568 × 0.25 = 3,140,307,725,492 IR; Mineral Tax = ore × average of iron ore grade × mineral tax rate per percentage of ore grade; Mineral Tax = (120,514,237 ton × 40.75) × 1000 IR (according to Iran annual budget law in 2013) = 4,911,155,157,800 IR; Wage tax for mine = number of mine employee × taxable wage per month × wage tax rate × 12 month × mine life; Average wage for iron ore employee in Iran per month: 9,093,074 IR (according to Iran statistic organization); Wage free on tax = 5,000,000 IR (according to Iran annual budget law in 2014); Taxable wage = (9,093,074 − 5,000,000) = 4,093,074 IR; Tax rate from zero to 5,000,000 IR: 10 % (according to Iran annual budget law in 2014); Total wage tax for mine = (463 × 4,093,074 × 0.1 × 12 × 17.22) = 39,160,207,166 IR; All duties = 0; Taxes generation = 3,141,237,755,392 + 4,911,155,157,800 + 39,160,207,166 = 8,090,548,551,517 IR.
-
(l)
Mining indirect benefit = sum of all mining indirect benefit
20 % of mineral tax (4,911,155,157,800 IR for UPL3) will be return for creation of infrastructures in the local community; Assumed 80 % labor wage (699,066,856,137 IR for UPL3) is spent in the local community; After closing of the mine, almost all mining laborers (463 personnel for UPL3) have a special skill. The training cost for any person is considered as 10,000,000 IR. All training costs for the mine personnel will return to the local community.
Income of indirect job creation for employees: Studies conducted by the Ministry of Mines and Energy’s Secretariat for Geology, Mining and Mineral Processing of Brazil (third iron ore producer in the world) show that the multiplier effect of job creation is 1:13 in the mining sector, i.e., for every job created in the mining sector another 13 jobs (direct jobs) are generated along the supply chain (IBRAM, 2012). 30 personnel in primary crusher are related to initial processing, and 433 personnel are working in UPL3 therefore the mining indirect job for UPL3 is equal to: (463 − 30) × 13 = 5629 jobs.
Mining indirect benefit = [0.2 × 4,911,155,157,800 IR + 0.8 × 699,066,856,137 IR + 463 × 1,000,000,000 IR + (5629 × 9,093,074 IR × 12 month × 17.22 year] = 11,093,098,140,243 IR.
Step 6. Normalization of indicators
Normalized indicators are displayed in Table 10.
Step 7
All ISDI values were calculated based on the procedure of Fig. 6 and information of Table 3 (assigned weight for indicators and sub-indexes) and Table 10 (values of normalized indicators for each pit). Ranked UPLs by ISDI are provided in the Fig. 15. For a better description of method, ISDI calculation for UPL3 presented here:

Final score of the pits based on ISDI for case study
Step 8. Selection of the best UPL
Based on Fig. 15, UPL12 is selected as a UPL with highest ISDI. In accordance with Fig. 15, UPL12 has earned a good rating in each of SD aspects. Plan view of UPL12 is shown in Fig. 16.

Plan view of the selected pit (UPL12)
Discussion
Selection of optimum UPL using the traditional method leads to finding a pit with the maximum profit that is named UPL1 in this paper. Also based on the SD concepts, one can find the pit with highest ISDI, that is UPL12 for Jalalabad orebody. UPL1 is the smallest pit and UPL50 (with maximum ore content) is the largest pit. UPL12 which is selected based on SD aspects is located between them. According to the normalized values of environmental indicators and also their resultant in Fig. 17, UPL1 obtains the highest score in environmental aspect. It means that the environmental impact of smaller pits is less than larger pits. The larger pits need more land for mining activities and also waste production from a larger pit is more than small pits. Reclamation cost depends on land use area and therefore larger pits need more cost for reclamation. The material (waste and ore) extracted from larger pits is more than smaller pits and consequently larger pits consume more energy. In the case of stripping ratio (Fig. 18), a larger mine has higher stripping ratio. Stripping ratio is 3.3 for the smallest pit (UPL1) and increases gradually to 5.4 for the largest pit (UPL50). This means that for 1 ton of ore mined in UPL1 and UPL50, extraction of 3.3 and 5.4 ton waste is needed respectively. The stripping ratio for UPL12 is 3.9.

Normalized value of environmental indicators for case study UPLs and their resultant

Stripping ratio for case study UPLs
The comparisons among the normalized value of social indicators and also their resultant between UPL1 and other pits are presented in Fig. 19. With the exception of safety, other social indicators of UPL50 obtained the highest score. When the production per year is fixed, the life of the mine for larger pits will be extended. This means job security for employees. Larger and deeper pits need more waste extraction and therefore the number of employees will be increased. There is more ore in the larger and deeper pits and more parts of the orebody are extractable. This is compatible with Jalalabad deposit geology, which mineralization is formed in depth. On the other hand, safety problems in larger and deeper pits are more than shallow pits. Therefore, UPL1 obtained the highest score of safety. The resultant of four social indicators illustrates UPL50 and UPL1 taking the highest and lowest scores respectively.

Normalized value of social indicators for case study UPLs and their resultant
The comparisons among the normalized values of economic indicators and also their resultant between UPL1 and other pits are presented in Fig. 20. UPL1 takes the highest score of NPV and for UPL selection in the traditional method it is a unique criterion. Also it seems that during UPL selection in the traditional method, the owner’s attention to profit and other economic aspects of mining is neglected. But mining has a lot of stockholders such as the government and the local community and part of the mining benefit has to be shared between them. Therefore, three other economic indicators are provided to include more stockholders. In this regard, UPL50 obtained the highest score of “mining indirect benefit” and “post mining income” indicators. Generally, mines that have a reclamation plan can take a post mining income and larger mines have more income. Mining has a lot of indirect benefit which lead to the development of the local community and country. Establishing the value added chain of mining is important for indirect benefits. Because of achieving to more extractable ore in a larger pit, a more indirect benefit is available. In Fig. 20, UPL17 obtained the highest score of the tax generation indicator. As a result of tax exemption for 10 years, the shape of the curve is different. In the small pits that have a short mine life, tax exemption causes tax amount to decrease. The resultant of four economic indicators illustrates that UPL21 and UPL1 take the highest and lowest scores, respectively.

Normalized value of economic indicators for case study UPLs and their resultant
Generally, in the selection of UPL based on SD, the NPV or profit is decreased but ore tonnage is increased. The “profit reduction” and “ore content growth” curves for all intermediate pits are shown in Fig. 21. UPL12 that is selected based on SD principles leads to 11 % reduction in profit and 25 % increase in ore content compared with UPL1 (with the maximum profit in the traditional method).

Profit reduction and increase of ore content in the incremental pits
UPL selection in the new method depends on decision makers preferences and they have to clarify two questions:
-
How much of the profit from mining is appropriate for the mine owner?
-
How to assign the weight for three pillars of SD?
Mining is an economic activity and the main goal of the mine investor similar to other businesses is to achieve a minimum allowable rate of return (MARR). The UPL selected based on SD principles may not satisfy the investor’s MARR. Thus, for application of the suggested method, the following conditions shall be considered:
-
If the selected UPL’s internal rate of return (IRR) is more than MARR of the project, then the results are valid.
-
If the selected UPL’s IRR is less than MARR of the project, then one has to select a UPL for which the IRR is approximately equal to MARR of the project. In the proposed method also weight assignment is very important. We assign same weight for all pillar of SD because it follows the principles of sustainable development. According to the article 8 of Agenda 21, governments should adopt a national strategy for sustainable development. This strategy should build upon and harmonize the various sectoral economic, social and environmental policies and plans that are operating in the country (UN 1992). It means that priority of SD pillars is depended on policy makers and may vary in any sector and any country. In order to study the weighting effect on UPL selection, different sets of weights for three pillars of SD are considered and the best ISDI is determined for any set (Table 11). According to Table 11, the results are very different and they strongly depend on the relative assigned weights to SD pillars. If higher weight is assigned to the environmental aspect, the smaller UPLs are selected that have fewer environmental impacts. Assigning higher weight to the social aspect means choosing the larger UPLs that provides greater social benefits. If higher weight is assigned to the economic aspects, relatively larger pits are selected that have more economic benefits.
Table 11 UPLs obtained from different weights of three pillars of SD
In accordance with Fig. 15, UPL12 that is selected by the proposed method (with the equal weights) covered all three aspects of SD very well. As the highest ISDI represents the best pit, it should be noted that all three SD pillars must contribute effectively. Therefore, the proposed method with equal assigned weight to all three aspects of sustainable development ensures a proper answer.
It is mentioned that when the whole orebody is contained in the UPL1, pit extension is not possible. Therefore, UPL1 = UPLn and ultimate pit limits based on both methods (traditional method and proposed method) are same.
Conclusions
SD consists of three major pillars including economic, environmental, and social. Determination of UPL with the highest profit (traditional method) may not coincide with the SD concept. In this paper, a procedure was introduced to determine an ultimate pit limit that meets all SD aspects. Twelve SD indicators were developed that covered more aspects of SD. Indicators of three dimensions of sustainability were integrated into the ISDI. The procedure was tested on a 2D and 3D block model. The results showed that the approach was quite applicable of determining the UPL considering the SD aspects. The results also showed that when the mine investor ignores a little of the mine profit, improvement in all aspects of SD in mining is possible. The proposed method depends on preferences of decision makers regarding weighting of indicators for three pillars of SD. In this paper, the equal weight for three pillars of SD which is appropriate with conceptual of SD is applied. Also selection of the best UPL based on ISDI depends on “minimum allowable rate of return” of the mining company. Generally speaking, the UPL selected by the proposed method is deeper and larger than the traditional UPL. Also, it has higher waste, higher ore, lower NPV and higher social benefit than the traditional UPL. Finally, it must be noted that the suggested method is appropriate for those ore bodies with no underground option. In cases with the underground option, the transition level from surface to underground shall be determined.
References
Amankwah H (2011) Mathematical optimization models and methods for open-pit mining. Linköping Studies in Science and Technology, Dissertations No. 1396, Linköping University
Ataee-pour M, Rahmanpour M, Adibee N (2012) Ultimate pit limit optimization with simultaneous maximization of profit and ore content. In: 4th Iranian mining engineering conference, Tehran University, Iran, pp 145–151
Azapagic A (2004) Developing a framework for sustainable development indicators for the mining and minerals industry. J Clean Prod 12:639–662. doi:10.1016/S0959-6526(03)00075-1
Badiozamani MM, Askari-Nasab H (2014) Integration of reclamation and tailings management in oil sands surface mine planning. Environ Model Softw 51:45–58. doi:10.1016/j.envsoft.2013.09.026
Burgher EK, Erickson E (1984) The optimization of coal mine production schedules using linear programming: an example that determines the effects of reclamation costs and interest rates. Min Sci Technol 2:69–78. doi:10.1016/S0167-9031(84)90223-8
Coccetta L, Kelsey PJ (2001) Models for mine site rehabilitation. In: International conference on models and simulation, pp 2155–2160
Craynon J, Karmis M (2011) Optimizing coal mine design for sustainable development at large surface coal mining operations in Appalachia. 5th international conference on sustainable development indicators in the mineral industry (SDIMI). Aachen, Germany, pp 75–82
De Palacios LDLT (2011) Natural resources sustainability: iron ore mining. Dyna 78(170):227–234. http://scielo.org.co/pdf/dyna/v78n170/a27v78n170.pdf. Accessed 30 Nov 2014
Dogan T, Bascetin A, Sertabipoglu Z (2009) The effects of changing block size on ore quality control and environmental impacts. 8th international Symposium on Mine Planning and Equipment Selection (MPES). Alberta, Canada, pp 301–310
Gholamnejad J (2009) Incorporation of rehabilitation cost into the optimum cut-off grade determination. J South Afr Inst Min Metall 108:89–94
Gholamnejad J, Mojahedfar AR (2010) Determination of the largest pit with the non-negative net profit in the open pit mines. J Min Environ 2(1):45–52
GRI (2005) GRI mining and metals sector supplement pilot version 1.0. Global reporting initiative. http://icmm.com/document/204. Accessed 30 Nov 2014
Hilson G (2000) Sustainable Development policies in Canada’s mining sector: an overview of government and industry efforts. Environ Sci Policy 3:201–211. doi:10.1016/S1462-9011(00)00086-1
IBRAM (Instituto Brasileiro De Mineracăo) (2012) Information and analysis on the Brazilian mineral economy. http://ibram.org.br/sites/1400/1457/00000380.pdf. Accessed 30 Nov 2014
King BM (1998) Impact of rehabilitation and closure costs on production rate and cut-off grade strategy. In: Conference on application of computers and operations research in the mineral industry (APCOM), London, UK, pp 617–629
Krajnc D, Glavic P (2004) Model for integrated assessment of sustainable development. Resour Conserv Recycl 43:189–208. doi:10.1016/j.resconrec.2004.06.002
Lerchs H, Grossmann IF (1965) Optimum design of open-pit mines. Trans Can Inst Min Metall 68:17–24
Mehrabi B, Karimi B (2004) Jalalabad iron deposit; example of hydrothermal iron deposit. In: Proceedings of 22nd geoscience symposium of Iran, Tehran, pp 125–134
O’Hara TA, Suboleski CS (1992) Costs and cost estimation. In: SME mining engineering handbook, 2nd edn, vol 1, Chap 6.3. Society for Mining, Metallurgy, and Exploration, United State pp 405–424
Picard JC (1976) Maximal closure of a graph and applications to combinatorial problems. Manag Sci 11(22):1268–1272. doi:10.1287/mnsc.22.11.1268
Rashidinejad F, Osanloo M, Rezai B (2008a) An environmental oriented model for optimum cut-off grades in open pit mining projects to minimize acid mine drainage. Int J Environ Sci Technol 5(2):183–194. doi:10.1007/BF03326012
Rashidinejad F, Osanloo M, Rezai B (2008b) Cutoff Grades optimization with environmental management; a case study: Sungun copper project. IUST Int J Eng Sci 19(5–1):1–13
Singh RK, Murty HR, Gupta SK, Dikshit AK (2007) Development of composite sustainability performance index for steel industry. Ecol Ind 7:565–588. doi:10.1016/j.ecolind.2006.06.004
UN (1992) Agenda 21. In: Proceedings of United Nations Conference on Environment and Development, Brazil, Rio De Janerio. http://un.org/esa/sustdev/documents/agenda21/english/Agenda21.pdf. Accessed 30 Nov 2014
World Commission on Environment and Development (WECD) (1987) Our common future. United Nations, http://un-documents.net/our-common-future.pdf. Accessed 30 Nov 2014
Author information
Authors and Affiliations
Corresponding author
Appendix 1: detailed calculations of indicators values for UPL3
Appendix 1: detailed calculations of indicators values for UPL3
-
(a)
Waste production = [(Waste quantity +ore quantity × (1-average grade)]
According to Fig. 7 the number of waste blocks in UPL3 is 35 and the number of ore blocks in UPL3 is 14. According to Fig. 2, the average grade of 14 ore blocks in UPL3 is (0.56 × 1+0.27 × 1 + 0.29 × 1 + … + 0.59 × 1)/14 = 0.38; Waste production = 35 + 14 × (1 − 0.38) = 44 ton.
-
(b)
Reclamation = ((pit wall surface) + (waste dump surface))
-
Pit wall surface in UPL3: 27 m2;
-
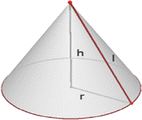
Waste volume in UPL3: 44 m3 (density is 1 ton/m3); It is assumed that waste dump shape is a cone with 45 degrees sides and all lateral needs reclamation. Therefore, the base circular radius of the cone (r) is equal to the cone height (h).
-
$$ {\text{Cone volume}}:V = \frac{1}{3}\pi r^{2} {\text{h }}\mathop \Rightarrow \limits^{r = h} \frac{1}{3}\pi r^{3} $$(10)
-
$$ {\text{Lateral surface area of the cone}}:S = \pi rl ,\;l = \sqrt {{\text{h}}^{2} + r^{2} } \mathop \Rightarrow \limits^{r = h} {\text{l}} = \sqrt 2 r $$(11)
-
Where, l is the slant height. Therefore: \(43.74 = \frac{1}{3}\pi r^{3} \Rightarrow r = 3.47\,{\text{m}}; l = 4.91\,{\text{m}}; S = 53.47\,{\text{m}}^{2} ;\)
-
Waste dump surface area for UPL3 = S = 53.47 m2, Reclamation of UPL3 = (27 + 53.47) = 80.47. m2
-
-
(c)
Land use = ((Surface of natural land inside pit collar before pit opening + land area that is covered by waste dumps))
According to Fig. 5, the surface of natural land inside the pit collar before pit opening for UPL3 = 12 m2; Land area that is covered by waste dumps is equal to the A.
$${\text{Base surface area of the cone}}:A = \pi r^{2}$$(12)\(r = 3.47\,{\text{m}}\), A = 37.81 m2; Land use of UPL3 = (12 + 37.81) = 50 m2.
-
(d)
Energy Consumption = [fm × ore + fw × mine waste]
Assumed fm = 5 and fw = 1; Energy Consumption = [5 × (14) + 1 × 35] = 105 energy unit
-
(e)
Job security = Life of mine = (ore in pit/ore production per year)
Life of mine = 14/3 = 4.7 year
-
(f)
Safety = Depth of mine = (highest bench level − pit floor level)
Safety = 7 − 0 = 7 m
-
(g)
Resource efficiency = (ore quantity in pit × average grade)/(orebody × average of orebody grade)
Resource efficiency = (14 × 0.38)/(26 × 0.35) = 0.58 %
-
(h)
Number of employees = (ore and waste blocks in level 1 + ore and waste blocks in level 2 × 1.1 + …)/(life of mine)
Number of employees = (13 + 11 × 1.1 + 9×1.2 + 7×1.3 + 5×1.4 + 3×1.5 + 1×1.6)/4.7 = 13 man
-
(i)
Profit = (sum of all blocks economic value in pit)
Profit = (35 × (−4) +3+6 + 7+29 + 18 + 22 + 14 + 14 + 32 + 8+3 + 20 + 9+31) = 73 $
-
(j)
Post mining income = [reclaimed land × ISL − land use × IPL]
Assumed Ipl = 0.01 $/m2 and IPL = 0.012 $/m2, Post mining income = (80.47 × 0.1 − 50 × 0.12) = 1.9 $
-
(k)
Taxes generation = sum of all taxes
Assumed tax on profit = 0.2, other taxes is 0.3$ per ton of excavated material (ore + waste), all customs duties = 0 Taxes generation = (73 × 0.2 + (14 + 35) × 0.3) = 29.23 $
-
(l)
Mining indirect benefit = sum of all mining indirect benefits.
Assumed 20 % of mining costs spent in the local community. Mining indirect benefit = [(14 + 35) × 4$ + 14 × 12$] × 0.2 = 72.8 $

Rights and permissions
About this article

Cite this article
Adibi, N., Ataee-pour, M. Consideration of sustainable development principles in ultimate pit limit design. Environ Earth Sci 74, 4699–4718 (2015). https://doi.org/10.1007/s12665-015-4434-3
Received:
Accepted:
Published:
Issue Date:
DOI: https://doi.org/10.1007/s12665-015-4434-3