
Abstract
Parasitic copepods infestation on three species of commercially important fishes belonging to the family Mugilidae (Liza parsia) and Cichlidae (Oreochromis mossambicus and Etroplus suratensis) from Kayamkulam backwater were analysed between February 2015 and January 2017, covering all the three seasons. A total of 2305 fishes were analysed for parasites. Out of these, 299 fishes were infested with different species of parasitic copepods. The analysis revealed the presence of ten species of parasites comprising of Ergasilus parvitergam, Ergasilus sieboldi, Ergasilus sp, Caligus epidemicus, caligus sp, Dermoergasilus hoi, Dermoergasilus sp, Nothobomolochus sp, Lernea sp and Lepiophtherius sp. The infestation dynamics of parasitic copepods in terms of prevalence, mean intensity and mean abundance were calculated to determine the degree of infestation on each species. A higher prevalence (40%), mean intensity (13.2) and mean abundance (5.3) were found in Liza parsia while Etroplus suratensis had the lesser prevalence. There is a significant difference in the prevalence (p < 0.05), mean intensity (p < 0.05) and mean abundance (p < 0.01) in the rate of infestation of Liza parsia among the stations during the year 2015–2016, where as Oreochromis mossambicus and Etroplus suratensis shows no significant difference in the rate of infestation. The rate of infestation with parasitic copepod was higher in 2015–2016 than in 2016–2017. A higher proportion of fishes were more infested in Choolatheruvu (Station 3) as compared to Ayiramthengu (Station 1) and Valiyazheekal (Station 2).
Introduction
The parasites of aquatic organisms are ubiquitous and major components of ecosystem, which are closely related to several characteristics of the biotic and abiotic environment in which they exist (Lacerda et al. 2017). Most vertebrate species serve as a host of one or more parasitic species (Lagrue et al. 2011). Among vertebrates, fish have the highest rates of parasitic infestation because of the unique characteristics of their aquatic environment, which facilitate the spread, reproduction and life cycle completion of each parasitic group (Emily et al. 2018). The backwaters of Kerala possess high species richness and diversity of organisms, including parasites of fish populations. Parasites are components of most ecosystems and are involved in numerous food webs.
Parasitic copepods constitute one of the major group among parasitic arthropods that affect wild fish are of commercially significance as they affect host survival or cause changes in the flesh. Ergasilid copepod damages the gills and cause epizootics in cultured and wild populations of fishes (Lester and Hayward 2006). According to Kabata (1988), parasitic copepods belong to the suborder Siphonostomatoida (75%), Poeilostomatoida (20%) and Cyclopoida (5%). Most of the parasitic copepods are external parasites commonly found on the gills, skin and operculum and these copepods negatively affect the fish production, both from the wild and fish farms, thus making them difficult to market (Nike et al. 2013). Knowledge about the parasitic fauna of fishes in Kayamkulam backwater is scare. Therefore the aim of the study was to evaluate the parasitic copepod infestation on commercially important fishes of Kayamkulam backwater such as Liza parsia (Hamilton, 1822), Oreochromis mossambicus (Peters, 1852) and Etroplus suratensis (Bloch, 1790).
Materials and methods
Study area
The study area, Kayamkulam backwater or Kayamkulam estuary (latitudes 9°2′N and 9°16′N & longitudes 76°25′E and 76°32′E) is a shallow brackish water lagoon. Kayamkulam backwater occupies area in both Alapuzzha district and Kollam of the total 1652.33 hectares. For the purpose of study, three stations were considered as sampling areas within the estuary: Ayiramthengu (Station 1), Valiyazheekal (Station 2) and Choolatheruvu (Station 3). The first sampling station (S1) is the Ayiramthengu mangrove and this mangrove area was declared as environmental hot spot after ravaged by the Tsunami in 2004. Station 2 is at Valiyazheekal near to pozhi, connecting to the Arabian Sea. Kayamkulam backwater opens into the Lakshadweep Sea through Valiyazheekal Azhi. Station 3 is the Choolatheruvu, a part of Kayamkulam backwater near to National Thermal Power Corporation (NTPC).
Parasitological examination
The fishes Liza parsia, Oreochromis mossambicus and Etroplus suratensis from the three stations were obtained by the assistance of fishermen. Between February 2015 and January 2017, a total of 2305 individuals from different species were examined for parasitic copepod. Scraping from the skin, fins, tail and operculum of the fishes were done for the detection of parasites. After dissection, stereo-microscopic observation was made on gills for the presence of parasitic copepod.
Parasitic species identification was based on morphological features according to Pillai (1985), Yamaguti (1985), Kabata (1988), Boxshall and Halsey (2004) and Ho and Lin (2004). The parasite number and place of their attachment were recorded. The collected parasites were fixed in glacial acetic acid (Pritchard and Kruse 1982) and preserved in ethanol (70%). The parasitological terms such as prevalence, mean intensity and mean abundance follow Bush et al. (1997) and Margolis et al. (1982). Results of all parameters were expressed as mean ± standard deviation. Data were analysed using one-way analysis of Variance (ANOVA) using Statistical Package for Social Sciences (SPSS version 20). Tukey’s HSD test was used to determine differences between groups at 95% confidence level.
Results
During the present study, parasitic copepods belonging to the family Bomolochidae, Ergasilidae (Poecilostomatoida), Caligidae (Siphonostomatoida) and Lernaeidae (Cyclopoida) were collected from the Kayamkulam backwater. A total of 2305 fishes (Liza parsia-768, Oreochromis mossambicus-725 and Etroplus suratensis-812) were examined for the presence of parasites. Among the examined fishes, 299 fishes (Liza parsia-160, Oreochromis mossambicus-102 and Etroplus suratensis-37) were infested with different parasitic species. The prevalence, mean intensity and mean abundance of infestation were recorded to calculate the degree of infestation during the year February 2015 to January 2017 (Tables 1, 2).
-
a)
Prevalence Prevalence is the proportion of infested host among all the hosts examined. The prevalence of infestation by parasitic copepod on different fishes during the study period were presented in Tables 1 and 2.
- a.1:
-
Prevalence of parasitic copepod infestation on fishes during February 2015–January 2016. During the period February 2015 to January 2016, the prevalence of parasitic copepod on L.parsia at station 1, station 2 and station 3 varied from 18.4–26.5% 7, 12.5–18.6% and 21.6–40%. The prevalence of infestation of parasitic copepod in L.parsia during different season is shown in Fig. 1 and the parasites showed maximum effect in the monsoon period (40%) at station 3 (Fig. 1). The prevalence of parasitic copepod infestation in O. mossambicus at station 1, station 2 and station 3 were varied from 8.1–20.9%, 4.7–17.1% and 14.3–24.4% respectively. The higher prevalence was found in station 3 during monsoon season (24.4%) (Fig. 2). Regarding the prevalence of parasitic copepod infestation on E. suratensis, higher value was recorded from station 3 during monsoon period (11.6%) (Fig. 3). The infestation of copepod parasites on E. suratensis was low during the study period while the parasitic incidence in L. parsia was found high.
Fig. 1 
Seasonal fluctuation of Prevalence of parasitic copepod on Liza parsia during the year Feb 2015–Jan 2017
Fig. 2 
Seasonal fluctuation of Prevalence of parasitic copepod on Oreochromis mossambicus during the year Feb 2015–Jan 2017
Fig. 3 
Seasonal fluctuation of Prevalence of parasitic copepod on Etroplus suratensis during the year Feb 2015–Jan 2017
- a.2:
-
Prevalence of parasitic copepod infestation on fishes during February 2016–January 2017. During the period February 2016–January 2017, the higher prevalence of parasitic copepod in L. parsia was reported in monsoon (31.8%) at station 3 and the prevalence of infestation at station 1 (25%) and station 2 (14.9%) were found higher during the monsoon period (Fig. 1). In O. mossambicus, the higher prevalence of parasites was reported from the post monsoon (25.6%) at station 3 (Fig. 2). In E. suratensis, the higher prevalence of parasites was observed in monsoon (6.8%) at station 2 (Fig. 3).
-
b)
Mean Intensity Mean intensity is mean number of parasites from infested hosts. Mean intensity of infestation on fishes were summarized in Tables 1 and 2.
- b.1:
-
Mean Intensity of parasitic copepod infestation on fishes during February 2015–January 2016. Seasonal variation of mean intensity of parasitic copepod in fishes from three stations during the year February 2015–January 2016 was determined. In L. parsia, higher mean intensity was reported in monsoon (13.2) at station 3 (Fig. 4). In O. mossambicus, maximum mean intensity was found in the pre monsoon period (5.5) at station 2 (Fig. 5). There was no incidence of parasitic copepods in O. mossambicus in the month of March at all the stations. The mean intensity of parasitic copepods in E. suratensis was varied 0–3. The higher mean intensity was reported from station 2 and station 3 (3) during premonsoon period (Fig. 6). In all the stations, the infestation with parasitic copepods on E. suratensis was poor (Fig. 6).
Fig. 4 
Seasonal fluctuation of Mean intensity of parasitic copepod on Liza parsia during the year Feb 2015–Jan 2017
Fig. 5 
Seasonal fluctuation of Mean intensity of parasitic copepod on Oreochromis mossambicus during the year Feb 2015–Jan 2017
Fig. 6 
Seasonal fluctuation of Mean intensity of parasitic copepod on Etroplus suratensis during the year Feb 2015–Jan 2017
- b.2:
-
Mean Intensity of parasitic copepod infestation on fishes during February 2016–January 2017. During the period February 2016 to January 2017, the mean intensity of parasitic copepod in L. parsia at station 1, 2 and 3 were ranged from 2.9–4.4, 4.2–5.1 and 4.4–5.7 respectively. The higher value of mean intensity was observed at station 3(5.7) during post monsoon (Fig. 4). In the case of O. mossambicus, maximum mean intensity was observed during pre monsoon period (4) at station 1 and 2 (Fig. 5). Throughout the study period, mean intensity of parasitic copepods in E. suratensis was very low in all the stations. However station 1 and 3 shows highest mean intensity of parasitic copepods in E. suratensis during post monsoon period (3.5 and 3.3) (Fig. 6).
-
c)
Mean Abundance Mean abundance is the mean number of parasites present in all hosts examined. Mean abundance of infestation during February 2015 to January 2017 was summarized in Tables 1 and 2.
- c.1:
-
Mean Abundance of parasitic copepod infestation on fishes during February 2015–January 2016. Mean abundance of parasites on L. parsia at station 1, 2 and 3 during February 2015–January 2016 was ranged from 1.4–2.4, 1.1–1.9 and 2.7–5.3 respectively. Higher mean abundance was reported from station 3 (5.3) during monsoon (Fig. 7). In O. mossambicus, higher mean abundance was observed in monsoon period (0.9) at station 3 (Fig. 8). The mean abundance of parasitic copepod on E. sursatensis was varied from 0 to 0.3. Higher mean abundance was reported from station 3 (0.3) during monsoon period (Fig. 9).
Fig. 7 
Seasonal fluctuation of Mean abundance of parasitic copepod on Liza parsia during the year Feb 2015–Jan 2017
Fig. 8 
Seasonal fluctuation of Mean abundance of parasitic copepod on Oreochromis mossambicus during the year Feb 2015–Jan 2017
Fig. 9 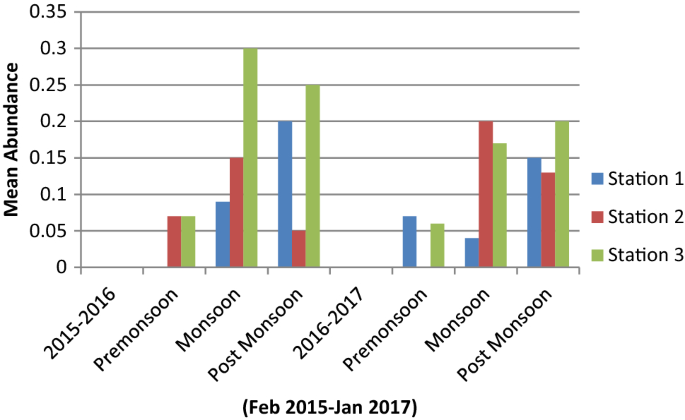
Seasonal fluctuation of Mean abundance of parasitic copepod on Etroplus suratensis during the year Feb 2015–Jan 2017
- c.2:
-
Mean Abundance of parasitic copepod infestation on fishes during February 2016–January 2017. From February 2016 to January 2017, mean abundance of infestation on fishes examined was varied 0.5–1.4 (L. parsia), 0.2–0.9 (O. mossambicus) and 0–0.2 (E. suratensis). In L. parsia, higher mean abundance was reported in monsoon (1.4) at station 3 (Fig. 7). Mean abundance of parasites on O. mossambicus was highest in post monsoon (0.9) at station 3 (Fig. 8). In E. suratensis, higher mean abundance was recorded during monsoon (0.2) and post monsoon (0.2) at station 2 and station 3 respectively (Fig. 9). The study showed that mean abundance was high in L. parsia than O. mossambicus and E. suratensis (Fig. 10).
Fig. 10 
Gill of fish infested with parasitic copepods


Prevalence, Mean Intensity and Mean Abundance of parasitic copepod infestation on commercially exploited fishes of Kayamkulam backwater were summarized in Tables 1 and 2. The results of the study were expressed as Mean ± standard deviation. Statistical analysis of data showed that the infestation on L. parsia was varied significantly among stations during the year 2015–2016. The prevalence (P < 0.05), mean intensity (P < 0.05) and mean abundance (P < 0.01) of parasitic copepods on L.parsia were varied among stations during February 2015–January 2016. Tukey’s HSD test shows that 95% confident that prevalence, mean intensity and mean abundance of parasitic copepod on L. parsia from station 1 and station 2 were similar, yet these parameters differ from station 3 during 2015–2016. Prevalence (P > 0.01) and mean intensity (P > 0.01) of infestation on O. mossambicus were not varied significantly among stations. But the statistical analysis showed that mean abundance (P < 0.05) of parasites on O. mossambicus was varied significantly among stations during 2015–2016. Tukey’s HSD test shows that mean abundance of parasitic copepod on O. mossambicus was similar in station 1 and 2. Prevalence (P > 0.01), mean intensity (P > 0.01) and mean abundance (P > 0.01) of parasitic copepod in E.suratensis were not varied among stations during February 2015–January 2016 (Table 1). From February 2016 to January 2017, prevalence (P > 0.01) and mean intensity (P > 0.01) of parasitic copepod infestation on L. parsia were not varied significantly among stations. But the statistical analysis showed that mean abundance (P < 0.05) of parasites on L. parsia was varied significantly among stations. There was no significant difference in the prevalence, mean intensity and men abundance of parasitic copepod on O. mossambicus and E. suratensis between the stations (P > 0.01) during 2016–2017 (Table 2).
Discussion
The parasite fauna in the host fishes is determined by the environmental conditions, both natural and man-made, as also the composition of host species at a given time (Santhosh and Radhakrishnan 2009). The parasitic fauna of fish can vary in their abundance depending on the host species, its level in the food chain, the age, size and sex of individual fish, and other biotic and abiotic factors (Takemoto and Lizama 2010). Copepods are common parasite fauna of fishes which have been studied extensively in coastal and neritic waters, where as they have become pests of fish species of commercial importance and several factors such as host factors and external factors (temperature, rainfall, salinity etc.) influence the abundance of parasite species on host fishes (Vinoth et al. 2010). According to Iyaji et al. (2009), biotic factors like age and size of host, host size and parasite size, host specificity, feeding habits of host, host sex and immune system can influence profoundly in the assemblages of parasites on fish hosts. Pollution and other anthropogenic activities of the aquatic environment may affect a parasitic community directly by acting on free-living parasitic stages or on ectoparasites, or indirectly by acting on the intermediate host populations (Moller 1987).
During the two year study period, prevalence, mean intensity and mean abundance were highest in L. parsia collected from station 3 of the study area followed by O. mossambicus and E. suratensis. Prevalence, mean intensity and mean abundance of parasitic copepods on L. parsia were statistically different between stations; however there was no significant difference in prevalence, mean intensity and mean abundance of parasitic copepods on O. mossambicus and E. suratensis between stations. Concerning the variation of parasitic copepod infestation on different host fishes, the parasites were more frequently found in L. parsia and parasites were absent in E. suratensis during some months and they were least infested. Results obtained from the present study reveals that high infestation on L. parsia and low infestation rate on E. suratensis were reported elsewhere in Kayamkulam backwater. Feeding habit of the host is significant factor for determining the nature of parasitic fauna in host (Razia Beevi and Radhakrishnan 2012). The study showed variability in the parasitic copepod infestation on different host fishes could be attributed to host specificity of parasite fauna. Most of the parasitic copepods are highly host specific. Highest number of parasites was reported from L. parsia and most of the recovered parasites were stenoxenic.
References
Boxshall GA, Halsey SH (2004) An introduction to copepod diversity. The Ray Society, London
Bush AO, Lafferty KD, Lotz JM, Shostak AW (1997) Parasitology meets ecology on its own terms. J Parasitol 83:575–583
Emily SP, Juliana RCM, Takemoto RM, Lima SE Jr (2018) Fish parasite diversity in the Amambai river, State Mato Grosso do Sul, Brazil. Acta Sci 40:1–7. https://doi.org/10.4025/actascibio/sci.v40i1.36330
Ho JS, Lin CL (2004) Sea lice of Taiwan (Copepoda: Siphonostomatoida: Caligidae). The Sueichan Press, Taiwan
Iyaji FO, Etim L, Eyo JE (2009) Parasite assemblages in fish hosts. Bio-Research 7(2):561–570
Kabata Z (1988) Copepoda and Branchiura. In: Margolis L, Kabata Z (eds) Guide to the parasites of fishes of Canada. Part II-Crustacea. Canadian Special Publication of Fisheries and Aquatic Sciences, Canada
Lacerda ACF, Roumbedakis K, Bereta JGS Jr, Nuner APO, Petrucio MM, Martins ML (2017) Fish parasites as indicators of organic pollution in southern Brazil. J Helminthol 92(3):322–331. https://doi.org/10.1017/s0022149x17000414
Lagrue C, Kelly DW, Hicks A, Poulin R (2011) Factors influencing infection patterns of trophically transmitted parasites among a fish community: host diet, host—parasite compatibility or both? J Fish Biol 79(2):466–485. https://doi.org/10.1111/j.1095-8649.2011.03041.x
Lester RJG, Hayward C (2006) Phylum Arthropoda. In: Woo PTK (ed) Fish diseases and disorders. Protozoan and Metazoan Infections, vol 1, 2nd edn. CABI, International, Cambridge
Margolis L, Esch GW, Holmes JC, Kuris AM, Schad GA (1982) The use of ecological terms in parasitology (Report of an ad hoc Committee of the American Society of Parasitologists). J Parasitol 68:31–133. https://doi.org/10.2307/3281335
Moller H (1987) Pollution and parasitism in the aquatic environment. J Parasitol 17(2):353–361. https://doi.org/10.1016/0020-7519(87)90110-x
Nike FA, Nestor GS, Emmanuel EB (2013) Copepoda parasites in economically important fish, Mugilidae (Mugil cephalus and Liza falcipinnis) from Lac Nokoue Lagoon in Republic of Benin, West Africa. Afr J Environ Sci Technol 7(8):799–807. https://doi.org/10.5897/ajest2013.1493
Pillai NK (1985) The fauna of India: Copepod parasites of marine fishes. Zoological Survey of India, Calcutta
Pritchard MH, Kruse GOW (1982) The collection and preservation of animal parasites. University of Nebraska Press, Lincoln
Razia Beevi M, Radhakrishnan S (2012) Community ecology of the metazoan parasites of freshwater fishes of Kerala. J Para Dis 36(2):184–196. https://doi.org/10.1007/s12639-012-0101-8
Santhosh B, Radhakrishnan S (2009) Host—specificity of metazoan parasites infecting mullets of Kerala, India. Ind J Fish 56(4):293–296
Takemoto RM, Lizama M (2010) Helminth fauna of fishes from the upper Parana river flood plain, Brazil. Neo Helminthol 4(1):5–8
Vinoth R, Ajithkumar TT, Ravichandran S, Gopi M, Rameshkumar G (2010) Infestation of copepod parasites in the food fishes of Vellar Estuary, South east coast of India. Act Parasitol Glob 1(1):1–5
Yamaguti S (1985) Parasitic copepod and branchiura of fishes. International books and periodicals supply service, New Delhi
Acknowledgements
Gratefully acknowledge the UGC for providing financial support to the first author with Junior Research Fellowship to carry out this study. The authors are thankful to the Department of Zoology, Sanatana Dharma College, Alappuzha for providing laboratory facilities to carry out this work.
Funding
This study was funded by University Grant Commission, India. (Award Number: 206143088). The first author has received research grants (JRF) from UGC, India.
Author information
Authors and Affiliations
Contributions
The first author (Dhanya P) carried out the present study (identification of parasites, statistical analysis and manuscript writing were done by first author. The second author (S. Amina) provided help for identification of copepod parasites to the first author.
Corresponding author
Ethics declarations
Conflict of interest
There is no conflict of interest among the authors who have contributed to this study.
Statement on ethical approval for using Fishes in laboratory
The fish species selected for the present study was not under the threatened or endangered category. These species were abundant in the study area and used as food fishes. We collected these fish species from local fishermen and from market. Died fishes were used for the detection of copepod parasites.
Additional information
Publisher's Note
Springer Nature remains neutral with regard to jurisdictional claims in published maps and institutional affiliations.
Rights and permissions
About this article

Cite this article
Dhanya, P., Amina, S. Parasitic copepods infestation on commercially exploited fishes from Kayamkulam backwater, Kerala, India. J Parasit Dis 43, 263–269 (2019). https://doi.org/10.1007/s12639-019-01087-6
Received:
Accepted:
Published:
Issue Date:
DOI: https://doi.org/10.1007/s12639-019-01087-6