
Abstract
This study aims to examine the relationship between daily temperature and mortality in the Klang Valley, Malaysia, over the period 2006–2015. A quasi-Poisson generalized linear model combined with a distributed lag non-linear model (DLNM) was used to estimate the association between the mean temperature and mortality categories (natural n=69,542, cardiovascular n= 15,581, and respiratory disease n=10,119). Particulate matter with an aerodynamic diameter below 10 μm (PM10) and surface ozone (O3) was adjusted as a potential confounding factor. The relative risk (RR) of natural mortality associated with extreme cold temperature (1st percentile of temperature, 25.2 °C) over lags 0–28 days was 1.26 (95% confidence interval (CI): 1.00, 1.60), compared with the minimum mortality temperature (28.2 °C). The relative risk associated with extremely hot temperature (99th percentile of temperature, 30.2 °C) over lags 0–3 days was 1.09 (95% CI: 1.02, 1.17). Heat effects were immediate whereas cold effects were delayed and lasted longer. People with respiratory diseases, the elderly, and women were the most vulnerable groups when it came to the effects of extremely high temperatures. Extreme temperatures did not dramatically change the temperature-mortality risk estimates made before and after adjustments for air pollutant (PM10 and O3) levels.
Introduction
Climate change is likely to have a significant impact, both directly and indirectly, on human health (Costello et al. 2009; Guo et al. 2017; Deng et al. 2020). The effects of climate change on human health have received more attention in recent years as extreme temperatures have been found to be associated with temperature-related mortality risk (Anderson and Bell 2009; Yu et al. 2012). Previous studies, undertaken in a large multi-country study, showed that the percentage of total deaths was around 8% with cold accounting for more deaths than heat (Gasparrini et al. 2015). Generally, exposure to extremely high temperatures (heat effects) produces an immediate effect and an acute event, causing health problems and clinical syndromes such as heat cramps, exhaustion, stroke, syncope, and even death (Kovats and Hajat 2008; Patz et al. 2014; Mallen et al. 2019). In contrast, low temperatures (cold effects) showed a more delayed effect with an increase in the number of deaths several days after exposure (Rocklöv and Forsberg 2008; Anderson and Bell 2009).
In many studies over the last two decades, temperature-mortality relationship curves have typically been found in common shapes such as V-, U-, or J-shaped exposure-response functions (Baccini et al. 2008; Anderson and Bell 2009; Hajat and Kosatky 2010). The temperature with the lowest risk of mortality is defined as the optimum temperature and is typically known as the minimum mortality temperature (MMT) (El-zein et al. 2004; Basu and Malig 2011). The temperature-mortality risk increases when the temperature becomes lower or higher than the MMT threshold temperature (El-zein et al. 2004; Basu and Malig 2011; Egondi et al. 2012). The MMT threshold varies among countries and regions with different climate conditions (Guo et al. 2014; Honda et al. 2014; Yin et al. 2019) and is also affected by time of day (Todd and Valleron 2015). The temperature-mortality relationship is also modified by gender and age, and by specific causes of death, which affect the relative risks (RR) (Medina-Ramón et al. 2006; Madrigano et al. 2013). Most of the studies adjusted seasonality and time trends as a way to control potential confounding factors. Seasonal variations in temperature cause changes in the daily number of respiratory and cardiovascular diseases (CVD) as well as in total and cause-specific mortality (Braga et al. 2002). For environmental hazards, there are a few studies where air pollutant parameters such as particulate matter (PM) and surface ozone (O3) were adjusted. Some of the results from these studies showed that temperature effects were generally independent or less influenced by air pollution (Yang et al. 2012; Guo et al. 2014) but others have indicated that air pollution could aggravate the effect of temperature on health outcomes (Buckley et al. 2014; Li et al. 2015).
The association between temperature and mortality in different regions should be explored individually because of adaptive population capabilities and weather patterns which vary in each region (Basu 2009; Yu et al. 2012). The majority of the extensive literature describing the effects of temperature on mortality is from developed countries or regions with temperate and cold climates, such as the USA and Europe (Medina-Ramón and Schwartz 2007; Analitis et al. 2008; Anderson and Bell 2009; Hajat and Kosatky 2010; Guo et al. 2011). Meanwhile, only a few studies have been undertaken in developing countries, particularly in tropical and sub-tropical regions (McMichael et al. 2008; Xie et al. 2013). Developing countries, however, are affected more by climate change and more prone to health threats as they have more vulnerable populations and limited public health infrastructures (McMichael et al. 2008). It is especially interesting to study associations between temperature and mortality in tropical and sub-tropical cities because a previous study in Hue, Vietnam, showed an unusual L pattern with a 0–21 lag period (Dang et al. 2016). This unusual pattern contrasts with the usual U, V, or J shapes associated with temperate and cold climate regions (Baccini et al. 2008; Anderson and Bell 2009). In some instances, it has been found that the temperature and mortality relationship in tropical and sub-tropical climates results in an immediate increase in mortality for both high and low temperatures (Hashizume et al. 2009; Guo et al. 2012).
In the Southeast Asian region, studies on associated temperature-mortality have been conducted in Vietnam, Thailand, and the Philippines (Guo et al. 2012; Xuan et al. 2014; Seposo et al. 2015; Dang et al. 2016). The effect of temperature on human health, especially on mortality, has received more attention in Malaysia in recent years. This is largely as a response to 200 cases and 2 deaths, relating to heatwave events, being reported by the Malaysian Ministry of Health in 2016 (MOH Malaysia 2016). In this study, we examined the effects of temperature on all mortality categories (natural, cardiovascular and respiratory) in the Klang Valley, Malaysia, during the period 2006 to 2015. We used a quasi-Poisson regression in the generalized linear model (GLM) to analyse the association between temperature and mortality, combined with DLNM to investigate the delayed effect of temperature on mortality. The association between temperature and mortality was also adjusted for the potential confounding effects of air pollution with an aerodynamic diameter of less than 10 μm (PM10) and surface O3. These two parameters were chosen due to being pollutants which abundantly exceeded both the Malaysian Ambient Air Quality Standard (MAAQS) and the United States National Ambient Air Quality Standards (NAAQS) when compared to other major air pollutants between 2005 and 2015 as stated in the study by Mohtar et al. (2018).
Material and methods
Study area
The Klang Valley is located on the Malaysian Peninsula and consists of the states of Selangor, Putrajaya, and Kuala Lumpur (Fig. 1). It has a relatively high population density and had a population of around 8.1 million in 2016 (Department of Statistics Malaysia 2017). The Klang Valley has grown rapidly and become the most urbanized and populated region in Malaysia (Jamal et al. 2004). The climate is hot and humid throughout the year with a uniform temperature, high humidity, and copious rainfall (Malaysian Meteorological Department 2009). The annual climate variability is closely tied to the Southwest (June–September) and the Northeast Monsoons (November–March). The Southwest Monsoon typically features drier weather with less rainfall compared to the Northeast Monsoon which brings more precipitation (Kwan et al. 2013). The average annual temperature varies from 21 to 32°C. In the last decade, the daily mean temperature increased by 0.07°C year-1 in Klang Valley (Yatim et al. 2019). The average total annual rainfall is around 250 cm a year (Malaysian Meteorological Department 2009). The major ambient pollutants in this region are particulate matter (PM) and surface O3, which are predominantly influenced by regional tropical factors as well as local pollutant emissions and dispersion characteristics (Latif et al. 2012).
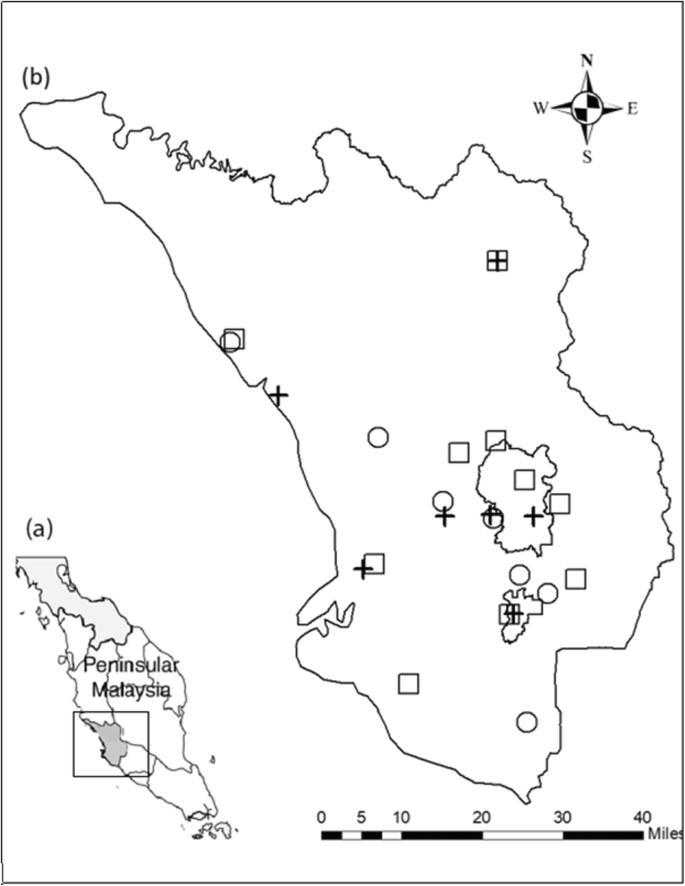
a Peninsular Malaysia map. b Klang Valley map for the study area. Crosses represent meteorological and air pollutant stations from DOE. Circles represent meteorological station from MMD, and squares represent hospital location
Mortality, meteorological, and air pollutant data
Daily mortality data from ten hospitals were collated by the Health Information Centre, Putrajaya (PIK) from 2006 to 2015 (Fig. 1). Approval from the Medical Research Ethics Committee, Ministry of Health, was obtained prior to the data collection. The mortality data was classified into three cause-specific categories: natural mortality (A00–R99) (n=69,542), cardiovascular mortality (I00–I99) (n=15,581), and respiratory mortality (J00–J99) (n=10,119) based on the Tenth Revision of the International Classification of Diseases and Related Health Problems (ICD-10).
Daily meteorological data covering the same period for the maximum, mean, and minimum temperature as well as relative humidity was obtained from the Malaysian Meteorological Department (MetMalaysia) and the Department of Environment, Malaysia (DOE). The daily averages of the meteorological variables (n=3652) were calculated using all available records from 14 monitoring stations (Fig. 1). In the instances where a meteorological station had a missing value, observations from other stations were used to calculate the average value for that day (Tong et al. 2012; Al-Taiar and Thalib 2014; Alahmad et al. 2019). For air pollution parameters, daily air pollution data (PM10) (μg/m3) and surface O3 (ppb) were obtained from DOE continuous air quality monitoring stations (Fig. 1). The daily concentrations of PM10 and surface O3 (n=3652) were averaged from the data collected from the seven air quality monitoring stations within the Klang Valley. Detailed information on PM10 and O3 measurements can be obtained from Latif et al. (2014).
Statistical analysis
We used a quasi-Poisson regression in the generalized linear model (GLM) combined with a distributed lag non-linear model (DLNM) to examine the impact of temperature on mortality. The DLNM employed a cross-basis function allowing us to predict the possible non-linear effects of temperature (temperature-mortality dimension) and lag (lag-mortality dimension) concurrently (Gasparrini et al. 2010). In this study, we fitted quasi-Poisson regression models adjusting them for potential confounders such as long-term and seasonal trends (time), days of the week (DOW), relative humidity (RH), and air pollutants such as PM10 and O3. The general model for this study is as follows:
where t is the day of observation; Yt is the number of daily deaths on day t; α refers to the intercept; β is the vector of regression coefficients for the cross-basis function where (Tt,l) is a matrix obtained by applying the t temperatures, and l refers to the lag days; DOWt is a day of the week on day t represented as categorical variables; ns represents the smoothing parameter set to the natural cubic spline; time was used to control long-term trends and seasonality with i degrees of freedom (df) per year; RHt, PM10t, and O3t are the daily relative humidity, daily particulate matter and daily ozone on day t, respectively. According to previous studies, three degrees of freedom (df) were used to smooth RH, PM10, and O3 (Stafoggia et al. 2008; Anderson and Bell 2009; Guo et al. 2012; Dang et al. 2016). It is crucial in the modelling procedure to adjust important pollutants such as PM10 and O3 which are prevalent in the Klang Valley. The challenge in this study with using the time series method is to obtain a good estimate of β for temperature. It was therefore necessary to control those factors in the model that change daily and are highly seasonal, such as the level of pollutants which always has a strong relationship with mortality.
Various parameters can be used in Eq. 1 due to the flexible choice of the smoothing parameter in DLNM functions for modelling the nonlinear temperature effect and the lagged effect, as well as the choice of df for controlling seasonality and long-term trends and potential confounders. We used a natural cubic spline—natural cubic spline DLNM—as a smoothing parameter that models both the nonlinear temperature effect and the lagged effect. Akaike’s information criterion for quasi-Poisson (Q-AIC) with the lowest value was used as a criterion to choose the df for temperature and lag (Peng et al. 2006; Gasparrini et al. 2010; Guo et al. 2011). For controlling seasonality and long-term trends, we used 8 df per year for the time variable (i value) based on the lowest Q-AIC value (Supplementary S1). We found that using 3 df for temperature and 4 df for lag with a maximum lag of up to 21 days in the cross-basis function produced the best fitting model based on the Q-AIC values (Supplementary S2). Knots of the mean temperatures were placed at equally spaced quantiles and the knots of the lag calculations were set at equally spaced values on the log scale of the lags. We chose the mean temperature as the best predictor of mortality compared to the maximum temperature and minimum temperature since the mean temperature gave the lowest Q-AIC values based on our data (Supplementary S3). In addition, the mean temperature represents exposure throughout the whole day and night and can be easily interpreted for decision-making purposes (Yu et al. 2012). We plotted the overall effect of temperature on all mortality categories over 21 lag days. We also plotted the relative risks against temperature at different lags (0–3, 0–7, 0–14, and 0–28 lag days) and calculated the cumulative risk to show the entire relationship between hot and cold temperatures on mortality. To examine the hot and cold effects on cause-specific mortality, we calculated the relative risk for all mortality categories associated with extreme cold (1st percentile of temperature or less) and extreme heat (99th percentile of temperature and more) relative to the minimum mortality temperature (MMT), respectively (Curriero et al. 2002). In order to check the robustness of our findings, we performed sensitivity analysis by investigating the effect of extreme temperatures before and after adjustments for air pollution levels at different lags (0–3, 0–7, 0–14, and 0–21 lag days). All statistical analyses were conducted using R statistical software (version 3.4.3) and the dlnm package version 2.3.4 (Gasparrini 2011). Spearman’s correlation coefficients were used to summarize the similarities in daily weather and air pollution conditions. The correlation results with p < 0.05 were considered statistically significant.
Results
A total of 69,542 deaths for natural mortality were recorded during the study period 2006 to 2015, including 15,581 and 10,119 deaths from cardiovascular disease and respiratory disease, respectively. Table 1 shows the descriptive statistics for daily mortality, weather, and air pollution conditions. On average, the daily mortality count for natural death was 18.9; cardiovascular deaths, 4.3; and respiratory deaths, 2.9. The daily mean, maximum and minimum temperatures, and relative humidity were 27.7°C (23.5–30.9°C), 32.1°C (24.7–36.5°C), 24.7°C (21.5–27.8°C), and 78.2% (50.2–97.1%), respectively. The daily mean concentrations of PM10 and O3 were 61.5 μg/m3 (range 23.2–426.8 μg/m3) and 40.2 ppb (range 7.2–101.1 ppb), respectively.
Figure 2 shows the overall cumulative effects and three-dimensional plots of the daily mean temperature on cause-specific mortality (natural, cardiovascular and respiratory) over 21 lag days. The relationship between the daily mean temperature and all-cause mortality was non-linear with relative risks (RR) being higher at both a very hot or cold temperature. From the graph, we identified that the minimum mortality temperature (MMT) during the study period was 28.2 °C which is close to the temperature at the 68th percentile for all-cause mortality. The three-dimensional plots show that the effects of high temperatures on cause-specific mortality peaked within 0–1 days whereas the effects of low temperatures (i.e., 1st percentile) occurred at about 12–14 days and the excess risks persisted for more than 1 week. We did not observe any apparent harvesting effects, such as a short-term forward shift in mortality rate (mortality displacement) (Supplementary S4).

The estimated overall effect (left) and three-dimensional plot (right) of the relative risk of the mean temperature (°C) over lags 0–21 days on cause-specific mortality (natural, cardiovascular, and respiratory) by using a natural cubic spline—natural cubic spline DLNM with 3 degrees of freedom for a natural cubic spline for temperature and 4 degrees of freedom for lag. The black lines are the mean relative risks while the grey regions are 95% confidence intervals
Based on the lag structures, we presented the cumulative effects of the mean temperature on all of the causes of mortality categories at different lags: 0–3, 0–7, 0–14, 0–21, and 0–28 (Fig. 3). The shape of the temperature and mortality category curves changed at different lag points. For lags 0–3, the results showed that only high temperatures increased the risk of mortality for all mortality categories (J shape). During lags 0–7 and 0–14, high temperatures continually increased the mortality risk and reached a peak for risk at lag 0–14 before declining at lags 0–21 for all-cause mortality. Meanwhile, low temperatures increased the risk at lag 0–14 for all-cause mortality. There was an increase in the risk of death for low temperatures at longer lags, reaching a peak at lag 0–28 for all-cause mortality. The overall cumulative effects of the mean temperature on natural, cardiovascular, and respiratory mortality were calculated at a lag of 0–3, 0–7, 0–14, 0–21, and 0–28 days with the temperature effects varying with different lag periods (Table 2). Compared with the MMT, the overall RRs associated with extremely low (1st percentile) temperatures were found to be non-significant for all tested lag periods, except for natural mortality. Overall, the cold effects were the strongest during extreme cold for natural mortality with a risk of 1.26 (95%CI: 1.00,1.60) at lag 0-28. In contrast, the effects of extremely high temperatures (99th percentile) relative to the MMT were found to be significant for cause-specific mortality. Respiratory mortality had the highest risk of death related to extreme heat at lags 0–14, with RRs of 1.42 (95%CI:1.04, 2.36) compared with other mortality causes. Table 3 shows the relative risk of extremely high and low temperatures on total mortality associated with temperature with variations for gender and age. We only observed significant effects of extremely high temperatures among the following two categories: women and the elderly. In general, the effects of high temperatures are generally more pronounced than the low temperatures for all-cause mortality. The results also showed that the effect of extreme heat and cold did not dramatically alter the relative risk effects before or after adjustments for PM10 and surface O3. Table 4 shows that air pollution slightly increased the extreme heat-related risk leading to an increased risk from 1.31 to 1.33 and from 1.33 to 1.36 for CVD and respiratory mortality risks, respectively. Overall, we observed that adjusting air pollutants (PM10 and O3) in the model did not aggravate the temperature-related mortality risk as the rate of increase was less than 4%.

Relative risks of mean temperature (°C) on cause-specific mortality over lags 0–3, 0–7, 0–14, 0–21, and 0–28. The reference value was minimum mortality temperature. The black lines are the cumulative relative risks while the grey regions are 95% confidence intervals
Discussion
In this study, our results show that the relationship between temperature and mortality was non-linear with high temperatures significantly (p<0.05) increasing the risk of mortality in the Klang Valley. We found that temperature-mortality relationships in this study were consistent with previous studies undertaken in other Southeast Asian countries. The MMT (28.2 °C) in this study was, however, slightly higher than the other Southeast Asian cities studied, such as Chiang Mai, Thailand, and Hue, Vietnam, with MMTs between 26.0 and 27.0 °C (Seposo et al. 2015; Dang et al. 2016). This difference though is consistent with the trend of MMT distributions globally, where the MMT tends to increase gradually from high latitudes to low latitudes (Tobías et al. 2016; Yin et al. 2019). We also demonstrated that hot effects appeared to be immediate or acute whereas cold effects were delayed by 12–14 days for both high and low temperature effects lasting for several days. Furthermore, our results suggested that the relative risk from high temperatures on mortality was far greater than that of low temperatures. The risk of extreme hot and cold temperature-related mortality in the Klang Valley tended to barely change before or after adjustments for PM10 and O3 concentrations. This may have been due to the average level of air pollutants being experienced, as would commonly be the case, as opposed to the occurrence of unusual concentration patterns or worst-case scenario events such as haze episodes. The concentration of air pollutants, such as PM10 and surface O3, usually affects human health when air pollution levels are high (Breitner et al. 2014; Li et al. 2015).
In our analyses, we extended the maximum lag value up to 28 days to capture the effects of both extreme high and low temperatures. Previous studies found that cold effects could be underestimated because the cold effect would usually last more than a week, while hot effects may be overestimated because potential mortality displacement (or harvesting) might occur during longer lags (Guo et al. 2011; Zhang et al. 2016). As such, we explored the lag effects of temperature on all mortality categories from 0 up to 28 days. We found that both high and low temperatures were associated with increases in all-cause mortality. The cold effect only appears to have had an effect after day 14. Previous studies also reported similarly delayed and longer cold effects on mortality (Goodman et al. 2004; Anderson and Bell 2009; Dang et al. 2016). However, this study did not observe any significant positive associations between low temperatures and cause-specific mortality except during lags 0–21 and 0–28 (Table 2). The non-significant associations between the cold effect and mortality in our study might be due to the fact that less cold spell events occurred in the study area. For high temperature effects, there was a significant association between temperature and cause-specific mortality (forming a J shape) at lag 0–3. This J shape pattern was found to be similar to research findings for other tropical and subtropical cities (McMichael et al. 2008; Wu et al. 2013; Dang et al. 2016). Even though this study found that high temperatures resulted in immediate increases in mortality, the highest peak effects from the heat were found at lag 0–14 days. This finding is unusual and inconsistent with most of the studies from Asian cities that show an acute and very short lag effect from high temperatures. According to Gasparrini et al. (2016), varying seasonal susceptibility to temperature or a change in acclimatization may be a possible explanation for this. However, further investigation is needed to properly understand this finding. Our results did not identify any mortality displacement in all-cause mortality data for hot and cold effects. This result differs from the findings reported by Guo et al. (2012) and Dang et al. (2016) who found mortality displacement for non-external and cardiopulmonary mortality in Chiang Mai and cardiovascular and respiratory mortality in Hui, Vietnam, respectively. There could be several reasons for this difference and one of them is likely to be due to a low number of daily deaths in this study. It may also depend on several factors including the baseline health status of the population (presence of chronic diseases), the population at risk (elderly people), and other local factors (Hajat et al. 2005; Basu and Malig 2011).
Some evidence in previous studies demonstrated that the magnitude of temperature effects varied greatly depending on climate, geography, and population (McMichael et al. 2008; Basu 2009; Guo et al. 2011; Gasparrini et al. 2015; Zhang et al. 2016). Generally, the magnitude of high and low temperatures on mortality risk in this study was comparable with other studies conducted in countries within the same region. For instance, we found an increased risk of 33% and 42% from the hot effect when comparing the 99th percentile of temperature (30.2°C) to the MMT (28.2 °C) in cardiovascular and respiratory mortality, respectively. An analysis in Manila, Philippines, indicated a similar pattern where the hot effect was associated with a 37% and 52% increase for the 99th percentile of temperature (32.8°C) to the MMT (30.0°C) over lag 0–13 days (Dang et al. 2016). In comparison with other studies in Southeast Asian cities (Guo et al. 2012; Seposo et al. 2015), we have examined both hot and cold effects using the mean temperature for cause-specific mortality. Our findings indicate that the mortality risk in the Klang Valley has slightly lower effects from high and low temperatures. This could be attributed to better infrastructure development and public healthcare services.
For cause-specific mortality analysis, we identified stronger associations between high temperatures and respiratory mortality than for natural and cardiovascular mortality. This finding is consistent with other studies that reported that exposure to high temperature episodes can exaggerate the lung function of patients with chronic respiratory diseases and can lead to death (Guo et al. 2012; Seposo et al. 2015). Despite the low mortality rate for respiratory disease in this study, our findings may be of great significance from a public health point of view. In the sub-group analyses, our results showed that the elderly are vulnerable for a short period of time (with significant risk at lag 0–3). Previous research found that the elderlies were at a higher risk of mortality with high temperatures (Yu et al. 2012; Thorsson et al. 2014; Li et al. 2019; Kolvir et al. 2020). The elderlies are known to be less able to adapt physiologically or to respond to changes in environmental temperatures (Guo et al. 2014; Liu et al. 2020). Regarding gender-specificity, our study found that women were more susceptible to high temperatures than cold temperatures compared to men, which is similar to the results obtained from previous studies (Seposo et al. 2015; Liu et al. 2020). However, there are some studies that have reported that men either are at greater risk or have the same risk level as women (Ban et al. 2017; Zhai et al. 2021). These varying results on gender-specificity may be attributed to socioeconomic factors and geographical context (Hajat et al. 2005; Ban et al. 2017)
Conclusions
This study examined the effects of temperature on cause-specific mortality (natural, cardiovascular, and respiratory diseases) in the Klang Valley, Malaysia. The main findings of the study are that both high (hot) and low (cold) temperatures were associated with all mortality categories at a minimum mortality temperature (MMT) of 28.2 °C. The effects of low temperatures were delayed (12–14 days), while high temperature effects appeared acute with both high and low temperature effects lasting for several days. Furthermore, extremely high temperatures were shown to have greater risks than extremely low ones. People with respiratory diseases, women, and the elderly were the most vulnerable to extreme temperatures with heat-related mortality risks increasing by 42%, 23%, and 15%, respectively. Adjustment of the model with major air pollutants in a tropical environment, PM10, and surface O3 from this study did not influence the mortality risk rate due to extreme temperature.
These findings may provide strong evidence to aid the relevant agencies and local government in the development of strategies and policies which effectively tackle and reduce temperature-related mortality risks. This is especially important when countries, such as Malaysia, encounter climate change events, particularly those relating to extremely high temperatures or heatwaves. However, our findings must be interpreted with consideration to the strengths and limitations of our study. One of the key strengths of this study is that we used 10 years’ worth of high-quality data (with no missing data for mortality) and adjusted it for a range of confounders including relative humidity and air pollution. In addition, we investigated the temperature-mortality association on individual characteristics and vulnerable subgroups including the cause of death (natural, cardiovascular, and respiratory mortality), age-specific groups, and gender. Our study also had some limitations. One of the main ones being that we only used data from three locations in the Klang Valley (the central region of the Malaysia Peninsular) to examine the effects of temperature on mortality, so the findings may be difficult to generalize to other rural/urban areas. However, previous studies suggest that daily average temperatures were highly correlated between the stations and no evidence of a high spatial variability between temperature monitoring stations in Malaysia was found (Tangang et al. 2012; Le Loh et al. 2016). Furthermore, while the relatively small number of deaths due to cause-specific diseases may on the one hand have limited our ability to identify the different effects of temperature on cause-specific mortality, they would not have substantially affected our main findings. Finally, as we derived air pollution data from fixed monitoring sites and cannot completely represent the actual individual exposure, there might be inevitable assessment errors. Further investigation on the influence of these factors, including the use of other air quality parameters such as fine particle (PM2.5) and other gases aside from O3 which are influenced by urban transportation, power plant, and biomass burning, will allow us to better refine the temperature-mortality relationship in Malaysia.
Change history
07 July 2021
Added data in Abstract.
References
Al-Taiar A, Thalib L (2014) Short-term effect of dust storms on the risk of mortality due to respiratory, cardiovascular and all-causes in Kuwait. Int J Biometeorol 58:69–77. https://doi.org/10.1007/s00484-012-0626-7
Alahmad B, Shakarchi A, Alseaidan M, Fox M (2019) The effects of temperature on short-term mortality risk in Kuwait: a time-series analysis. Environ Res 171:278–284. https://doi.org/10.1016/j.envres.2019.01.029
Analitis A, Katsouyanni K, Biggeri A, Baccini M, Forsberg B, Bisanti L, Kirchmayer U, Ballester F, Cadum E, Goodman PG, Hojs A, Sunyer J, Tiittanen P, Michelozzi P (2008) Effects of cold weather on mortality: results from 15 European cities within the PHEWE project. Am J Epidemiol 168:1397–1408. https://doi.org/10.1093/aje/kwn266
Anderson BBG, Bell MLM (2009) Weather-related mortality: how heat, cold, and heat waves affect mortality in the United States. Epidemiology 20:205–213. https://doi.org/10.1097/EDE.0b013e318190ee08
Baccini M, Biggeri A, Accetta G, Kosatsky T, Katsouyanni K, Analitis A, Anderson HR, Bisanti L, D'Ippoliti D, Danova J, Forsberg B, Medina S, Paldy A, Rabczenko D, Schindler C, Michelozzi P (2008) Heat effects on mortality in 15 European cities. Epidemiology 19:711–719. https://doi.org/10.1097/EDE.0b013e318176bfcd
Ban J, Xu D, He MZ, Sun Q, Chen C, Wang W, Zhu P, Li T (2017) The effect of high temperature on cause-specific mortality: a multi-county analysis in China. Environ Int 106:19–26. https://doi.org/10.1016/j.envint.2017.05.019
Basu R (2009) High ambient temperature and mortality: a review of epidemiologic studies from 2001 to 2008. Environ Health A Glob Access Sci Source 8:1–13
Basu R, Malig B (2011) High ambient temperature and mortality in California: exploring the roles of age, disease, and mortality displacement. Environ Res 111:1286–1292. https://doi.org/10.1016/j.envres.2011.09.006
Braga ALF, Zanobetti A, Schwartz J (2002) The effect of weather on respiratory and cardiovascular deaths in 12 U.S. cities. Environ Health Perspect 110:859–863. https://doi.org/10.1289/ehp.02110859
Breitner S, Wolf K, Devlin RB, Diaz-Sanchez D, Peters A, Schneider A (2014) Short-term effects of air temperature on mortality and effect modification by air pollution in three cities of Bavaria, Germany: a time-series analysis. Sci Total Environ 485–486:49–61. https://doi.org/10.1016/j.scitotenv.2014.03.048
Buckley JP, Samet JM, Richardson DB (2014) Does air pollution confound studies of temperature? Epidemiology 25:242–245. https://doi.org/10.1097/EDE.0000000000000051
Costello A, Abbas M, Allen A, Ball S, Bell S, Bellamy R, Friel S, Groce N, Johnson A, Kett M, Lee M, Levy C, Maslin M, McCoy D, McGuire B, Montgomery H, Napier D, Pagel C, Patel J, de Oliveira JA, Redclift N, Rees H, Rogger D, Scott J, Stephenson J, Twigg J, Wolff J, Patterson C (2009) Managing the health effects of climate change Lancet and University College London Institute for Global Health Commission. Lancet 373:1693–1733
Curriero FC, Heiner KS, Samet JM, et al (2002) Temperature and mortality in 11 cities of the eastern United States. Am J Epidemiol 155:80–87. https://doi.org/10.1093/aje/155.1.80
Dang TN, Seposo XT, Duc NHC, Thang TB, An DD, Hang LTM, Long TT, Loan BTH, Honda Y (2016) Characterizing the relationship between temperature and mortality in tropical and subtropical cities: a distributed lag non-linear model analysis in Hue, Viet Nam, 2009-2013. Glob Health Action 9:1–11. https://doi.org/10.3402/gha.v9.28738
Deng J, Hu X, Xiao C, Xu S, Gao X, Ma Y, Yang J, Wu M, Liu X, Ni J, Pan F (2020) Ambient temperature and non-accidental mortality: a time series study. Environ Sci Pollut Res 27:4190–4196. https://doi.org/10.1007/s11356-019-07015-8
Department of Statistics Malaysia (2017) Department of Statistics Malaysia Press Release Social Statistics Bulletin Publication , Malaysia , 2018
Egondi T, Kyobutungi C, Kovats S, Muindi K, Ettarh R, Rocklöv J (2012) Time-series analysis of weather and mortality patterns in Nairobi’s informal settlements. Glob Health Action 5:23–32. https://doi.org/10.3402/gha.v5i0.19065
El-zein A, Tewtel-salem M, Nehme G (2004) A time-series analysis of mortality and air temperature in Greater Beirut. Sci Total Environ 330:71–80. https://doi.org/10.1016/j.scitotenv.2004.02.027
Gasparrini A (2011) Distributed lag linear and non-linear models in R: the package dlnm. J Stat Softw 43:1–20. https://doi.org/10.18637/jss.v043.i08
Gasparrini A, Armstrong B, Kenward MG (2010) Distributed lag non-linear models. Stat Med 29:2224–2234. https://doi.org/10.1002/sim.3940
Gasparrini A, Guo Y, Hashizume M, et al (2016) Changes in Susceptibility to Heat during the Summer: A Multicountry Analysis. Am J Epidemiol 183:1027–1036. https://doi.org/10.1093/aje/kwv260
Gasparrini A, Guo Y, Hashizume M, Lavigne E, Zanobetti A, Schwartz J, Tobias A, Tong S, Rocklöv J, Forsberg B, Leone M, de Sario M, Bell ML, Guo YLL, Wu CF, Kan H, Yi SM, de Sousa Zanotti Stagliorio Coelho M, Saldiva PHN, Honda Y, Kim H, Armstrong B (2015) Mortality risk attributable to high and low ambient temperature: a multicountry observational study. Lancet 386:369–375. https://doi.org/10.1016/S0140-6736(14)62114-0
Goodman PG, Dockery DW, Clancy L (2004) Cause-specific mortality and the extended effects of particulate pollution and temperature exposure. Environ Health Perspect 112:179–185. https://doi.org/10.1289/ehp.6451
Guo Y, Barnett AG, Yu W, Pan X, Ye X, Huang C, Tong S (2011) A large change in temperature between neighbouring days increases the risk of mortality. PLoS One 6:e16511. https://doi.org/10.1371/journal.pone.0016511
Guo Y, Gasparrini A, Armstrong B, Li S, Tawatsupa B, Tobias A, Lavigne E, de Sousa Zanotti Stagliorio Coelho M, Leone M, Pan X, Tong S, Tian L, Kim H, Hashizume M, Honda Y, Guo YLL, Wu CF, Punnasiri K, Yi SM, Michelozzi P, Saldiva PHN, Williams G (2014) Global variation in the effects of ambient temperature on mortality: a systematic evaluation. Epidemiology 25:781–789. https://doi.org/10.1097/EDE.0000000000000165
Guo Y, Gasparrini A, Armstrong BG, Tawatsupa B, Tobias A, Lavigne E, Coelho MSZS, Pan X, Kim H, Hashizume M, Honda Y, Guo YLL, Wu CF, Zanobetti A, Schwartz JD, Bell ML, Scortichini M, Michelozzi P, Punnasiri K, Li S, Tian L, Garcia SDO, Seposo X, Overcenco A, Zeka A, Goodman P, Dang TN, Dung DV, Mayvaneh F, Saldiva PHN, Williams G, Tong S (2017) Heat wave and mortality: a multicountry, multicommunity study. Environ Health Perspect 125:1–11. https://doi.org/10.1289/EHP1026
Guo Y, Punnasiri K, Tong S (2012) Effects of temperature on mortality in Chiang Mai city, Thailand: a time series study. Environ Health A Glob Access Sci Source 11:36. https://doi.org/10.1186/1476-069X-11-36
Hajat S, Armstrong BG, Gouveia N, Wilkinson P (2005) Mortality displacement of heat-related deaths. Epidemiology 16:613–620. https://doi.org/10.1097/01.ede.0000164559.41092.2a
Hajat S, Kosatky T (2010) Heat-related mortality: a review and exploration of heterogeneity. J. Epidemiol. Community Health 64(9):753–760
Hashizume M, Wagatsuma Y, Hayashi T, Saha SK, Streatfield K, Yunus M (2009) The effect of temperature on mortality in rural Bangladesh-a population-based time-series study. Int J Epidemiol 38:1689–1697. https://doi.org/10.1093/ije/dyn376
Honda Y, Kondo M, McGregor G, Kim H, Guo YL, Hijioka Y, Yoshikawa M, Oka K, Takano S, Hales S, Kovats RS (2014) Heat-related mortality risk model for climate change impact projection. Environ Health Prev Med 19:56–63. https://doi.org/10.1007/s12199-013-0354-6
Jamal HH, Pillay MS, Zailina H, Shamsul BS, Sinha K, Zaman Huri Z, Khew SL, Mazrura S, Ambu S, Rahimah A, Ruzita M (2004) A study of health impact & risk assessment of urban air pollution in Klang Valley
Kolvir HR, Madadi A, Safarianzengir V, Sobhani B (2020) Monitoring and analysis of the effects of atmospheric temperature and heat extreme of the environment on human health in Central Iran, located in southwest Asia. Air Qual Atmos Health 13:1179–1191. https://doi.org/10.1007/s11869-020-00843-5
Kovats RS, Hajat S (2008) Heat stress and public health: a critical review. Annu Rev Public Health 29:41–55. https://doi.org/10.1146/annurev.publhealth.29.020907.090843
Kwan MS, Tangang FT, Juneng L (2013) Projected changes of future climate extremes in Malaysia. Sains Malaysia 42:1051–1059
Latif MT, Dominick D, Ahamad F, et al (2014) Long term assessment of air quality from a background station on the Malaysian Peninsula. Sci Total Environ 482–483:336–348. https://doi.org/10.1016/j.scitotenv.2014.02.132
Latif MT, Huey LS, Juneng L (2012) Variations of surface ozone concentration across the Klang Valley, Malaysia. Atmos Environ 61:434–445. https://doi.org/10.1016/j.atmosenv.2012.07.062
Li L, Yang J, Guo C, Chen PY, Ou CQ, Guo Y (2015) Particulate matter modifies the magnitude and time course of the non-linear temperature-mortality association. Environ Pollut 196:423–430. https://doi.org/10.1016/j.envpol.2014.11.005
Li M, Zhou M, Yang J, Yin P, Wang B, Liu Q (2019) Temperature, temperature extremes, and cause-specific respiratory mortality in China: a multi-city time series analysis. Air Qual Atmos Health 12:539–548. https://doi.org/10.1007/s11869-019-00670-3
Liu J, Hansen A, Varghese B, Liu Z, Tong M, Qiu H, Tian L, Lau KKL, Ng E, Ren C, Bi P (2020) Cause-specific mortality attributable to cold and hot ambient temperatures in Hong Kong: a time-series study, 2006–2016. Sustain Cities Soc 57:102131. https://doi.org/10.1016/j.scs.2020.102131
Le Loh J, Tangang F, Juneng L et al (2016) Projected rainfall and temperature changes over Malaysia at the end of the 21st century based on PRECIS modelling system. Asia-Pac J Atmos Sci 52:192–208. https://doi.org/10.1007/s13143-016-0019-7
Madrigano J, Mittleman MA, Baccarelli A, Goldberg R, Melly S, von Klot S, Schwartz J (2013) Temperature, myocardial infarction, and mortality: effect modification by individual-and area-level characteristics. Epidemiology 24:439–446. https://doi.org/10.1097/EDE.0b013e3182878397
Malaysian Meteorological Department (2009) Climate change scenarios for Malaysia (2001 - 2099). Malaysian Meteorol Dep January, S:1–84.
Mallen E, Stone B, Lanza K (2019) A methodological assessment of extreme heat mortality modeling and heat vulnerability mapping in Dallas, Texas. Urban Clim 30:100528. https://doi.org/10.1016/j.uclim.2019.100528
McMichael AJ, Wilkinson P, Kovats RS et al (2008) International study of temperature, heat and urban mortality: the “ISOTHURM” project. Int J Epidemiol 37:1121–1131. https://doi.org/10.1093/ije/dyn086
Medina-Ramón M, Schwartz J (2007) Temperature, temperature extremes, and mortality: a study of acclimatisation and effect modification in 50 US cities. Occup Environ Med 64:827–833. https://doi.org/10.1136/oem.2007.033175
Medina-Ramón M, Zanobetti A, Cavanagh DP, Schwartz J (2006) Extreme temperatures and mortality: assessing effect modification by personal characteristics and specific cause of death in a multi-city case-only analysis. Environ Health Perspect 114:1331–1336. https://doi.org/10.1289/ehp.9074
Malaysia MOH (2016) Malaysia Health Facts 2016. Health Inform Cent Plan Dev Div 13:531–539.
Mohtar AAA, Latif MT, Baharudin NH, Ahamad F, Chung JX, Othman M, Juneng L (2018) Variation of major air pollutants in different seasonal conditions in an urban environment in Malaysia. Geosci Lett 5:1–21. https://doi.org/10.1186/s40562-018-0122-y
Patz JA, Frumkin H, Holloway T, Vimont DJ, Haines A (2014) Climate change: challenges and opportunities for global health. JAMA - J Am Med Assoc 312(15):1565–1580. https://doi.org/10.1001/jama.2014.13186
Peng RD, Dominici F, Louis TA (2006) Model choice in time series studies of air pollution and mortality. J R Stat Soc Ser A Stat Soc 169(2):179–203. https://doi.org/10.1111/j.1467-985X.2006.00410.x
Rocklöv J, Forsberg B (2008) The effect of temperature on mortality in Stockholm 1998—2003: a study of lag structures and heatwave effects. Scand J Public Health 36(5):516–523. https://doi.org/10.1177/1403494807088458
Seposo XT, Dang TN, Honda Y (2015) Evaluating the effects of temperature on mortality in Manila city (Philippines) from 2006–2010 using a distributed lag nonlinear model. Int J Environ Res Public Health 12:6842–6857. https://doi.org/10.3390/ijerph120606842
Stafoggia M, Schwartz J, Forastiere F, Perucci CA (2008) Does temperature modify the association between air pollution and mortality? A multicity case-crossover analysis in Italy. Am J Epidemiol 67(12):1476–1485. https://doi.org/10.1093/aje/kwn074
Tangang FT, Juneng L, Salimun E, et al (2012) Climate change and variability over Malaysia: gaps in science and research information. Sains Malaysiana
Thorsson S, Rocklöv J, Konarska J, Lindberg F, Holmer B, Dousset B, Rayner D (2014) Mean radiant temperature - a predictor of heat related mortality. Urban Clim 10(2):332–345. https://doi.org/10.1016/j.uclim.2014.01.004
Tobías A, Armstrong B, Gasparrini A (2016) Investigating uncertainty in the minimum mortality temperature: methods and application to 52 Spanish cities. Epidemiology 28(1):72–76. https://doi.org/10.1097/EDE.0000000000000567
Todd N, Valleron AJ (2015) Space–time covariation of mortality with temperature: a systematic study of deaths in France, 1968–2009. Environ Health Perspect 123(7):659–664. https://doi.org/10.1289/ehp.1307771
Tong S, Wang XY, Guo Y (2012) Assessing the short-term effects of heatwaves on mortality and morbidity in Brisbane, Australia: comparison of case-crossover and time series analyses. PLoS One 7(5):e37500. https://doi.org/10.1371/journal.pone.0037500
Wu W, Xiao Y, Li G, Zeng W, Lin H, Rutherford S, Xu Y, Luo Y, Xu X, Chu C, Ma W (2013) Temperature-mortality relationship in four subtropical Chinese cities: a time-series study using a distributed lag non-linear model. Sci Total Environ 449:355–362. https://doi.org/10.1016/j.scitotenv.2013.01.090
Xie H, Yao Z, Zhang Y, Xu Y, Xu X, Liu T, Lin H, Lao X, Rutherford S, Chu C, Huang C, Baum S, Ma W (2013) Short-term effects of the 2008 cold spell on mortality in three subtropical cities in Guangdong province, China. Environ Health Perspect 121(2):210–216. https://doi.org/10.1289/ehp.1104541
Xuan LTT, Egondi T, Ngoan LT, Toan DTT, Huong LT (2014) Seasonality in mortality and its relationship to temperature among the older population in Hanoi, Vietnam. Glob Health Action 7:23115. https://doi.org/10.3402/gha.v7.23115
Yang J, Ou CQ, Ding Y, Zhou YX, Chen PY (2012) Daily temperature and mortality: a study of distributed lag non-linear effect and effect modification in Guangzhou. Environ Health A Glob Access Sci Source 11:63. https://doi.org/10.1186/1476-069X-11-63
Yatim ANM, Latif MT, Ahamad F, Khan MF, Nadzir MSM, Juneng L (2019) Observed trends in extreme temperature over the Klang Valley, Malaysia. Adv Atmos Sci 36(12):1355–1370. https://doi.org/10.1007/s00376-019-9075-0
Yin Q, Wang J, Ren Z, Li J, Guo Y (2019) Mapping the increased minimum mortality temperatures in the context of global climate change. Nat Commun 10:4640. https://doi.org/10.1038/s41467-019-12663-y
Yu W, Mengersen K, Wang X, Ye X, Guo Y, Pan X, Tong S (2012) Daily average temperature and mortality among the elderly: a meta-analysis and systematic review of epidemiological evidence. Int J Biometeorol 56(4):569–581. https://doi.org/10.1007/s00484-011-0497-3
Zhai G, Zhang K, Chai G (2021) Lag effect of ambient temperature on the cardiovascular disease hospital admission in Jiuquan, China. Air Qual Atmos Health 14:181–189. https://doi.org/10.1007/s11869-020-00924-5
Zhang Y, Li C, Feng R, Zhu Y, Wu K, Tan X, Ma L (2016) The short-term effect of ambient temperature on mortality in Wuhan, China: a time-series study using a distributed lag non-linear model. Int J Environ Res Public Health 13(7):722. https://doi.org/10.3390/ijerph13070722
Acknowledgements
We thank the Malaysian Meteorological Department and the Department of Environment for supplying the temperature data and air pollution data. Special thanks to the Director-General of Health, Malaysia, and Health Informatics Centre at the Ministry of Health, Malaysia, for providing us with the mortality data. Special thanks to K. Alexander for proofreading this manuscript. The main author is a PhD candidate and supported by the Faculty Science and Natural Resources, University of Malaysia Sabah, 88400, Kota Kinabalu, Sabah
Availability of data and materials
The data that support the findings of this study are available from the corresponding author upon reasonable request
Funding
This research was partially supported by the Newton-Ungku Omar Fund (XX-2017-002).
Author information
Authors and Affiliations
Contributions
Ahmad Norazhar Mohd Yatim: writing—original draft and formal analysis. Mohd Talib Latif: supervision, reviewing, and editing. Fatimah Ahamad: reviewing and editing. Md Firoz Khan: supervision, reviewing, and editing. Nurzawani Md Sofwan: resource, writing, and editing. Wan Rozita Wan Mahiyudddin: conceptualization, methodology, and validation. Mazrura Sahani: conceptualization, methodology, and validation
Corresponding author
Ethics declarations
Ethics approval and consent to participate
Medical ethics approval was obtained from the Medical Research Ethical Committee (MREC), Ministry of Health, Malaysia (NMRR Code: NMRR ID: 19-921-46483).
Consent for publication
Not applicable
Consent for participate
Not applicable
Competing interests
The authors declare no competing interests.
Additional information
Responsible Editor: Lotfi Aleya
Publisher’s note
Springer Nature remains neutral with regard to jurisdictional claims in published maps and institutional affiliations.
Supplementary Information
ESM 1
(DOCX 220 kb)
Rights and permissions
About this article

Cite this article
Yatim, A.N.M., Latif, M.T., Sofwan, N.M. et al. The association between temperature and cause-specific mortality in the Klang Valley, Malaysia. Environ Sci Pollut Res 28, 60209–60220 (2021). https://doi.org/10.1007/s11356-021-14962-8
Received:
Accepted:
Published:
Issue Date:
DOI: https://doi.org/10.1007/s11356-021-14962-8