
Abstract
Through this paper we propose and test a GIS framework that addresses the issue of seismic risk due to urban road network failure. The approach relies on full GIS integration, on Monte Carlo simulations for generating potentially disrupted network configurations, considering also the damage probability due to direct earthquake implications, and on traffic considerations (both in typical and post-earthquake situations). The damage probability can be obtained using fragility functions for critical structures like bridges and tunnels or by determining empirically the possibility of affected buildings to generate debris leading to road obstruction. Multiple performance indicators such as travel time and distance under various conditions are combined, in order to quantify the risks inflicted by dysfunctionalities in the emergency intervention process. The framework considers at the same time temporal and spatial dimensions, being able to cope with traffic dynamics or reconfigurable network configurations. The ArcGIS Network Analyst Module is used for model integration, and full city scale analysis is performed in order to test the capabilities. Bucharest (capital of Romania) is selected for the case study; this 2 million inhabitant city is one of the most endangered in Europe, due to earthquakes that occur in the Vrancea Area, at intermediate depth, with moment magnitudes > 7, but also due to the vulnerable building stock. Beside this, it is one of Europe’s top cities when it comes to traffic congestion. The results of the study provide initial insights on the deficiencies of the city’s road network and connectivity limitations, showing the high impact of road obstructions and traffic congestion on intervention times, for ambulances and firefighters, in case of an earthquake.
1 Introduction
Major earthquakes near urban areas are extremely dangerous, since they have the capacity to produce a large amount of damage in a very short amount of time. The transportation networks play a vital role, both immediately after an earthquake, and also long time after it occurred: they constitute support for fast intervention and recovery efforts. Therefore, their functionality and capability to adapt to new demands is a key aspect in reducing social and economic losses.
Cities are complex environments, and complexity in many cases leads to an increased vulnerability (Fleischhauer 2008). Also, the expansion of urbanisation leads to unprecedented levels of exposure to natural hazards. Recent earthquakes such as the ones in Italy (2016, 2009), Nepal (2015), Japan (2011), Haiti (2010), China (2008) or Indonesia (2004) proved that, regardless of the preparations for a considerable earthquake, significant damage and dysfunctionalities can still affect urban areas, their population and the infrastructure. Road networks can generally be considered the most important transportation infrastructure, since they physically interconnect people all around the world, in a direct, affordable and flexible manner. As experiences from previous earthquakes show, road networks can be affected by two main groups of factors: direct damage (the collapse of structures such as bridges and tunnels, effects of liquefaction, etc.) and indirect damage (blockage due to debris from buildings, due to traffic congestion, etc.). The ability of a network to function and adapt to new sudden conditions is an important feature that needs to be achieved in order to prevent from further social and economic losses. In the assessment process, it is of great interest to understand the answer to questions such as the following:
-
How vulnerable is the current road network configuration?
-
Which are the vital roads in case of an earthquake, for emergency intervention, evacuation and recovery efforts? Are there any detour options?
-
Which are the socio-economic implications of disrupted road networks, hours and days after an earthquake?
-
Which improvements could be effective—new roads, traffic reduction or others?
Answering these questions is a difficult task, and we are currently facing many problems related to the high degree of uncertainty of the results and the sparse real data to develop methodologies upon and validate models. But significant progress is made, with the aid of new technologies.
The first part of assessing the seismic risk of urban road networks refers to the evaluation of direct loss probability of individual network components. Many studies (such as Ditlevsen and Madsen 1996; Basoz et al. 1999; Fardis 2009; Cardone 2013; Zanini et al. 2017) tackle this problem, from an engineering point of view. But the context is much more ample; seismic risk also has to be explained and quantified considering the implications of connectivity loss and traffic shifts generated. Several researchers and studies (such as Nuti and Vanzi 1998; Veneziano et al. 2002; Karaca 2005; Franchin et al. 2006; Goretti and Sarli 2006; Douglas et al. 2007; Bono and Gutierrez 2011; Caiado et al. 2012; Argyroudis et al. 2015) made the next step, going beyond the simple summation of direct loss and including consideration of the interactions between system components in determining the deterioration of the system function due to an earthquake (Pitilakis and Kakderi 2011).
In the past two decades, a significant progress was made in the road network vulnerability and risk assessment field of study (for a comprehensive literature overview we recommend Franchin et al. 2011). Researchers started to focus more and more on developing models to explain the intricate processes that lead to risk due to road networks behaviour, taking advantage of computer processing capabilities, big data or newly developed field equipment and methodologies. A “big picture” analysis (that allows insights on risk quantification) requires a combination of knowledge from multiple domains, like seismology, structural engineering, geomorphology, geography, cybernetics or statistics. As it happens in many other domains, the analysis at urban level poses the greatest challenges. In our study, we develop and test a new methodology suitable for this purpose (nevertheless being applicable to regional/national scale), exploiting the capabilities of geographic information systems (GIS).
Our specific interest is to find a fit approach for estimating the seismic risk inflicted by the road network in Bucharest, capital of Romania, a 2 million people city that was and will be affected (Toma-Danila and Armas 2017) by strong earthquakes originating from the Vrancea Seismic Source.
2 Methodology
A good starting point in determining the effects that urban road networks have in terms of direct and indirect risk is the identification of problems that affect them when earthquakes strike. We determined the following:
-
Different road segments can be damaged and become impracticable for hours, days or months, due to vulnerabilities to ground motion. Suspended structures like bridges or overpasses are most vulnerable (Fig. 1), being also in many cases vital links within the road network (as the experience of the 1994 Northridge earthquake, narrated in Basoz et al. 1999 and of the 1995 Great Hanshin earthquake, showed); tunnels can also be affected, although the damage probability can be referred in general as smaller (Franchin et al. 2011). The degradation of structures in time also needs to be accounted for (Kumar and Gardoni 2014; Morbin et al. 2015). As Fig. 1 shows, the collapse of bridge sections not only makes the top section unusable, but also the bottom sections. Depending on topology and local soil effects (liquefaction), some road segments at ground level can be affected, completely or partially (Franchin et al. 2011).
Fig. 1 
Sources: Paul Harris/Getty Images and Yozo Fujino
Photographs of the freeways affected directly by the 1994 Northridge Earthquake (left) and 1995 Great Hanshin Earthquake (right).
-
Earthquake-triggered effects like floods, tsunamis, accidents or explosions can also cause the severe disruption of road networks (Kawashima and Matsuzaki 2012).
-
The collapse of buildings can obstruct partially or completely the circulation on road segments, due to debris, emergency and recovery interventions (Zanini et al. 2017).
-
Social behaviour can cause functionality problems (Fig. 2). After an earthquake, most people get out of the buildings and fill in the streets. Shelter places are established, which leads to new traffic paths (Hadas et al. 2015); many people tend to use their cars, to travel within or out of the city, to their acquaintances or to other destinations (office, rescue volunteering, etc.). Traffic patterns change considerably (Chang et al. 2012), and the possibility of car accidents significantly increases (traffic rules are often disrespected). Since there is no clear image of affected areas, traffic jams form quickly. The public transport usually does not work for some time. All these aspects lead to additional risks.
Fig. 2 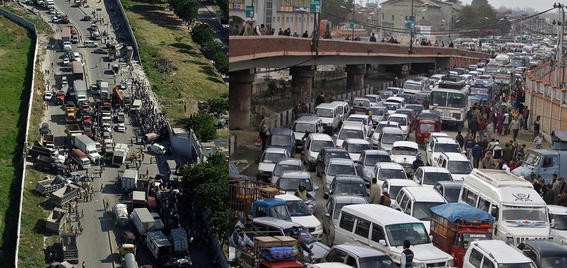
Sources: AP Images and Danish Ismail/Reuters
Photographs of the post-earthquake traffic in Haiti, near the airport, after the 2010 earthquake (left), and in Pakistan, after the 2015 earthquake (right).
-
Emergency intervention vehicles are everywhere, from firefighters, ambulances, police and construction vehicles to military forces. There are also vehicles from utility distributers and providers (gas, water, sewage, electricity), and many interventions lead to road blockages. Long time after a damaging earthquake occurred, vehicles supporting the recovery efforts will be present. Some roads will need to be temporarily closed.


These key aspects need to be considered in a methodology reflecting the risk implications due to altered road networks after major earthquakes. In order to address the issues, inventory characterisation is the essential initial step. All types of road elements need to be identified, characterised and classified according to their specific typology, distinctive geometric, structural and functional features (Pitilakis and Kakderi 2011). Geographic information systems (GIS) are the dedicated solution for handling geospatial content and have the capability to model transportation networks and inter and intra component relations. One the most advanced and used (Sevtsuk et al. 2012; Karduni et al. 2016) commercial GIS platform for road network modelling is ArcGIS, together with its Network Analyst Module. This solution was also preferred in our study due to its flexibility, specialised tools for road network definition or routing algorithms, but other solutions are also available. A downside of ArcGIS is that it cannot yet perform dynamic traffic simulation, in order to compute congestion based on individual trip generators.
As mentioned, road network GIS data are the starting point of the analysis; nowadays, it can be obtained from various sources that might offer more or less updated information. National datasets can be a reliable source, but also open-source or privately available data can be very useful. The OpenStreetMap Project is one of the best initiatives that provide free, relatively accurate and updated (depending on the efforts of voluntaries) GIS road network vector data, and we recommend contributing to and using it. Traffic data are essential for modelling the actual problems imposed by the usage of the network (which is its fundamental purpose), with respect to human activity. Obtaining this type of data can be difficult; however, the new ways of collecting data, through the use of crowd-sourced smartphone data or digital sensors, make this process easier for major companies, which embed in their products live or historical traffic maps and services. However, they are generally not making quantitative data available. National authorities also have responsibilities in monitoring traffic, and some data can be obtained from them.
For the estimation of seismic risk implications on road networks, it is first of all necessary to assess the vulnerability of structural elements and also evaluate the seismic hazard and local site effects in relevant terms, such as peak ground velocity, acceleration and displacement or liquefaction and landslide susceptibility. The methodology that we present implies adding an additional attribute to the typical definition schema of road segments (which usually consists of hierarchy, length, width, maximum speed, restrictions or Z elevation): probability of roads to become impracticable in case of an earthquake. This attribute summarises and joins various outputs of different seismic vulnerability analyses. The value can evolve in a temporal context, depending on the time needed for restoration. This probability can be determined based on various considerations presented earlier: structural failure in case of bridges or tunnels, blockage due to building debris or traffic, etc. Expert judgement, remote sensing or empirical formulas (Anbazhagan et al. 2012) can also be used. In structural cases, fragility curves can provide the quantification for this probability. Hazus-MH (FEMA 2014) has an integrated solution dedicated to quantifying damage probability (without considering failure implications more than in terms of reconstruction costs).
The novelty of the proposed framework (Fig. 3) is in its capabilities, oriented towards determining practical solutions to problems of effective emergency route planning or risk determined by dysfunctionalities propagated at infrastructure level. Among these capabilities are:

Conceptual flowchart of the research process
-
Full integration within GIS.
-
The use of Monte Carlo simulations that consider obstruction probability, in order to determine and test various configurations of potentially disrupted road networks.
-
Possibility to use traffic data; assumptions on post-earthquake traffic patterns are also included.
-
It allows route, service area and origin–destination (O–D) analysis, and also the computation of custom performance indicators, considering affected buildings and areas, locations of emergency intervention authorities (hospitals, firefighters, police, etc.) and others.
The methodology was fully integrated within GIS (ArcGIS with the Network Analyst Module); in Fig. 3 it presented the logic flowchart, which was implemented in ArcGIS through the ModelBuilder. Within ArcGIS we employed toolboxes such as Field Calculator with random number generation (for Monte Carlo simulations), Feature to Point (for creating barriers), Identify, Build Network, Make Service Area, Load Locations or Merge. A practical aspect that needs to be considered in implementation is that, in order to automate the task of generating performance indicators for multiple road network scenarios with various configurations, a very simple network with the needed attributes has to be used as already built network, to which other road segments (thousands) are added.
We consider that post-earthquake traffic considerations are highly important and need to be included in the analysis; that is why we added a segment dedicated to the determination of areas influenced by the obstruction of road segments, indirectly. The assumption we made (built also upon information from papers such as Chang et al. 2012; Zanini et al. 2017) is as follows: up to 100 m away from an affected building, the traffic can be considered as almost stopped, and up to 500 m away from it the traffic is severely slowed down (at least in the first hours after an earthquake). Other assumptions and parameters can be easily integrated. In future studies, we aim to use urban traffic simulation models, based on typical post-earthquake behaviour (specific travel patterns, individual decision simulator, etc.).
For each scenario, performance indicators such as travel time and distance in normal, typical traffic and disrupted network conditions are computed and are later aggregated into a summarised “big picture” which shows the overall potential risks generated by the network dysfunctionalities. As intervention delay time can be correlated with risk of not being able to save people in time (Coburn and Spence 2002), the methodology can estimate if the potential state of road network can lead to losses of lives due to incapacity of reliable emergency intervention. Also, the methodology can highlight the need of safer routes and aid in the mitigation planning efforts.
By using the results provided by the framework, the actual and potential spatial distribution of emergency hospitals, firefighter facilities, evacuation centres, etc., can assessed, in terms of impact and usefulness. To expand the framework, modules such as ArcCasper (Shahabi and Wilson 2014) can be added, enhancing the analysis capabilities.
3 Bucharest case study
3.1 Description of the area
In order to test the presented methodology, we chose one of Europe’s most endangered capitals, when it comes to earthquakes, but also to traffic—Bucharest, Romania. The city was and can be highly affected by earthquakes originating from the Vrancea intermediate-depth seismic source, as studies like Giardini et al. (2013) or Toma-Danila and Armas (2017) show. Statistically, 2–3 earthquakes with magnitude > 7 occur per century in this source, at depths in the range of 70–150 km. The March 4, 1977 earthquake destroyed more than 33 medium and high-rise buildings and had a death tool of 1424 for Bucharest (Toma-Danila and Armas 2017). There are few mentions regarding the behaviour of road networks during this event; we found that although many people were out on the streets for several hours, no major blockages beside the areas where buildings collapsed and the areas of emergency hospitals were recorded. However, in those times, the situation was much different than today: there was no private sector, the traffic congestion was non-existent (not many citizens owning a car), and the management decision flow was procedurally more “militarised”.
Nowadays, Bucharest is the leading city in Europe (and the 5th in the world) when it comes to typical road congestion level (TomTom 2017). In a 2 million inhabitant city, there are over 1.2 million vehicles registered (National Institute for Statistics 2015). The additional number of people which do not have the residence in Bucharest but work or study here adds more pressure, as also the inefficiency of public transport and mentality problems (many people choose to ride the cars alone, considering that is a basic right they have to take advantage, not caring about consequences). Giving that very few significant infrastructure projects supporting new volumes of traffic and offering alternatives were finalised in the last 27 years, it is clear that the city’s road network is not prepared not even for morning rush hour. From a different perspective, the fact that not a lot of long bridges, suspended freeway sections or intricate junctions are constructed can be seen as a less vulnerable aspect in the analysis of the urban road networks, but the traffic still remains a major problem, together with the high possibility of debris blockages, mainly in the city centre. The perspective of a future earthquake seems grey when considering potential building losses, as recent studies show: 349 buildings were officially listed as being in seismic risk class I, out of 856 expertise buildings (BGM 2016), and 31.430 buildings constructed prior to any seismic design code (10% of the total building stock in Bucharest) are still in place (Toma-Danila and Armas 2017). Under these conditions, the pressure on the road network is expected to be considerable, long time after a major earthquake.
3.2 Data and methods
The road network that we used in the analysis was obtained from a free OpenStreetMap GIS database repository (http://download.geofabrik.de/) and was rearranged according to ArcGIS Network Analyst specifications.
By using the official list of buildings classified in the seismic risk class I (BGM 2016), buildings (mostly medium and high-rise) with high probability of collapse “in case of a design earthquake corresponding to the limit state” (BGM 2016) were identified, mapped as polygons and buffers were calculated around them (Fig. 4), based on the formula from RISK-UE (2001–2004) presented in Eq. (1). Other formulas, considering also the construction material or the adjacency of other buildings (Argyroudis et al. 2005; Zanini et al. 2017) can be used. For roads within the buffer areas, probabilities of obstruction with debris were assigned.

Practical example of the procedure for determining the probability of road segments to become obstructed due to building debris (relying in this case on spatial analysis and expert judgement for assigning probability values)
In determining the final probability of road obstruction, we took into consideration also the width of the road near the affected building; for a low hierarchy (narrow) road, the probability assigned was greater than in the case of a high hierarchy road, but the maximum value was in all cases 70%, since 100% would have meant certain blockage, no matter of the Monte Carlo simulation.
For reinforced concrete bridges crossing the Dambovita River we associated mean fragility functions from Crowley et al. (2011); considering the maximum Vrancea earthquake scenario for the 475-year recurrence period and the microzonation map of Bucharest (Marmureanu et al. 2010), we obtained a probability for complete damage of around 1.5–2%, which is within the range provided by expert opinion of Bucharest engineers.
Considerations regarding the 8 AM Monday typical traffic (rush hour) were added, by using Google Traffic qualitative data, georeferenced and converted into three traffic area zones (with respect to the direction of movement on each link), which can be seen in Fig. 5. Travel times were calculated considering the following vehicle speeds:

Study area, showing the Bucharest road network depending on hierarchy (left) or traffic on a typical Monday morning (right), the locations of emergency hospitals and firefighter stations and the road segments considered as potentially obstructed during an earthquake (left)
-
Traffic zone 1: 5 km/h.
-
Traffic zone 2: 10 km/h.
-
Traffic zone 3: Maximum allowed speed (50 km/h in most areas within the city).
The routing results in no damage conditions were compared with the estimated travel time in commercial software, and for relevant O–D pairs crossing the city, the time differences were small (< 8 min), proving that the reconstruction process was roughly reliable.
The locations of all emergency hospitals and firefighter stations in Bucharest were used for determining optimum intervention times, but no considerations regarding the technical and physical capabilities of these locations were taken into consideration at this point. Since the analysis is addressed to emergency intervention vehicles, no one-way restrictions were considered in the computation of performance indicators.
3.3 Results
In order to prove the capabilities of the methodology at a large urban scale, we chose to use the entire road network of the city. ArcGIS was able to handle such a vast amount of network data; for a single scenario simulation, 9–10 min were necessary on a standard workstation, for a network comprising of more than 50.000 segments for which various spatial analysis and table calculations had to be performed.
In the following Figures, we present some of the results, obtained through the use of the service area algorithm. They depict the merged areas of intervention in terms of minutes, using emergency hospitals and firefighter stations as facilities. Service areas have been trimmed around the edges in order not to show the errors that inherently occur when exiting the case study area; however, the entire road network configuration (also the belt of the city, as relevant final interconnection system) has been used in the calculations.
Figure 6 presents the summarised results of the analysis, considering emergency hospitals as facilities. Maps show basically the minimum amount of time it can take for an ambulance of an emergency hospital to reach a certain area within the city, considering that all emergency hospitals have this capacity. In reality, origins for ambulances and intervention areas are expected to change also temporarily, in a more inefficient way. Service areas can be easily computed also for other specific facility configurations, in case a hospital is interested of its own service area. Maps can also be interpreted in reverse, reflecting the minimum amount of time it can take to get to the nearest emergency hospital (nearest should better refer to minutes and not to distance, considering traffic and road obstructions). Figure 6a, c includes 8 AM Monday typical traffic considerations, and it is evident that in comparison with Fig. 6b), the intervention time greatly increases. A high vulnerability pattern can be seen in the city centre (due to the many vulnerable buildings that have the potential to block roads), no matter of the traffic; this pattern extends on the north-east—south-west axis (partially due to the anisotropic distribution of hospitals). When typical Monday morning traffic is considered, the western part of the city has an increased ambulance intervention time vulnerability. Figure 6a, b shows all the potentially obstructed roads considered in a worst-case scenario (disregarding probability aspects). They were used in the Monte Carlo simulation (considering this time their probabilities), which produced 50 scenarios with smaller number of segments affected. Figure 6c, d are linked one to another; the 50 simulated scenarios were averaged, and also the standard deviation was computed, showing how modifiable the service area times can be, depending on different damage distribution scenarios. There can be distinguished several areas where, depending on road obstructions, intervention times can be greatly influenced, and standard deviation shows them. This also means that for these areas, some routes are vulnerable and no proper detours are available.

Maps with service areas for all emergency hospitals in Bucharest, considering different road network configurations: a worst-case scenario (all potentially obstructed roads affected) with 8 AM Monday typical traffic; b worst-case scenario with no traffic; c Monte Carlo simulated scenarios with 8 AM Monday typical traffic, averaged; d standard deviation for the scenarios averaged in (c)
In Fig. 7 are represented service areas for the firefighter facilities. The top maps show the situation in case of a worst-case scenario (all potentially obstructed roads are affected), and considering typical Monday morning traffic or no traffic. As expected, when traffic is considered, some areas appear more vulnerability-prone, such as the north-western and north-eastern parts of the city, where morning traffic is heavy. The bottom maps show another important aspect: the difference between no damage scenario and worst-case scenario, in terms of time difference for service areas. They show clear evidence that the roads in the city centre can drastically modify their functionality and capability to handle traffic; another area seems to be significantly affected by obstructions, when traffic is considered: the north-western part of the city (Crangasi-Giulesti area).

Maps with service areas for all firefighter stations in Bucharest, considering different road network configurations: a worst-case scenario with 8 AM Monday typical traffic; b worst-case scenario with no traffic; c difference between normal conditions and worst-case scenario, with 8 AM Monday typical traffic considerations; d difference between normal conditions and worst-case scenario, with no traffic considerations
In Fig. 8, a preliminary attempt to aggregate the results consisting of service areas for emergency hospitals and firefighter stations was performed, through the use of the following formula, applied to no traffic and typical Monday morning traffic scenarios:
where WCH = worst-case scenario service area value for emergency hospitals; A H = averaged service area for Monte Carlo simulated scenarios for emergency hospitals and WCF = worst-case scenario service area value for firefighter units.

Maps expressing the qualitative intervention time for ambulance and firefighter units, considering two types of traffic: a 8 AM Monday typical traffic; b no traffic
The determination of qualitative intervals was done using the following classification: 0–2 min: very good; 2–10 min: good; 10–20 min: Moderate; 20–30 min: High; > 30 min: very high.
Figures indicate, as expected, high vulnerabilities for the Historical Centre of Bucharest, no matter of the traffic. This is due to the road network configuration and characteristics (small width roads), but mostly due to vulnerability caused by the many buildings that could collapse and generate debris and transit disruptions. For people in this area, the intervention times can be considerable in case of a major earthquake, leading to an indirect seismic risk. Therefore, a less vulnerable access route to the core of this area has to be created. There are also areas where the overall intervention time can be high: the western, north-eastern and south-western parts of the city, especially when considering typical traffic characteristics.
4 Conclusions
Within this paper it was presented and tested a new methodology for considering the implications (direct and indirect) of seismic damage on the functionality of road networks. The methodology provides results of great use for evaluating the efficiency of emergency interventions, aiding in the mitigation planning effort and seismic risk evaluation. The urban environment poses specific challenges to the analysis, but as was demonstrated; nowadays, GIS is capable of handling vast amount of road networks, with tens of thousands of individual segments, enabling also the work not only at single scenario level, but also for multiple scenarios obtained through Monte Carlo simulation. The collection of data (such as the definition of road networks or buildings that can cause debris) and also the quantification of various vulnerabilities and interdependencies can be difficult, but free useful data sources are available—some are mentioned in this paper. The methodology is flexible and leads to a standardised approach, rather than a custom built for a specific case study. Newly and more refined data (such as traffic values or social behaviour patterns) can also be easily integrated. Although the analysis is at urban level, there are no significant limitations for performing it to other scales (regional or national)—the major problem is the size of the road network database.
For the first time, we brought evidences at city scale on what could be Bucharest’s potential risk due to intervention time delays in case of an earthquake. Results show that in the city centre, emergency intervention access can be very difficult. The potential collapse of old buildings, leading to blockages and traffic congestion, is a factor that would make the city centre’s accessibility very difficult. The city traffic can highly contribute to increased intervention times; therefore, the capability of the road network to function efficiently is highly influenced by the time when an earthquake could occur. In some cases, it could take more than twice as much time to reach a destination. The final maps in Fig. 8 show relevant aspects regarding the potential of emergency intervention of authorities, although not considering yet the endowments of each specific facility. The maps constitute great support in the effort of planning and mitigation, both for authorities, businesses and citizens (although particular care has to be considered at this moment, high uncertainties having to be considered).
This study was first of all a proof of a functioning concept and of a viable GIS implementation scheme. In future studies, we will further refine our model, perform more Monte Carlo simulations, consider more typical traffic scenarios, try to use simulated traffic flows for post-earthquake situations and try to address more quantitatively the problem of human and economic losses due to road network dysfunctionalities.
References
Anbazhagan P, Srinivas S, Chandran D (2012) Classification of road damage due to earthquakes. Nat Hazards 60:425–460
Argyroudis SA, Pitilakis KD, Anastasiadis AI (2005) Roadway network seismic risk analysis in urban areas: the case of Thessaloniki—Greece. In: Proceedings of Geoline, Lyon, France
Argyroudis S, Selva J, Gehl P, Pitilakis K (2015) Systemic seismic risk assessment of road networks considering interactions with the built environment. Comput Aided Civil Infrastruct Eng 30:524–540
Basoz N, Kiremidjian A, King S, Law K (1999) Statistical analysis of bridge damage data from the 1994 Northridge, CA, earthquake. Earthq Spectra 15(1):25–54
Bono F, Gutierrez E (2011) A network-based analysis of the impact of structural damage on urban accessibility following a disaster: the case of the seismically damaged Port Au Prince and Carrefour urban road networks. J Transp Geogr 19:1443–1455
(BGM) Bucharest General Municipality (2016) List of buildings technically expertise, classified into seismic risk classes. www.pmb.ro. Accessed 29 Jan 2016
Caiado G, Oliveira C, Ferreira MA, Sa F (2012) Assessing urban road network seismic vulnerability: an integrated approach. In: Proceedings of the 15WCEE, Lisbon, Portugal
Cardone D (2013) Displacement limits and performance displacement profiles in support of direct displacement-based seismic assessment of bridges. Earthq Eng Struct Dyn 43(8):1239–1263
Chang L, Elnashai AS, Spencer B Jr (2012) Post-earthquake modelling of transportation networks. Struct Infrastruct Eng 8(10):893–911
Coburn A, Spence E (2002) Earthquake protection. Wiley, Hoboken
Crowley H, Colombi M, Silva V, Monteiro R, Ozcebe S, Fardis M, Tsionis G, Askouni P (2011) Fragility functions for roadway bridges, D3.6 of the SYNER-G Project
Ditlevsen O, Madsen HO (1996) Structural reliability methods. Wiley, Chichester
Douglas J, Serrano JJ, Comte J, Bouc O, Arnal C, Robida F, Modaressi H, Logtmeijer C, Vowles G, Holt I (2007) Risk assessment for the road network in the French-Italian border region using web services. In: 17th IIASA-DPRI forum on integrated disaster risk management, Stresa, Italia
Fardis MN (2009) Seismic design, assessment and retrofitting of concrete buildings. Springer, Berlin
FEMA (2014) HAZUS-MH: Multi-hazard Loss Estimation Methodology. http://www.fema.gov/hazus. Accessed 21 Feb 2016
Fleischhauer M (2008) The role of spatial planning in strengthening urban resilience. In: Kirillov IA, Pasman HJ (eds) Resilience of cities to terrorist and other threats. Springer, Berlin
Franchin P, Lupoi A, Pinto PE (2006) On the role of road networks in reducing human losses after earthquakes. J Earthq Eng 10(2):195–206
Franchin P, Cavalieri F, Pinto P et al (2011) General methodology for systemic vulnerability assessment, D2.1 of the SYNER-G Project
Giardini D, Woessner J, Danciu L, Crowley H, Cotton F, Grünthal G, Pinho R, Valensise G, SHARE consortium (2013) SHARE European seismic hazard map for peak ground acceleration, 10% exceedance probabilities in 50 years. https://doi.org/10.2777/30345
Goretti A, Sarli V (2006) Road network and damaged buildings in urban areas: short and long-term interaction. Bull Earthq Eng 4:159–175
Hadas Y, Rossi R, Gastaldi M, Pellegrino C, Zanini MA, Modena C (2015) Optimal critical infrastructure retrofitting model for evacuation planning. Transp Res Procedia 10:714–724
Karaca E (2005) Regional earthquake loss estimation: role of transportation network, sensitivity and uncertainty, and risk mitigation. Ph.D. Thesis, MIT, Cambridge, MA
Karduni A, Kermanshah A, Derrible S (2016) A protocol to convert spatial polyline data to network formats and applications to world urban road networks. Scientific Data, Vol. 3, Nature Publishing Group, https://doi.org/10.1038/sdata.2016.46
Kawashima K, Matsuzake H (2012) Damage of road bridges by 2011 Great East Japan (Tohoku) earthquake. In: Proceedings of the 15WCEE, Lisbon, Portugal
Kumar R, Gardoni P (2014) Effect of seismic degradation on the fragility of reinforced concrete bridges. Eng Struct 79:267–275
Marmureanu G, Cioflan CO, Marmureanu A (2010) Researches on local seismic hazard (microzonation) for metropolitan Bucharest area (in Romanian: Cercetari privind hazardul seismic local (microzonare) a zonei metropolitane Bucuresti). Tehnopress, Iasi
Morbin R, Zanini MA, Pellegrino C, Zhang H, Modena C (2015) A probabilistic strategy for seismic assessment and FRP retrofitting of existing bridges. Bull Earthq Eng 13(8):2411–2428
National Institute for Statistics (2015) Registered vehicles that are in circulation. http://statistici.insse.ro/shop/index.jsp?page=tempo3&lang=ro&ind=TRN103B. Accessed 15 Mar 2017
Nuti C, Vanzi I (1998) Assessment of post-earthquake availability of hospital system and upgrading strategies. Earthq Eng Struct Dyn 27(12):1403–1423
Pitilakis KD, Kakderi KG (2011) Seismic risk assessment and management of lifelines, utilities and infrastructures. In: Proceedings of the 5th ICEGE, Santiago, Chile
RISK-UE (2001–2004) An advanced approach to earthquake risk scenarios with applications to different European towns. Research Project, European Commission, DG ΧΙI2001-2004, CEC Contract Number: EVK4-CT-2000-00014
Sevtsuk A, Mekonnen M (2012) Urban network analysis: a new toolbox for ArcGIS. Revue Internationale de Geomtique 22(2):287–305
Shahabi K, Wilson JP (2014) CASPER: intelligent capacity-aware evacuation routing. Comput Environ Urb Syst 46:12–24
Toma-Danila D, Armas I (2017) Insights into the possible seismic damage of residential buildings in Bucharest, Romania, at neighborhood resolution. Bull Earthq Eng 15(3):1161–1184
TomTom (2017) TomTom traffic index. https://www.tomtom.com/en_gb/trafficindex. Accessed 15 Mar 2017
Veneziano D, Sussman J, Gupta U, Kunnumkal SM (2002) Earthquake loss under limited trasnsportation capacity: assessment, sensitivity and remediation. In: Proceedings 7th USNCEE, Boston, MA, USA
Zanini MA, Faleschini F, Zampieri P, Pellegrino C, Gecchele F, Gastaldi M, Rossi R (2017) Post-quake urban road network functionality assessment for seismic emergency management in historical centres. Struct Infrastruct Eng 17(9):1117–1129
Acknowledgements
This work was supported by The Executive Unit for Financing the Higher Education and University Researches (UEFISCDI); through the NUCLEU CREATOR Programme, Project Nr. PN-16-35-02-03. We also acknowledge the contribution of the doctoral scholarship from Faculty of Geography, University of Bucharest.
Author information
Authors and Affiliations
Corresponding author
Rights and permissions
About this article

Cite this article
Toma-Danila, D. A GIS framework for evaluating the implications of urban road network failure due to earthquakes: Bucharest (Romania) case study. Nat Hazards 93 (Suppl 1), 97–111 (2018). https://doi.org/10.1007/s11069-017-3069-y
Received:
Accepted:
Published:
Issue Date:
DOI: https://doi.org/10.1007/s11069-017-3069-y