
Abstract
Lung cancer is one of the main reasons for death in the world among both men and women, with an impressive rate of about five million deadly cases per year. Computed Tomography (CT) scan can provide valuable information in the diagnosis of lung diseases. The main objective of this work is to detect the cancerous lung nodules from the given input lung image and to classify the lung cancer and its severity. To detect the location of the cancerous lung nodules, this work uses novel Deep learning methods. This work uses best feature extraction techniques such as Histogram of oriented Gradients (HoG), wavelet transform-based features, Local Binary Pattern (LBP), Scale Invariant Feature Transform (SIFT) and Zernike Moment. After extracting texture, geometric, volumetric and intensity features, Fuzzy Particle Swarm Optimization (FPSO) algorithm is applied for selecting the best feature. Finally, these features are classified using Deep learning. A novel FPSOCNN reduces computational complexity of CNN. An additional valuation is performed on another dataset coming from Arthi Scan Hospital which is a real-time data set. From the experimental results, it is shown that novel FPSOCNN performs better than other techniques.
1 Introduction
Lung cancer is one of the most important deadly diseases in the world [30, 37]. The recent estimates provided by World Health Organization (WHO) says that around 7.6 million deaths worldwide per year due to lung cancer [21, 22]. Moreover, humanity due to cancer are supposed to continue rising, to become around 17 million worldwide in 2030 [15]. Discovering lung cancer in the early stage is the only method for its cure [12]. Different methods are available for diagnosis lung cancer, namely, MRI, isotope, X-ray and CT. X-ray chest radiography and Computer Tomography (CT) are the two familiar anatomic imaging modalities that are regularly used in the recognition of different lung diseases [25, 29]. CT images are used by physicians and radiologists to identify and recognize the presence of diseases, directly visualize the morphologic extents of diseases, describe the patterns and severity of diseases, and measure the clinical course of diseases and response to therapy. The volumetric CT technique has introduced spiral scans which shorten the scan time and, when used in thoracic imaging, reduce the artefacts caused by partial volume effects, cardiac motion, and unequal respiratory cycles. As the progress of CT technology, the high-resolution CT test has happen to the imaging modality of choice for the recognition and identification of lung diseases. Even though High-Resolution Computed Tomography (HRCT) recommends images of the lung with progressively more improved anatomic resolution, visual interpretation or evaluation of a large number CT image slices remains as a difficult task.
In CT images, lung cancer disease cannot be identified easily as shown in Fig. 1. For lung cancer screening, Nowadays Low-Dose helical Computed Tomography (LDCT) [18] is being applied as a modality [31]. There are lots of works being done to develop computer assisted diagnosis and detection systems to improve the diagnostic quality for lung cancer detection classification [2]. The necessity for reliable and objective analysis has prompted the development of computer-aided systems. The aim of this work is to extract features for classification [4] and Severity finding.
a Represents the clear lung image, b Represents the diseased lung image
In this work, first the input image is enhanced by using histogram equalization for image contrast and denoised by using Adaptive Bilateral Filter (ABF). After pre-processing, the next step is to find the lung region extraction. To extract the lung region, Artificial Bee Colony (ABC) segmentation approach is applied. The holes in the lung region are filled by using mathematical morphology technique in the ABC segmented image. After that the texture features are extracted to find the cancerous lung nodules. After finding the location of the cancerous lung nodules the next process is to classify the lung disease name and its severity based on the feature extraction. A new CNN method based on FPSO for reducing the computational complexity of CNN is proposed. FPSOCNN improves the efficiency of CNN.
The main contributions of this paper are summarised as follows:
- (i)
Deep learning is applied to classify benign and malignant pulmonary nodules.
- (ii)
For extracting features, four features are used, namely, texture feature, geometric feature, volumetric feature and intensity features,
- (iii)
Best feature extraction techniques such as wavelet transform-based, Local Binary Pattern (LBP), Scale Invariant Feature Transform (SIFT), and Zernike Moment are used.
- (iv)
The proposed method provides good results for LIDC data set and real-time data set.
The manuscript of this paper is organised as follows: in Section 2, some related state-of-the-art literatures are reviewed. In Section 3, a detailed description of the proposed architecture is shown. In Section 4, experimental results are shown. Discussion is presented in Section 5. Finally, conclusions and future works are provided in Section 6.
2 Related work
During the most recent decades, prompt progress of pattern recognition and image processing techniques [37], lung cancer detection classification attracts more and more research works. Existing methods in the literature for differentiating a variety of obstructive lung diseases on the basis of textural analysis of thin-section CT images are explained. Chabat et al. [9] have created a 13-dimensional vector of local texture information, which contains statistical moments of CT attenuation distribution, acquisition-length parameters, and co-occurrence descriptors. For feature segmentation, a supervised Bayesian classifier is applied. Here, the dimensionality of the feature vector is reduced using five scalar measurements, namely, maximum, entropy, energy, contrast, and homogeneity that were extracted from each co-occurrence matrix obtained. Yanjie Zhu et al. [38] have presented texture features of Solitary Pulmonary Nodules (SPNs) detected by CT and evaluated. Totally, 67 features were extracted and around 25 features were finally selected after 300 genetic generations. For classification, SVM based classifier is applied. Sang Cheol Park et al. [25] have applied genetic algorithm to select optimal image features for Interstitial Lung Disease (ILD). Hiram et al. [23] have classified lung nodule using Frequency domain and SVM with RBF. Hong et al. [28] have proposed an algorithm for detecting solitary pulmonary nodules automatically. SVM classifier is applied to recognize true nodules and label them on original images. Antonio et al. [13] have classified lung nodules using the LIDC-IDRI image database. Taxonomic Diversity and Taxonomic Distinctness Indexes from ecology are applied with SVM [18] for classification. Results depict a mean accuracy of 98.11%.
In CT examination, only pixels selected by the mesh-grid region growth method were analyzed and classified using ANN to improve computational efficiency. All unselected pixels were classified as negative for ILD. Zhi-Hua et al. [37] have proposed Neural Ensemble-based Detection (NED) which utilised artificial neural network ensemble to identify lung cancer cells. This method provides high accuracy in identification of cancer cells. Hui Chen et al. [10] have provided a computerized scheme for formatting a lung nodule’s classification on a thin-section CT scan using a Neural Network Ensemble (NNE). Aggarwal, Furquan and Kalra [1] have proposed a model that classifies normal lung anatomy structure. Optimal thresholding is applied for segmentation. Features are extracted using geometrical, statistical and gray level characteristics. LDA is applied for classification. The results show 84% accuracy, 97.14% sensitivity and 53.33% specificity. Roy, Sirohi, and Patle [26] have developed a system to detect lung cancer nodule using fuzzy inference system for classification. This method uses gray transformation for image contrast enhancement. The resulted image is segmented using active contour model. Features like area, mean, entropy, correlation, major axis length, minor axis length are extracted to train the classifier. Overall, accuracy of the system is 94.12%. The limitation of this method is, it does not classify the cancer as benign or malignant which is future scope of this proposed model. Hiram et al. [24] have classified lung nodules using wavelet feature descriptor and SVM. Here, wavelet transforms are computed with one and two levels of decomposition. From each wavelet sub-band 19 features are computed. SVM is applied to differentiate CT images with cancerous nodules and not containing nodules.
Bhuvaneswari and Brintha [7] have applied Gabor filter for extracting features. The results of Gabor filter are given to K-NN classifier which is optimized by GA (Genetic Algorithm). The limitation of K-NN classifier is overcome by G-KNN classifier. Sangamithraa, and Govindaraju [27] have segmented the lung using region of interest and analysed the area for nodule detection in order to examine the disease. For extracting features, statistic method called Gray Level Co-occurrence Matrix (GLCM) is applied. For classification, supervised neural network called the Back Propagation Network (BPN) is applied. For removing unwanted artefacts in CT images, Sangamithra et al. [27] have pre-processed using median and wiener filters. Fuzzy K-Means clustering method is applied for segmentation. After that, entropy, contrast, correlation, homogeneity and area are applied for extracting features from the Fuzzy K- Means segmented Image. For feature extraction, statistic method called GLCM is applied. Finally, classification is done by using the supervised neural network called the Back Propagation Network (BPN). Results shows whether the CT Image is a normal Image or cancerous with accuracy of about 90.7%. Suren Makaju et al. [20] have segmented the input image using watershed segmentation. The segmented results show the image with cancer nodules marked. After that features are extracted using area, perimeter, eccentricity, centroid, diameter and pixel mean intensity for the segmented cancer nodules. Finally, classification of cancer nodule has been performed using Support Vector Machine (SVM). Jin, Zhang and Jin [17] have used Convolution Neural Network (CNN) as classifier to detect the lung cancer. The results reported an accuracy of 84.6%, sensitivity of 82.5%, and specificity of 86.7%. Wafaa Alakwaa et al. [3] have applied thresholding for segmentation approach. 3D CNN was used to classify the CT scan as positive or negative for lung cancer. This result in an accuracy of 86.6%. Ignatious and Joseph [16] have applied Gabor filter to enhance the image quality. For segmentation, watershed segmentation is used. The results show an accuracy of 90.1% which is higher than neural fuzzy model and region growing method. Wenqing et al. [30] have used three deep learning algorithms such as CNN, Deep Belief Networks (DBNs) and Stacked Denoising Autoencoder (SDAE) for lung cancer classification. Qing Zeng et al. [29] have applied Deep Learning for Classification of Lung Nodules on CT Images.
2.1 Observation
Even though existing methods provide good classification accuracy, the existing system accuracy is still less. Mostly LIDC public data set alone has been used. Mostly machine learning algorithms are applied for classification. Still, more comparison has to be performed with a real-time data set to choose suitable Deep learning techniques for classification. In this work, accuracy is improved by choosing well-known feature extraction methods and applying deep learning. There is not much work for severity finding.
3 System methodology
The overall architecture for the lung disease classification has been shown in Fig. 2. In offline process, lung tissue images are trained. In online process, the input lung tissue image is denoised by using the adaptive bilateral filter and the image contrast is enhanced by using the histogram equalization. After pre-processed the input image the next step is to lung region extraction. To extract the lung region the artificial bee colony segmentation approach is applied. The holes in the lung region are filled by using mathematical morphology technique in the output of the ABC segmented image. After that the texture features are used to find the cancerous lung nodules. After finding the location of the cancerous lung nodules the next process is to classify the lung disease name and its severity based on the feature extraction. Among several feature extraction methods this work uses six feature extraction techniques such as the bag of visual-words based on the histogram of oriented gradients, the wavelet transform-based features, the local binary pattern, SIFT, Zernike Moment. After extracting the features the Fuzzy Particle Swarm Optimization (FPSO) algorithm is used for select the best feature. Finally these features are classified using Deep learning techniques.

Overall architecture of the proposed work
3.1 Pre-processing
Firstly, for pre-processing, the contrast of input CT scan images is enhanced by using the Histogram Equalization (HE) technique. The HE is applied for adjusting image intensities to enhance contrast as shown in Eq. (1). Let I be a given CT scan image represented as a Ix by Iy matrix of integer pixel intensities ranging from 0 to 256. Let N denote the normalized histogram bin of image I for available intensity.
Where n = 0, 1… 255.
It locally recovers the contrast of images by dividing the image into numerous sub regions and by transforming the intensity values of each sub region independently to fulfil with a specified target histogram [5]. The enhanced images are shown in Fig. 3.

a Represents the input lung tissue image, b Represents the enhanced image using histogram equalization
Next, for pre-processing, Adaptive Bilateral Filter (ABF) is used on an enhanced CT scan images for de-noising. ABF is an expansion of the traditional bilateral filter [34]. ABF contains some important alterations than bilateral. Range filters used in ABF locally adaptive. By adding a counterbalance to the range filter, the range filter on the histogram is shifted as shown in Eq. (2).
Where x0 defines the row index of the current pixel is, y0 defines the column index of the current pixel of the image. x defines the row index of a neighbouring pixel. y defines the column index of a neighbouring pixel. N is a neighbouring window size. \( {\varOmega}_{x_{0,}{y}_0} \) is the centre pixel of a neighbouring window.
If ∇r and δ is fixed, the ABF will degenerate into a conventional bilateral filter. For ABF, a fixed low-pas Gaussian filter is adopted. The combination of locally adaptive and bilateral filter makes ABF into a much more powerful filter that is capable of both smoothing and sharpening. Moreover, ABF sharpens an image by increasing the slope of the edges. The δ is estimated in ABF using Eq. (3).
Where x0 defines the row index of the current pixel is, y0 defines the column index of the current pixel of the image.
The window size of input image is represented as (2 W + 1) × (2 W + 1). Here each pixel is represented as \( {\beta}_{x_{0,}{y}_0} \) with centre [x0,y0]. Let MAXIMUM and MINIMUM depicts the operations of taking the value of the data in respectively. The effect of ABF with a fixed domain Gaussian filter and a range filter is effective. Here ∇d = 1 is fixed and ∇r value changes as shown in Fig. 4.

Impact of ∇rand ∇d. 4. a ∇d = 1,4. b ∇r = 1, 4. c ∇r = 5, 4. d ∇r = 10, 4. e ∇r = 25, 4 . f ∇r = 50
Usually, some noises are surrounded on CT Images at the time of image acquisition process which aids in false detection of nodules. Sometimes noise may be detected as cancer nodules. Therefore, the extra noises have to be removed for accurate detection of cancer. This ABF sharpens CT scan image by increasing the slope of the edges without producing overrun. It is able to smooth the noise, while enhancing edges and textures in the image.
Compared to the conventional filters such as mean and median, ABF provides good results as shown in Fig. 5. The problems in conventional filters such as overshoot undershoot around edges, which causes objectionable ringing or halo artefacts are overcome by ABF. ABF increases the slope of edges in the image without producing overshoot and undershoot which renders clean, crisp, and artefact-free edges, and also improves the overall appearance. Bilateral filter fails in restoring the sharpness of a degraded image. ABF provides good results in both sharpness enhancement and noise removal as shown in Fig. 5.

a Input image, b Mean filter, c Median filter, d Bilateral filter and e ABF
3.2 Segmentation
In pre-processed image, segmentation process locates objects or boundaries which help in acquiring the region of interest in the image. It partitions the image into regions to identify the meaningful information. In lung cancer classification it is important to segment the cancer nodule from the pre-processed CT scan image. The pre-processed image is first segmented using Artificial Bee Colony (ABC) segmentation algorithm as shown in Fig. 6.

a Respresents the pre-processed image, b Ground Truth, c Represents the segmentation using kmeans, d Represents the segmentation using FCM, e Represents the segmentation using ant colony, f Represents the segmentation using ABC
For segmenting the lung cancer nodules, several techniques such as K-Means, FCM and Ant Colony algorithms are applied. FCM algorithm has long computational time. It is sensitive to speed, local minima and noise. K-means algorithm has difficulty in predicting the number of clusters [8]. In Ant Colony Approach, the probability distribution changes by iteration and it is independent on the earlier decision to find the best solution. It takes lot of time to convergence uncertain. These drawbacks are overcome by ABC. ABC is Simple, flexible and robust. Its implementation is easy. It has fewer control parameters to explore local solutions and to handle objective cost.
The two important functions in ABC segmentation are.
Where PVi is the probability value associated with ith food source that calculated by the Eq. (4). An onlooker bee selects a food source relying on PVi. In this equation, FVi represents ith food source’s nectar amounts, which is measured by employed bees and SN is the number of food source which is equal to the number of employed bees. Fitness is calculated by Eq. (6).
Where Cij is the cost function of the quality of source which is calculated from the Eq. (5) and abs is the absolute value of Cij. Greedy selection is applied to select the best source. In the real-world problems, Iijand Ikjrepresent the different old food source positions. The difference between these two positions is the distance from one food source to the other one. ∅ij is a random number between [−1, 1] and controls the distance of a neighbour food source position around Iij.
3.3 Feature extraction
In this step, the features are extracted from the segmented lung image. Here, four types of ROI features are used for extracting features. They are volumetric features, texture features, intensity features and geometric features. For extracting texture features, LBP and wavelet techniques are used. This paper extracts 96 LBP features, 26 wavelet features, 18 HOG features, 1 Eccentricity feature, 1 Curvature feature, 18 SIFT Features and 20 Zernike moment features. Finally, 180 features are extracted. Four feature categories are explained in more details in the following sections.
3.3.1 Texture features
Wavelet features
Wavelets are important and commonly used feature descriptors for texture feature extraction. Wavelet features show their effectiveness in capturing localized spatial frequency information and multiresolution characteristics. The wavelet signal passes successively through pairs of low pass and high pass filters, the analysis filters, which produce the transform coefficients. Here in this image, a H level decomposition is performed resulting in 3H + 1 different frequency bands. The frequency sub-bands LH is used to constitute the vertical details of the image, HL is used to constitute the horizontal details of the image, HH is used to constitute the diagonal details of the image. The LL sub-band is combined with discrete wavelet transform to obtain more level of decomposition as shown in Fig. 7.

Wavelet feature sub-band
It generates another four sub-bands. Sub-band LL represent the approximate element of image, LH represent the vertical element of image, HL represent the horizontal element of image and HH represent the diagonal element of image. Thus the information of image is stored in decomposed form in these sub-bands. Here, the ROIs are decomposed to four levels by using 2-D symlets wavelet because the symlets wavelet has better symmetry than other wavelets. The horizontal, vertical, and diagonal detail coefficients are extracted from the wavelet decomposition structure. Finally, the wavelet features by calculating the mean and variance of these wavelet coefficients. Some texture features combined with this wavelet function is shown in Table 1.
LBP features
The LBP feature is a compact texture descriptor in which each comparison result between a centre pixel and one of its surrounding neighbors is encoded as a bit. The LBP operator is a unified approach to statistical and structural texture analysis. Their values are compared with the value of the centre pixel. For each neighbouring pixel, the result will be set to one if its value is no less than the value of the centre pixel, otherwise the result will be set to zero. The LBP code of the centre pixel is obtained by multiplying the results with weights given by powers of two.
3.3.2 Intensity features
Intensity feature is frequently used as the most important source of image information in CT images. Intensity features and their equation descriptors are described in more details in Table 2. The HOG feature is also considered in intensity feature extraction.
HOG features
The HOG feature is a texture feature descriptor describing the distribution of image gradients in different orientations. In the HOG features, histogram of gradient directions and edge orientations are accumulated over the pixels of the cell. After that the gradient values are computed. The centred and point discrete derivative mask is applied in both horizontal and vertical directions. The filter kernels [−1, 0, 1] and [−1, 0, 1]T are applied.
After applying kernels, each pixel is estimated with a weighted vote for an edge orientation histogram channel and the votes are accumulated into orientation bins over local spatial regions. Here, ROI is divided into smaller rectangular blocks of 8 × 8 pixels and further divide each block into four cells of 4 × 4 pixels. An orientation histogram which contains nine bins covering a gradient orientation range of 0–180° is computed for each cell. Here, a block is represented by linking of the orientation histograms of cells in it. This means a 36 Dimension HOG feature vector is extracted for each block in the segmented lung image.
3.3.3 Volumetric features
Zernike moment features
The Zernike moments are the descriptors of mass shapes in extracting features. Here, the input pre-processed image is subjected to histogram equalization at first, which shows the mass margins of images more visible. Zernike moments are dependent on the translation and scaling of masses in ROIs. In other words, the Zernike moments of two similar images that are not equally scaled and translated are different. Two processes have been employed to resolve the dependency problems in Zernike moments. The centroid of each image mass is translated into the centre of corresponding ROI. This process eliminates the dependency of Zernike moments to object translation.
SIFT features
SIFT is called a volumetric feature because it calculates the edges of an image using keypoints. SIFT features are applied because they are invariant to small illumination changes, scale changes, image rotation, and viewpoint changes. The SIFT algorithm have four main steps: (1) Scale-Space Peak Selection (SSPK), (2) Keypoint Localization, (3) Orientation Assignment, (4) Keypoint Descriptor Computation, and (5) Keypoint Matching. In the first phase, SSPK has been used by constructing a Gaussian Pyramid (GP). GP is calculated by searching the extreme local peaks in a series of Difference-of-Gaussian (DoG) images. DoG is estimated as the difference of Gaussian blurring of an image with two different values.
3.3.4 Geometric features
Eccentricity
Eccentricity is defined in the equation below,
where x and y are semi-major axis and semi-minor axis lengths of nodule region of interest, respectively.
Curvature descriptor
Curvature descriptor is estimated with respect to intensity inside nodule region of interest, which depends on the intensity variation.
Where α1 and α2 (α1 ≤ α2) are two Eigen values of Hessian matrix.
3.4 Feature selection
In order to achieve good classification results, generally several types of features are applied at the same time. Since the different types of features may contain complementary information, it could bring better classification performance through selecting discriminative features from various feature spaces. The advantage of feature selection is to determine the importance of original feature set [35, 36]. For feature selection, Fuzzy Particle Swam Optimization (FPSO) is applied. A FPSO [32] is composed of a knowledge base, that includes the information given by the expert in the form of linguistic control fuzzy rules, a fuzzification interface, which has the effect of transforming crisp data into fuzzy sets, an inference system, that uses them together with the knowledge base to make inference by means of a reasoning method, and a defuzzification interface, that translates the fuzzy control action thus obtained to a real control action using a defuzzification method. FPSO is based on the following equation,
where, m > 1 is a real number, Wi is the cluster centre of i, yk is the vector part of k.
Where c = 1, 2, ...n, ‖yk − Wi‖2 represents the Euclidean distance between yk and Wi, and [τik](t + 1) is the membership degree of part k in group i.
For feature selection process several existing algorithms such as PSO, DE, GA are available. GA does not guarantee an optimal solution. This problem is solved by using PSO. Both GA and DE have high computational cost. But PSO is computationally less expensive. In PSO, the best particle in each neighbourhood exerts its influence over other particles in neighbourhood. To overcome these problems, several particles in each neighbourhood can be allowed to influence others to a degree by a fuzzy variable. The selected features using DE,GA, PSO and FPSO using various test rounds are shown in Table 3.
3.5 Classification
3.5.1 Bag classifier
The Bag classifier is mainly used in natural language processing and information retrieval (IR). Recently, this classifier has also been used for computer vision. In computer vision application, it is applied to image classification regarding image feature data sets. In this classifier, each image is treated as a document, and it is characteristically symbolized by a histogram generated from the training images. Here, the classes of the images are selected and labelled in advance. Here, classifier makes a decision that which class name from given training classes to be the class name of a test image.
3.5.2 Naive Bayes classifier
Naive Bayes classifier depends on a probability model and allocates the specific class, which has the maximum estimated posterior probability to the feature vector. The posterior probability P(Cv/FV) of a specific class Cv is given by a feature vector FV is determined using Bayes’ theorem is given in equation below,
Naive Bayes Classifier [6] technique is based on the Bayesian theorem and is particularly suited when the dimensionality of the inputs is high. Despite its simplicity, Naive Bayes can often outperform more sophisticated classification methods.
3.5.3 K-NN classifier
The k-Nearest Neighbors algorithm is a non-parametric method [5] used for classification and regression. The input consists of the k closest training examples in the feature space. In k-NN classification, the output is a class membership. An object is classified by a majority vote of its neighbors, with the object being assigned to the class most common among its k-nearest neighbors. If k = 1, the object is simply assigned to the class of that single nearest neighbour.
3.5.4 Adaboost classifier
Adaboost classifier is trained on more training examples. It provides a good fit to training examples by producing low training error. It is very simple. Adaboost improves the classification results by combining weak predictors together [6].
Adaboost algorithm maintains a set of weight over the training images. Let us consider the training set of images be (t1, x1 ), (t2, x2), …(tn, xn) where ti belongs to some domain space of T. After that each label of xi is in the label set of X = {−1, +1} is shown in equation below,
The weight on the training example i on round r is depicted as Wk(i). The weights are initialized using the next equation below,
Where k = 1...K, which represents the series of rounds. The images are trained along with their assigned weights.
3.5.5 SVM classifier
SVM [5] is a binary classification method that takes as input labelled data from two classes and outputs a model file for classifying new unlabelled/labelled data into one of two classes. It group items that have similar feature maps into groups. SVM constructs a hyperplane that maximizes the margin between negative and positive samples. Finally, classification is performed by the decision based on the value of the linear combination of the features.
SVM is trained by feeding known data with previously known decision values, by forming a finite training set. It is from the training set that an SVM gets its intelligence to classify unknown data. In SVM, for two class classification problem, input data is mapped into higher dimensional space using RBF kernel [5]. Here, a hyper plane linear classifier is applied in this transformed space utilizing those patterns vectors that are closest to the decision boundary.
The estimation for the classification using SVM with N support vectors g1, g2,…gn and weights τ1, τ2, …τn is given by:
Where x represents a feature vector and b represents a bias.
3.5.6 ELM classifier
The existing classifiers encounter several problems while training such as local minima, not proper learning rate and over fitting, differentiable activation functions etc. To overcome these problems, ELM has enhanced generalization result. ELM will provide the results directly without such difficulties. ELM classifier can also be used to train SLFNs with many non-differentiable activation functions.
ELM are feed forward neural networks for classification, regression, clustering, sparse approximation, compression and feature learning with a single layer or multiple layers of hidden nodes, where the parameters of hidden nodes need not be tuned. In most cases, the output weights of hidden nodes are usually learned in a single step, which essentially amounts to learning a linear model as shown in Fig. 8.

ELM Architecture
ELM contains a Single Hidden Layer Feed-Forward Neural Networks (SLFNs) which will randomly select the input weights and analytically establish the output weights of SLFNs. This algorithm provides the best generalization performance at extremely fast learning speed. Usually, ELM contains an input layer, hidden layer and an output layer. The training process of ELM can be carried out in seconds or less than seconds for many applications. For all the existing classifiers, the training performed by feed forward network will take a huge chunk of time even for straightforward applications. ELM classifier can be represented as following below
where W2 is the weight matrix between the hidden layer and the output layer, W1 is the weight matrix between the input and the hidden layer, σ is the activation function. q(x) = [q1(x)q2(x)…qn(x)] is the vector obtained from the hidden layer output for x, where n is the number of neurons in the hidden layer. q(x) maps the input ‘x’ onto ELM feature space. Wmn gives the weight between the input and the hidden layer. β provides the weight between the hidden and the output layer. Gaussian radial basis activation function is used in ELM. It helps to distinguish diagonal elements of the matrix.
3.5.7 Fuzzy particle swarm optimization convolution neural network (FPSOCNN)
Convolutional Neural Networks are very similar to ordinary Neural Networks. They are made up of neurons that have learnable weights and biases. Each neuron receives some inputs, performs a dot product and optionally follows it with a non-linearity. A CNN consists of one or more convolutional layers and pooling layers. Pooling layers are also called sub sampling layers. Normally CNN are used for classification purpose. Here, CNN is used to classify the lung cancer disease. The pooling layer is used to perform down sampling. It is used to reduce the amount of computation time by reducing the extracted features in convolution layer as shown in Fig. 9.

Lung Cancer Detection using CNN
There are two kinds of pooling layers, max pooling and average pooling. In max pooling, the value of the largest pixel is considered in the receptive field of the filter. In average pooling, the average of all the values is considered in the receptive field. The output of the pooling layer is given as input to the next convolution layer. CNN has very high computational cost for large feature maps. CNN [33] is slow to train large feature maps. To overcome the drawback of CNN, Fuzzy Particle Swarm Optimization Convolution Neural Network (FPSOCNN) is proposed. This reduces high computation cost and improves speed. The dimension reduction of image space is realized by vector of features that is created by FPSO from multidimensional image space to low dimensional feature space. This approach radically reduces the number of features for lung cancer disease classification. Instead of using max and average pooling concept in CNN, PSO and GA are applied. FPSOCNN method is compared with CNN, PSOCNN and GACNN. Figure 10 shows the architecture of FPSOCNN.

Lung Cancer Detection using Proposed FPSOCNN
3.5.8 Severity finding
From the lung cancer segmented image, five severity finding parameters such as Area, Longest Diameter, Shortest Diameter, Perimeter and Elongation are depicted in Table 4. After extracting the severity parameter values, it is compared with range values of the Benign and Malignant stages to find out the severity of the input lung cancer image. The range values of these four stages are shown in Table 5. The severity results of the Lung cancer dataset are shown in Table. 6.
4 Results and discussions
4.1 Data set used
4.1.1 Real-time data set
Lung cancer images are collected from Aarthi Scan Hospital, Tirunelveli, Tamilnadu, India. Aarthi Scan Hospital dataset contains nearly 1000 lung images. The original dataset has taken from patients in Digital Imaging Communication Medicine (DICOM) images. The resolution of every image is 256 × 256. Here the training and testing process are performed as shown in Table 7. TrTeD1 contains high number of malignant images from the total training and testing images. TrTeD9 contains high number of benign images from the total training and testing images.
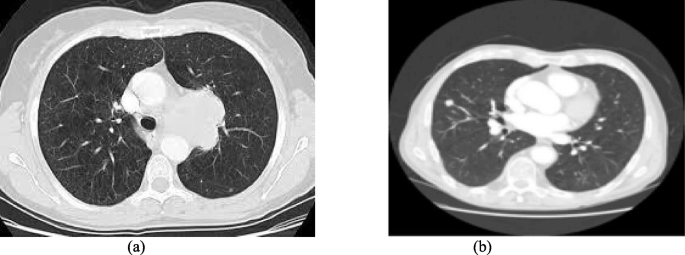
Figure 11a shows the benign pulmonary nodule with the rank of malignancy ‘1’. Figure 11b shows the benign pulmonary nodules with the rank of malignancy ‘2’. Figure 11c shows the malignant pulmonary nodules with the rank of malignancy ‘4’. Figure 11d shows the malignant pulmonary nodules with the rank of malignancy ‘5’.

Shows the examples of benign and malignant pulmonary nodules from the real-time data set.
4.1.2 B LIDC data set
LIDC dataset of thoracic CT scans is considered to evaluate the performance of the ELM and various classifiers for the classification of benign and malignant pulmonary nodules. LIDC [19] data set is the largest library of thoracic CT scans publicly available, which contains 1018 CT thoracic scans. Here, pulmonary nodule appears in several slices of a CT scan. The semantic rating is used for testing and training the classifier ranges from 1 to 5 by four experienced thoracic radiologists, which indicates an increasing degree of the manifestation of nodule characteristics. The ground truth data for LIDC dataset are collected the website (https://wiki.cancerimagingarchive.net/display/Public/LIDC-IDRI).
In this paper, all training images are classified into malignant and benign nodules. A malignancy nodule will have scored lower than 3 are called as a benign nodule and a malignancy nodule will have scored higher than 3 are called as a malignant nodule. The pulmonary nodules with a score of 3 in malignancy are removed to avoid the ambiguousness of nodule samples. In this paper, 1000 nodules are randomly selected per class to train ELM classifier as shown in Table 7. Figure 12 shows examples of benign and malignant pulmonary nodules with different ranks of malignancy from the LIDC dataset. Figure 12a depicts the benign pulmonary nodules with the rank of malignancy ‘1’. Figure 12b depicts the benign pulmonary nodules with the rank of malignancy ‘2’. Figure 12c depicts the benign pulmonary nodules with the rank of malignancy ‘4’. Figure 12d depicts the benign pulmonary nodules with the rank of malignancy ‘5’.

Examples of rated benign and malignant pulmonary nodules from the LIDC radiologist’s marks
4.1.3 C parameter setting
In our experiments, two dimension sizes were chosen in FPSO: d = 10 and d = 30. The number of iterations was set to 1000 and 2000 corresponding to the dimensions 10 and 30 in FPSO. The number of particles was equal to 30 and the number of trials was equal to 30 in all experiments in FPSO. The parameters used for ABC segmentation approach is shown in Table 8 and parameters used for ELM Training and Testing process is shown in Table 9.
4.1.4 D performance metrics used
4.1.5 D a overlap measure (OM)
Where SeA and SeM represents the segmentation results. |SeA| and |SeM| represents the numbers of pixels in SeA and SeM. |SeA ∩ SeM| represents the number of pixels in both SeA and SeM. |SeA ∩ SeM| represents the number of pixels in either SeA and SeM.
4.1.6 D b sensitivity (Sn)
Sensitivity (Sn) is defined as the fraction of malignant nodules predicted perfectly as shown in Eq. (18).
4.1.7 D c specificity (Sp)
Specificity (Sp) is defined as the fraction of benign nodules predicted perfectly as shown in Eq. (19).
4.1.8 D d classification accuracy (CA)
Where TrP represents the number of malignant nodules perfectly predicted. FaN represents the number of malignant nodules imperfectly predicted. Trn represents the number of benign nodules perfectly predicted. Fap represents the number of benign nodules imperfectly predicted.
4.1.9 Error rate (ER)
4.2 Experimental analysis
4.2.1 Experiment no 1: Analysis of segmentation approaches
In this experiment, the contribution of each segmentation approaches has been evaluated. The segmentation methods used in the work are K-Mean, FCM, Ant Colony and ABC. To evaluate the performance of this segmentation approach, the performance metric called overlap measure is used. Ideally, a good segmentation approach is expected to have a high overlap measure. Table 10 lists the overlap measures of segmentation approaches such as K-Mean, FCM, Ant Colony and ABC.
As observed from Table 10, the mean of the overlap measures obtained by the ABC segmentation method is 0.933, which is higher than that of the other existing segmentation methods. Next to ABC segmentation methods Ant colony provides efficient result with 0.931 for TrTeD1. For TrTeD7, ABC has obtained 0.95 which is more than other methods. For TrTeD16, ABC has obtained 9.959 which is 2% – 8% more than other methods. Next to ABC, Ant colony provides good results. K-means provides good results for TrTeD12 data set with 0.841 values and for TrTeD4 data set with 0.929 values. ABC has obtained 0.923 value for TrTeD5 data set while K-means, FCM and Ant colony provides less results.
4.2.2 Experiment no 2: Analysis of feature extraction approaches
In this experiment, the contributions of each feature extraction approaches which are used in this work are evaluated. To evaluate the performance of these feature extraction approaches, the performance metrics, namely, accuracy, sensitivity, specificity and error rate measures are used. Ideally, a good feature extraction approach is expected to have a high accuracy, high sensitivity, high specificity and low error rate. Table 11 depicts accuracy, sensitivity, specificity and error rate measures of various feature extraction approaches. For TrTeD1 to TrTeD16, the proposed method depicts good results in accuracy, sensitivity, specificity and error rate.
As observed from Table 11, accuracy of the proposed features is 97.47 for TrTeD1, which is higher than that of the individual feature extraction methods. As well as, in the proposed feature extraction approach, the error rate is 2.53 for TrTeD1 which is lower than that of the traditional individual feature extraction methods. For TrTeD16, Accuracy obtained is 97.213, Sensitivity is 97.853, Specificity is 97.513 and error rate is 2.787 which is very high compared to other methods.
The accuracy has been improved from (7–11) % compared to the other feature extraction methods. Accuracy, Sensitivity and specificity are more compared to the other existing methods. Next to the proposed, HOG provides good results in accuracy and Sensitivity. For specificity, Wavelet provides good result next to the proposed method.
4.2.3 Experiment no 3: Analysis of classifier approaches
In this experiment, the contributions of various classifiers which are used in this work are evaluated. To evaluate the performance of these classifiers, the performance metrics used are accuracy, sensitivity, specificity and error rate. Ideally, a good classifier is expected to have a high accuracy, high sensitivity, high specificity and low error rate. Table 12 lists the accuracy, sensitivity, specificity and error rate measures of various classifiers.
As observed from Table 12, accuracy, sensitivity, error rate and specificity for 16 data sets are provided. For TrTeD1, the proposed method got an accuracy of 99.23, for sensitivity the value obtained is 99.31, for specificity the result value is 99.43 and error rate is 0.77. For TrTeD16, the proposed method got an accuracy of 99.16, for sensitivity the value obtained is 99.31, for specificity the result value is 99.18 and error rate is 0.84.
4.2.4 Experiment no 4: Analysis of proposed method with existing works
In this experiment, the contribution of proposed method is evaluated with the existing works. To evaluate the performance of this proposed approach, the performance metrics used are accuracy, sensitivity, specificity and error rate. Ideally, a good proposed approach is expected to have a high accuracy, sensitivity, and specificity. Table 13 depicts the results with the state-of-the-art methods for LIDC data set. The proposed method shows 95.62% accuracy, 97.93% sensitivity and 96.32% specificity for LIDC data set.
As observed from Table 14, the average accuracy value of the proposed obtained is 94.97, which is higher than of the all existing works. As well as, average sensitivity of the proposed method obtained is 96.68, which is higher than of the all existing works. The specificity value of the proposed method obtained is 95.89 which are higher than of the all existing works. So, from the Table 14, it is concluded that the proposed method provides good results than other existing works.
4.2.5 Experiment no 5: Analysis of proposed method with confusion matrix
To verify the performance of the proposed classification method, the confusion matrix [6, 58, 59] is used as the metric. Here there are two classes: benign nodules and malignant nodules. Therefore, the confusion matrix with a size of 2 × 2 is used. Figure 13 depicts the confusion matrices on different numbers of testing samples.

Results of confusion matrices on different numbers of testing samples a Confusion matrix on 100 testing samples, b Confusion matrix on 200 testing samples, c Confusion matrix on 300 testing samples
4.2.6 Computational complexity
The computational complexity of CNN is calculated by using big o notation. The computational complexity of CNN is calculated using Eq. (22)
The computational complexity of PSOCNN is found by using Eq. (24)
The computational complexity of GACNN is found by using Eq. (26)
The computational complexity of FPSOCNN is found by using Eq. (28)
5 Conclusion
This work is to detect the cancerous lung nodules from the given input lung image and to classify the lung cancer and its severity. To detect the location of the cancerous lung nodules, this work uses novel Deep learning methods. Here, features are classified using Deep learning. A novel FPSOCNN is proposed which reduces computational complexity of CNN. This work uses best feature extraction techniques such as Histogram of oriented Gradients (HoG), wavelet transform-based features, Local Binary Pattern (LBP), Scale Invariant Feature Transform (SIFT) and Zernike Moment. After extracting texture, geometric, volumetric and intensity features, Fuzzy Particle Swarm Optimization (FPSO) algorithm is applied for selecting the best feature. An additional valuation is performed on another dataset coming from Arthi Scan Hospital which is a real-time data set. From the experimental results, it is shown that novel FPSOCNN performs better than other techniques.
In future, further improvement will be performed in the classification performance of pulmonary nodules and optimise the proposed model. In addition, the further work will be grading the images based on the degree of the malignancy of pulmonary nodules, which is of valuable significance for the diagnosis and treatment of lung cancer in clinical applications.
References
Aggarwal T, Furqan A, Kalra K (2015) Feature extraction and LDA based classification of lung nodules in chest CT scan images. IEEE, International Conference on Advances in Computing, Communications and Informatics (ICACCI), pp. 1189–1193
Akram S, Javed MY, Hussain A, Riaz F, Usman Akram M (2015) Intensity-based statistical features for classification of lungs CT scan nodules using artificial intelligence techniques. Journal of Experimental & Theoretical Artificial Intelligence 27(6):737–751. https://doi.org/10.1080/0952813X.2015.1020526
Alakwaa W, Nassef M, Badr A (2017) Lung Cancer detection and classification with 3D convolutional neural network (3D-CNN). International Journal of Advanced Computer Science and Applications (IJACSA) 8(8):409–417
Ani Brown Mary N, Dejey D (2018) ‘Classification of coral reef submarine images and videos using a novel Z with tilted Z local binary pattern (Z⊕TZLBP)’, springer. Wirel Pers Commun 98(3):2427–2459. https://doi.org/10.1007/s11277-017-4981-x
Ani Brown Mary N, Dharma D (2017) ‘Coral reef image classification employing improved LDP for feature extraction’, Elsevier. J Vis Commun Image Represent 49(C):225–242. https://doi.org/10.1016/j.jvcir.2017.09.008
Ani Brown Mary N, Dharma D (2018) A novel framework for real-time diseased coral reef image classification’, Springer. Multimed Tools Appl:1–39. https://doi.org/10.1007/s11042-018-6673-2
Bhuvaneswari BT (2015) Detection of Cancer in lung with K-NN classification using genetic algorithm’, Elsevier. Procedia Mater Sci 10:433–440
Brown A, Mary N, Dejey D (2018) ‘Classification of coral reef submarine images and videos using a novel Z with tilted Z local binary pattern (Z⊕TZLBP)’, springer. Wirel Pers Commun 98(3):2427–2459. https://doi.org/10.1007/s11277-017-4981-x
Chabat F, Yang G-Z, Hansell DM (2003) Obstructive lung diseases: texture classification for differentiation at CT1. Radiology 228(3):871–877
Chen H, Xu Y, Ma Y, Ma B (2010) Neural Network Ensemble-Based Computer-Aided Diagnosis for Differentiation of Lung Nodules on CT Images. Acad Radiol 17(5)
Da Silva GLF, da Silva Neto OP, Silva AC, de Paiva Marcelo Gattass AC (2017) “Lung nodules diagnosis based on evolutionary convolutional neural network”, springer. Multimed Tools Appl 76(18):19039–19055. https://doi.org/10.1007/s11042-017-4480-9
da Silva GLF, de Carvalho Filho AO, Silva AC, de Paiva AC, Gattass M (2016) Taxonomic indexes for differentiating malignancy of lung nodules on CT images. Research on Biomedical Engineering 32(3):263–272
de Carvalho Filho AO, Silva AC, de Paiva AC, Nunes RA, Gattass M (2016) Lung-nodule classification based on computed tomography using taxonomic diversity indexes and an SVM. Springer, Journal of Signal Processing Systems, DOI 87:179–196. https://doi.org/10.1007/s11265-016-1134-5
de Sousa Costa RW, da Silva GLF, de Carvalho Filho AO, Silva AC, de Paiva Marcelo Gattass AC (2018) “Classification of malignant and benign lung nodules using taxonomic diversity index and phylogenetic distance”, springer. Med Biol Eng Comput 56(11):2125–2136
Dhaware BU, Pise AC, (2016) Lung Cancer Detection Using Bayasein Classifier and FCM Segmentation. IEEE, International Conference on Automatic Control and Dynamic Optimization Techniques (ICACDOT), pp. 170–174
Ignatious S, Joseph R (2015) Computer Aided Lung Cancer Detection System. IEEE, Proceedings of 2015 Global Conference on Communication Technologies (GCCT 2015), pp. 555–558.
Jin X-Y, Zhang Y-C, Jin Q-L (2016) Pulmonary nodule detection based on CT images using Convolution neural network. IEEE, 9th International Symposium on Computational Intelligence and Design, pp. 202–204.
Kumar D, Wong A, Clausi DA (2015) “Lung nodule classification using deep features in CT images”, IEEE, 12th conference on computer robot vision, pp 133-138. DOI. https://doi.org/10.1109/CRV.2015.25
Li X-X, Li B, Tian L-F, Zhang L (2018) Automatic benign and malignant classification of pulmonary nodules in thoracic computed tomography based on RF algorithm. IET Image Process. https://doi.org/10.1049/iet-ipr.2016.1014
Makaju S, Prasad AA, Elchouemi S (2018) Lung Cancer detection using CT scan images. Elsevier, Procedia Computer Science 125:107–114
Nie L, Wang M, Zhang L, Yan S, Zhang B, Chua T-S (2015) Disease inference from health-related questions via sparse deep learning. IEEE Trans Knowl Data Eng 27(8):2107–2119
Nie L, Zhang L, Yang Y, Wang M, Hong R, Chua T-S (2015) Beyond doctors: future health prediction from multimedia and multimodal observations. proceedings of the 23rd ACM international conference on multimedia.
Orozco HM, Villegas OOV, Maynez LO, Sanchez VGC, de Jesus Ochoa Dominguez H (2012) Lung Nodule CLASSIFICATION in Frequency Domain Using Support Vector Machine. IEEE, In international conference on information science, signal processing and their application.
Orozco HM, Villegas OOV, Sánchez VGC, de Jesús Ochoa Domínguez H, de Jesús Nandayapa Alfaro M (2015) Automated system for lung nodules classification based on wavelet feature descriptor and support vector machine. Biomed Eng 14(9):1–20. https://doi.org/10.1186/s12938-015-0003-y
Park SC, Tan J, Wang X, Lederman D, Leader JK, Kim SH, Zheng B (2011) Computer-aided detection of early interstitial lung diseases using low-dose CT images’, Iop Publishing. Phys Med Biol 56:1139–1153. https://doi.org/10.1088/0031-9155/56/4/016
Roy TS, Sirohi N, Patle A (2015) Classification of Lung Image and Nodule Detection Using Fuzzy Inference System. IEEE, International Conference on Computing, Communication and Automation (ICCCA2015), pp. 1204–1207
Sangamithraa, Govindaraju (2016) Lung tumour detection and classification using EK-mean clustering. IEEE WiSPNET
Shao H, Cao L, Liu Y (2012) A detection approach for solitary pulmonary nodules based on CT images. IEEE, 2nd international conference on computer science and network technology.
Song QZ, Zhao L, Luo XK, Dou XC (2017) Using deep learning for classification of lung nodules on computed tomography images. Journal of healthcare engineering. https://doi.org/10.1155/2017/8314740
Sun W, Zheng B, Qian W (2016) "computer aided lung cancer diagnosis with deep learning algorithms" International Society for Optics and Photonics, medical imaging : computer-aided diagnosis. Vol. 9785
Suzuki K, Li F, Sone S, Doi K (2005) Computer-aided diagnostic scheme for distinction between benign and malignant nodules in thoracic low-dose CT by use of massive training artificial neural network. IEEE Trans Med Imaging 24(9):1138–1150
Dong-ping Tian and Nai-qian Li, 2009, ‘Fuzzy Particle Swarm Optimization Algorithm’, IEEE, International Joint Conference on Artificial Intelligence, pp. 263–267.
Van Ginneken B, Setio AAA, Jacobs C, Ciompi F (2015) Off-the-shelf convolutional neural network features for pulmonary nodule detection in computed tomography scans. IEEE 12th International Symposium on Biomedical Imaging (ISBI). doi:10.1109/isbi.2015.7163869
Zhang B, Allebach JP (2008) Adaptive Bilateral Filter for Sharpness Enhancement and Noise Removal. IEEE Trans Image Process 17(5)
Zhang L, Zhang Q, Du Member B, Huang X, Tang YY, Tao D (2016) Simultaneous spectral-spatial feature selection and extraction for Hyperspectral images. IEEE Transactions on Cybernetics
Zhang L, Zhang Q, Zhang L, Tao D, Huang X, Bo D (2014) Ensemble manifold regularized sparse low-rank approximation for multiview feature embedding”, Elsevier. Pattern Recogn. https://doi.org/10.1016/j.patcog.2014.12.016
Zhou Z-H, Jiang Y, Yang Y-B, Chen S-F (2002) Lung cancer cell identification based on artificial neural network ensembles’, Elsevier. Artif Intell Med 24:25–36
Zhu Y, Tan Y, Hua Y, Wang M, Zhang G, Zhang J (2010) Feature selection and performance evaluation of support vector machine (SVM)-based classifier for differentiating benign and malignant pulmonary nodules by computed tomography. J Digit Imaging 23(1):51–65
Author information
Authors and Affiliations
Corresponding author
Additional information
Publisher’s note
Springer Nature remains neutral with regard to jurisdictional claims in published maps and institutional affiliations.
Rights and permissions
About this article

Cite this article
Asuntha, A., Srinivasan, A. Deep learning for lung Cancer detection and classification. Multimed Tools Appl 79, 7731–7762 (2020). https://doi.org/10.1007/s11042-019-08394-3
Received:
Revised:
Accepted:
Published:
Issue Date:
DOI: https://doi.org/10.1007/s11042-019-08394-3