
Abstract
Temperature-programmed desorption mass spectrometry has been used to study vacuum thermolysis of high-density polyethylene (HDPE) and its composites with hydrophilic or hydrophobic nanosilica in the presence or absence of butylated hydroxytoluene (BHT). It has been found that both surface chemistry of silica filler and the presence of immobilized BHT affect the pathway of HDPE thermal decomposition. Volatility of BHT antioxidant was shown to decrease in the following sequence: free BHT > HDPE–BHT > HDPE–hydrophobic silica/BHT > HDPE–hydrophilic silica/BHT, and the capability of the additives to inhibit chain scission reaction during thermal decomposition of HDPE in vacuum was as follows: hydrophobic silica/BHT > BHT > hydrophobic silica > hydrophilic silica/BHT > hydrophilic silica ≈ no additives.
Introduction
High-density polyethylene (HDPE) is widely used as a material for food packaging [1] and for pipes in water supply systems [2]. In order to prevent or suppress possible oxidation of HDPE in air and therefore to improve its durability, antioxidants are introduced into polymer. The commonly used antioxidant is 2,6-di-tert-butyl-4-methylphenol known as butylated hydroxytoluene (BHT) [3]. However, being highly mobile, such kind of low-molecular antioxidants is easily released from the polymer matrix due to migration, evaporation, and extraction [4, 5]. Physical loss of the antioxidants is the main challenge with respect to environmental protection, safety measures, and durability of polymeric materials.
There are several ways in which efforts were made to solve the above-mentioned problem. The first one is directed to prevent physical loss of the active substance by the synthesis of polymeric antioxidants—for instance, via copolymerization or homopolymerization of monomer antioxidants [6], including those having 2,6-di-tert-butylphenol functional groups [7]. The second way is polymer filling with inorganic nanoparticles—alone or with immobilized antioxidants. This approach allows one to regulate the mobility of the antioxidant by varying the filler surface chemistry. Besides, filling the polymer with just inorganic nanoparticles may improve its physicochemical, in particular, mechanical and thermal characteristics. This effect was achieved using, for instance, silica nanoparticles [8, 9].
Previously, we have shown [10] that filling with hydrophilic or hydrophobic silica (1 mass %) as well as introduction of BHT antioxidant (0.1 mass %) into polyethylene increases its thermo-oxidative stability, but it turned out that BHT immobilized on silica surface is inactive, and only upon its gradual release into polymer matrix, an increase in HDPE thermal stability against oxidation takes place. The aim of the present work was to investigate how the presence of silica nanofiller and its surface chemistry will affect the mobility of the antioxidant in the polymer matrix and vacuum thermal decomposition of the latter.
Experimental
Fumed silica with a specific surface area of 200 m2 g−1 (Kalush, Ukraine) was used as the hydrophilic nanofiller (A200). Hydrophobic nanofiller (AMT) was obtained via gas-phase treatment of A200 silica surface with trimethylchlorosilane (Kremnypolymer, Ukraine) in an autoclave at 300 °C (the reaction scheme is ≡ Si–OH + ClSi(CH3)3 → ≡Si–O–Si(CH3)3 + HCl). Complete trimethylsilylation of silica surface was confirmed by means of IR spectroscopy. BHT (Fluka) was immobilized onto the surface of hydrophilic or hydrophobic silica via the impregnation technique. In brief, BHT was dissolved in ethanol solution, and the appropriate amount of silica powder was added into the mixture. After mixing for 0.5 h, the samples were dried at 60 °C to remove the solvent. Then, silica particles were embedded into HDPE matrix (TVK, Hungary) by means of forge-rolling at 160 °C. The final HDPE–silica and HDPE–silica/BHT nanocomposites contained 1 mass % of the filler and 0.1 mass % of the antioxidant.
The samples obtained were studied by means of temperature-programmed desorption mass spectrometry (MX 7304A mass spectrometer, Selmi, Ukraine) in an interval of temperatures 20–800 °C at heating rate of 10 °C min−1, m/z range 1–190 Da. Analysis of volatile products formed during the heating of samples under vacuum was performed according to the following procedure [11]. The samples (~1 mg each) were placed in a quartz–molybdenum tube and evacuated until the pressure reached ~10−1 Pa. Then, the tube was attached to the inlet system of a mass spectrometer, and the linear heating was applied. For the characteristic components of the mass spectra for the main volatile products of the samples' thermolysis, the appropriate curves were drawn. In order to derive kinetic parameters of HDPE thermal decomposition, mathematical treatment of some curves was performed. The models of non-isothermal kinetics used and the principles of mass spectrometric curves treatment applied were described in detail elsewhere [11].
Results and discussion
Mass spectra (electron ionization) of volatile products of HDPE thermolysis at various temperatures are shown in Fig. 1. The most abundant ions observed are m/z 18 (H2O+), 28 (N +2 , CO+, and/or C2H +4 ), 29 (C2H +5 and/or CHO+), 41–44 (C3 hydrocarbon fragments), 44 (CO +2 ), and 55–58 (C4 hydrocarbon fragments).

Mass spectra of volatile products of HDPE thermolysis at 37 °C, 447 °C, 635 °C, and 780 °C (a–d, respectively)
The curves for some characteristic ions are given in Fig. 2a, b. The process of HDPE thermolysis can be tentatively divided into three phases. The first phase (T ~ 50–230 °C) is characterized by elimination of physical water (T max at about 95 °C, Fig. 2b, m/z 18). The second phase (T ~ 230–550 °C) indicates the start and the main stage of HDPE degradation with elimination of water (m/z 18, T max ~415 °C), volatile hydrocarbons (fragment ions with m/z 28, 29, 41, and 44) as well as probably oxygen-containing hydrocarbons (m/z 29) and carbon dioxide (m/z 44) (T max ~ 440 °C). The third phase (T > 550 °C) proceeds with damping elimination of unsaturated volatile hydrocarbons (m/z 41), rising elimination of saturated hydrocarbons (m/z 28, 29, 44), volatile oxygen-containing hydrocarbons (m/z 29), and/or carbon monoxide (m/z 28), as well as with water evolving (m/z 18, T max ~690 °C).

Curves of the main volatile products of HDPE thermolysis: a ions with m/z 28, 29, and 41; b ions with m/z 18, 41, and 44; c split of the curve for m/z 41 ion (points experiment, thick line the sum of the model (thin) lines)
In order to derive the kinetic parameters and to distinguish individual stages of HDPE thermal decomposition, we performed mathematical processing of the curve for characteristic ion with m/z 41 attributed to formation of volatile hydrocarbons. The best fit was obtained using the first-order non-isothermal kinetic model, which suggests seven individual stages of HDPE degradation at 200–730 °C to produce volatile hydrocarbons (Fig. 2c). The curve for ion with m/z 18 (water formation) was also treated. The results are shown in Table 1 (sample 1).
For the interpretation of the results obtained, let us consider the basic scheme of HDPE thermal decomposition (reactions 1–19).
-
Initiation of chain thermal degradation
-
(a) intermolecular pseudo-monomolecular decomposition of hydroperoxides
$$ {\text{ROOH + RH}} \to {\text{RO}}^{ \cdot } + {\text{R}}^{ \cdot } + {\text{H}}_{ 2} {\text{O}} \uparrow $$(1) -
(b) intramolecular pseudo-monomolecular decomposition of hydroperoxides
 (2)
(2) -
(c) bimolecular decomposition of hydroperoxides
$$ 2 {\text{ROOH}} \to {\text{ROO}}^{ \cdot } + {\text{RO}}^{ \cdot } + {\text{H}}_{ 2} {\text{O}} \uparrow $$(3) -
(d) monomolecular decomposition of hydroperoxides
$$ {\text{ROOH}} \to {\text{RO}}^{ \cdot } +^{ \cdot } {\text{OH}} $$(4) -
(e) C–C bond cleavage
 (5)
(5)Peroxy radical depletion
$$ {\text{ROO}}^{ \cdot } + {\text{RH}}\mathop{\longrightarrow}\limits^{ - {\text{R}}^{ \cdot } }{}{\text{ROOH}} \to \{ {\text{RO}}^{ \cdot } +^{ \cdot } {\text{OH}}\} \mathop{\longrightarrow}\limits^{{ 2 {\text{RH}}}}{\text{ROH}} + 2{\text{R}}^{ \cdot } {\text{ + H}}_{ 2} {\text{O}} \uparrow $$(6)$$ {\text{ROO}}^{ \cdot } + {\text{R}}^{ \cdot } \to {\text{ROOR}} \to \{ {\text{RO}}^{ \cdot } +^{ \cdot } {\text{OR}}\} \mathop{\longrightarrow}\limits^{{ 2 {\text{RH}}}} 2 {\text{ROH}} + 2{\text{R}}^{ \cdot } $$(7) (8)
(8) -
Alkoxy radical depletion
$$ {\text{RO}}^{ \cdot } + {\text{RH}} \to {\text{ROH + R}}^{ \cdot } $$(9)$$ {\text{RO}}^{ \cdot } + {\text{R}}^{ \cdot } \to {\text{ROH}} $$(10) (11)
(11) -
Hydroxy radical depletion
$$ ^{ \cdot } {\text{OH}} + {\text{RH}} \to {\text{R}}^{ \cdot } + {\text{H}}_{ 2} {\text{O}} \uparrow $$(12)$$ ^{ \cdot } {\text{OH}} + {\text{R}}^{ \cdot } \to {\text{ROH}} $$(13) -
Chain scission
 (14)
(14) -
Chain transfer
-
(a) intermolecular
 (15)
(15) -
(b) intramolecular
 (16)
(16) -
Chain branching
 (17)
(17) -
Chain cross-linking
 (18)
(18) -
Chain termination
 (19)
(19)


Under oxygen-free atmosphere, polyethylene is stable at temperature up to 290 °C [12]. In our case, the formation of volatile hydrocarbons as a result of polyethylene thermal degradation was started at 233 °C. This is probably because of relatively high concentration of weak link sites, present in polymer, which are responsible for the initiation of the degradation process. Those sites are mainly peroxides, carbonyls, chain branches, and unsaturated structures [13]. Peroxide groups are the most probable weak links which are formed during polyethylene preparation, storage, and processing [14]. Our results confirm the presence of hydroperoxides in relatively high concentration because quite high amount of H2O was formed during the initial and main stage of HDPE thermolysis (230–500 °C). Probably, carboxylic groups are also present in some amount and could yield carbon dioxide during degradation.
The mechanism of hydroperoxide decomposition to yield water is schematically shown with the reactions 1–3. Activation energy of hydroperoxide decomposition in the polyethylene melt was found to be 109 kJ mol−1 [15]. For the intramolecular pseudo-monomolecular degradation of peroxides (reaction 2), activation energy is somewhat (<4 kJ mol−1) higher than that for intermolecular pseudo-monomolecular degradation (reaction 1) [16]. Bimolecular hydroperoxide decomposition (reaction 3) seems less favorable as it requires quite high hydroperoxide concentration; however, in polyethylene, local concentrations may be high although the average concentration is small. Besides, in polymers such as polypropylene, intramolecular sequences of hydroperoxides are typical [16]. Monomolecular hydroperoxide decomposition (reaction 4) can be neglected in comparison with pseudo-monomolecular decomposition (reactions 1, 2) in the temperature range up to 300 °C and more [15]. Activation energy for chain initiation reaction via C–C bond cleavage (reaction 5) is higher than that for hydroperoxide decomposition and is 173 kJ mol−1 to form two primary radicals, 170 kJ mol−1 to form one primary and one secondary radical, and 150 kJ mol−1 to form one primary and one allyl-type radical [17].
Based on these data, our results suggest that the initial stage of HDPE degradation is indeed associated with decomposition of weak links. Activation energy of the first stage of volatile hydrocarbon formation during polyethylene decomposition (first peak on the curve with T max 269 °C, Fig. 2c) is 158 kJ mol−1 (Table 1, peak 1 (m/z 41), sample 1). This value is less than the activation energy for chain initiation via C–C bond cleavage to form primary radicals. Our results are in consistence with the results obtained by Peterson et al. [13] who studied the kinetics of polyethylene degradation in nitrogen using TG–DSC and derived the activation energy value of 150 kJ mol−1 for the initial stage of polymer degradation. Apparently, the first stage of volatile hydrocarbon formation during HDPE degradation is mainly related to hydroperoxide decomposition followed by hydrocarbon macroradical formation and chain scission. The concurrent reaction to yield volatile hydrocarbons could be the formation of allyl radicals at the macromolecule ends.
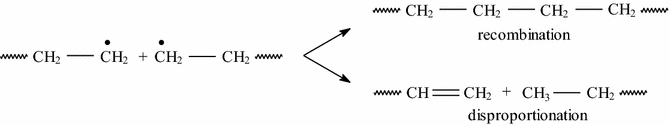
During hydroperoxide decomposition, highly reactive peroxy, alkoxy, and/or hydroxy radicals are formed. Their most important further reactions are hydrogen abstraction (reactions 6, 9, 12), β-scission (reactions 8, 11), and recombination with hydrocarbon macroradical (reactions 7, 10, 13) [18]. Participation of peroxy and hydroxy radicals in hydrogen abstraction reactions (6, 12) results in water formation. We assume that the second peak on the curve for the ion with m/z 18 (Fig. 2b, T max 415 °C) is related to water formation according to the following brutto reaction:
The effective activation energy of this reaction was found to be 202 kJ mol−1 (Table 1, peak 2 (m/z 18), sample 1).
The second stage of volatile hydrocarbon formation during HDPE thermolysis (Fig. 2c, peak 2, T max 327 °C) has effective activation energy of 176 kJ mol−1 and could be initiated not only by weak links but also by chain initiation reaction via C–C bond cleavage to form two primary radicals (reaction 5) as activation energies become commensurable. The contribution of first two stages (230–360 °C) of volatile hydrocarbon formation (by m/z 41) to the overall process at 230–730 °C is rather negligible (about 3 %).
The third stage of HDPE degradation (350–500 °C, T max 453 °C) is the main stage at which about 67 % of the overall volume (by 41 m/z) of volatile hydrocarbons is produced. The activation energy derived is 215 kJ mol−1, which is in good agreement with value reported by Peterson et al. [13] (about 220 kJ mol−1) and by Chrissafis et al. [18] (about 217 kJ mol−1) at a conversion degree of α ~ 0.3. At this stage, chain initiation (reaction 5) occurs simultaneously with chain scission (reaction 14), chain transfer (reactions 15, 16), chain branching (reaction 17), chain cross-linking (reaction 18), and oxygen-containing radical depletion (reactions 6–13). Probably, to some extent, chain termination also takes place (reaction 19). Thermal decomposition of polyethylene results in the formation of large amounts of C 1–C 70 hydrocarbons [14], depolymerization process (chain propagation) being not significant because very little amount (<1 %) of the monomer is produced [13]. The most abundant products are propene and 1-hexene, suggesting that the radical reaction with fifth carbon atom is the most probable due to geometric favorability to form six-membered transition state [14]:

So the primary pathway for HDPE degradation is random scission; however, chain branching and cross-linking are also important [19]. Random scission becomes limiting step as weak links are consumed and oxygen-containing radicals are depleted.
Literature values of the activation energy for non-oxidative degradation of polyethylene under N2, He, or vacuum, derived using non-isothermal TG, isothermal TG, or factor-jump TG techniques, are reported to be 147–273 kJ mol−1 [13]. Besides, the effective activation energy of polyethylene degradation may increase with molecular mass: 193 kJ mol−1 (11,000 Da), 220 kJ mol−1 (16000 Da), and 277 kJ mol−1 (23000 Da) [12]. The estimated activation energy for the degradation initiated by random scission has the maximum value of 240 kJ mol−1 [13]. Our results suggest that maximum activation energy of volatile hydrocarbons formation is 290 kJ mol−1 (Table 1, peak 7 (m/z 41), sample 1). Apparently, the difference is related to the history of the samples under study. In our case, HDPE sample contained high concentration of hydroperoxides. This resulted in the accumulation of alcohol (hydroxyl) groups during the processes of oxygen-containing radical depletion (reactions 6, 7, 9, 13). Hydroxyl groups probably became the centers of high-temperature chain initiation according to the following scheme:
The activation energy of water formation in high-temperature region (560–770 °C), as we suppose by the above reaction, is 287 kJ mol−1 (Fig. 2b, peak 3, T max 681 °C). It indicates that activation energy ~ 290 kJ mol−1 is rather related to high-temperature chain initiation via oxygen-containing group decomposition than to maximum value for random scission.
At temperature higher than 600 °C, the compounds with m/z 28, 29 are formed with rising intensity at 600–800 °C (Fig. 2a). Those are attributed to the formation of oxygen-containing species—mainly carbon monoxide produced by C = O group breakdown, as well as aldehydes and/or saturated hydrocarbons probably produced by side-group elimination.
The curves for some characteristic ions produced during thermolysis of HDPE filled with hydrophilic silica (HDPE–A200) are shown in Fig. 3. It is seen that filling with silica did not essentially affect the mechanism and kinetics of the main volatile product formation. The initial temperature of degradation is the same as in the case of the unfilled HDPE thermolysis. The most notable change is the shift of T max for all individual stages of volatile hydrocarbon formation (by m/z 41) to higher temperatures (Table 1, peaks 1–7, sample 2), T max of the main degradation stage being shifted from 453 to 462 °C. Upon this, activation energy generally increased by 2–8 kJ mol−1, and at the main degradation stage, it increased from 215 to 218 kJ mol−1. An increase in T max for the degradation of HDPE filled with fumed silica was also observed by Chrissafis et al. [18] who used TG–DSC method (in nitrogen flow). Activation energy increased generally by 6 kJ mol−1 upon HDPE filling with silica (5 mass %). Such an increase has been attributed to “shielding effect of nanoparticles in the evolution of formed gasses from polymer matrix during its thermal decomposition”.

Curves of the main volatile products of HDPE–hydrophilic silica thermolysis: a ions with m/z 28, 29, and 41; b ions with m/z 18, 41, and 44

Curves of the main volatile products of HDPE–hydrophobic silica thermolysis: a ions with m/z 28, 29, and 41; b ions with m/z 18, 41, and 44
Another notable difference between HDPE and HDPE–A200 thermolysis is the profile of the curve for ion with m/z 18 (Fig. 3b). Two high-temperature peaks are not so profound as in the case of the unfilled HDPE thermolysis. Besides, T max of the left one is shifted from 411 °C to 356 °C, the activation energy being decreased from 202 to 185 kJ mol−1. In our opinion, these changes are related to the influence of silica surface on hydroperoxides decomposition. Thus, reactions 1–3 may be suppressed due to higher affinity of oxygen to silicon than to hydrogen, and reaction 4 may result in scavenging of hydroxyl radicals by surface silicon atoms (indirect support of the hypothesis on the antioxidant activity of silicon are the results obtained by Choi et al. [20]). Upon this, activation energy drops because of fewer channels for water formation including those having higher activation energy. If the above-mentioned assumption is true, the chain initiation reaction to form allyl radicals at the macromolecule ends and to yield volatile hydrocarbons seems to be dominant at the initial stage of HDPE decomposition.
The curves for some characteristic ions produced during thermolysis of HDPE filled with hydrophobic silica (HDPE–AMT) are shown in Fig. 4.

Curves of the main volatile products of HDPE–BHT thermolysis: a ions with m/z 28, 29, and 41; b ions with m/z 18, 41, and 44
Notable changes with respect to neat HDPE degradation are (1) the absence of distinct peak with T max about 350–400 °C on the curve of ion with m/z 18 (as in the case of HDPE–A200 sample); (2) appearance of pronounced broad peak with T max ~ 600 °C on the curve of ion with m/z 41; (3) diminishing of the peak with T max at 450 °C and increasing of that with T max ~ 715 °C on the curve of ion with m/z 44; (4) the absence of pronounced rising of the curve at T > 550 °C on the curve of ion with m/z 29.
The first change may be explained as in the case of HDPE–A200 by the influence of silica surface on hydroperoxide decomposition. However, unlike the case with HDPE–A200, filling of HDPE with hydrophobic silica did not result in substantial diminishing of the second high-temperature peak attributed to water formation. This is probably due to the different mechanism of oxyradical scavenging—in the case of hydrophobic silica, methyl groups participate in this process resulting in the formation of oxygen-containing species with C–O bonds rather than Si–O ones. The former are more easily decomposed to produce volatile oxygen-containing species than the latter.
Other changes may be attributed to participation of methyl radicals of grafted trimethylsilyl groups in HDPE chain degradation processes—from suppression of chain scission to promotion of chain termination reactions. This results in formation of degradation products attached to the surface, whose further decomposition pathways differ from those for neat HDPE. Thus, mechanism and kinetics of volatile hydrocarbon formation changes: the higher amount of unsaturated species is evolved at T > 500 °C (m/z 41), so that the relative amount of evaporated hydrocarbons at the main stage of HDPE degradation decreased from 67 to 50 % (Table 1, peak 3 (m/z 41), sample 3). In high-temperature region, oxygen is removed in the form of CO (m/z 28) and CO2 (m/z 44) rather than in the form of oxygen-containing hydrocarbons (m/z 29).
The curves for the main volatile products of thermal decomposition of HDPE containing BHT are shown in Fig. 5. The main notable changes in thermal behavior with respect to the neat HDPE are as follows: (1) two pronounced high-temperature peaks on the curve for ion with m/z 18 are not observed; (2) significantly more profound peaks with T max ~ 635 and 690 °C appeared on the curve of ion with m/z 41, and the first pronounced peak maximum is shifted from 450 to 440 °C; (3) diminishing and left-shifting of the peak with T max at 450 °C on the curve of ion with m/z 44.
The absence of distinct high-temperature peaks attributed to water formation may be related to the ability of BHT to scavenge oxyradicals (one BHT molecule is capable of scavenging two radicals, reaction 20) and therefore to prevent their participation in hydrogen abstraction reactions with polymer to yield water. Being highly mobile and relatively stable, BHT radicals may both promote chain initiation reactions at the main stage of polymer degradation (reaction 21) and suppress chain scission reactions (reaction 20) or even change their pathway. As a result, the activation energy at chain initiation and at the main degradation stage drops (in our case from 158 to 156 kJ mol−1 and from 215 to 211 kJ mol−1, respectively, Table 1, peak 1, 3 (m/z 41), sample 4) and the fraction of volatile hydrocarbons formed at this stage decreases (in our case by 2.5 times—from 67 to 26 %). Perhaps, hydrophobic silica affects the HDPE degradation in similar manner, but this effect is less pronounced, and there was no drop in the activation energy of the main degradation stage—probably, this drop was compensated by slight increase in activation energy attributed to shielding effect of nanoparticles, which was mentioned above.

The curves for the main volatile products of thermal decomposition of HDPE containing hydrophilic silica with immobilized antioxidant BHT are shown in Fig. 6. The profile of the curves is closest to that for HDPE filled with hydrophobic silica but with more pronounced high-temperature peaks on the curves for ions with m/z 18 and 44, and with less pronounced broad peak with T max about 600 °C on the curve for ion with m/z 41.

Curves of the main volatile products of HDPE–hydrophilic silica/BHT thermolysis: a ions with m/z 28, 29, and 41; b ions with m/z 18, 41, and 44
BHT interacts with hydrophilic silica surface via the formation of adsorption complexes between phenol group, which plays an essential role in stabilization mechanism, and surface silanol group [21]. As a result, immobilization of this antioxidant leads to its partial deactivation and probably changes the mechanism of antiradical action during HDPE thermolysis. As in the case of hydrophobic silica with grafted trimethylsilyl groups, this mechanism may involve methyl groups of tert-butyl radicals of immobilized BHT molecule in radical reactions during HDPE thermal degradation. More pronounced, in comparison with HDPE–AMT, peaks on the curve for ions with m/z 18 and 44 (T max 700 °C) may be related to additional water and carbon dioxide formation as a result of degradation of organic species containing oxygen originated from BHT phenolic group.
Activation energy at chain initiation is the same as that for HDPE–BHT sample; however, it is slightly higher for the main degradation stage (214 kJ mol−1 in comparison with 211 kJ mol−1, Table 1, peak 3 (m/z 41), sample 5). The fraction of volatile hydrocarbons formed at the main stage of HDPE–A200/BHT degradation (60 %) is much more than in the case of HDPE–BHT degradation (26 %) and is somewhat intermediate between HDPE–A200 (69 %) and HDPE–AMT (50 %) case of degradation.
The curves for the main volatile products of thermal decomposition of HDPE containing hydrophobic silica with immobilized antioxidant BHT are shown in Fig. 7.

Curves of the main volatile products of HDPE–hydrophobic silica/BHT thermolysis: a ions with m/z 28, 29, and 41; b ions with m/z 18, 41, and 44
It is seen that the effect of hydrophobic nanofiller with immobilized antioxidant on thermal decomposition of HDPE is the most pronounced among all the studied additives. It is regarded mostly with the kinetics of volatile hydrocarbon (m/z 41) formation. The fraction of volatile hydrocarbons formed at the main (for the neat HDPE) stage of degradation in the case of HDPE–AMT/BHT composite is only 12 % (Table 1, peak 3 (m/z 41), sample 6) and this value is even less than in the case of HDPE–BHT sample (26 %). The activation energy for the stage with the highest relative amount of volatile hydrocarbons formed (43 %) is 309 kJ mol−1, which already becomes close to single C–C bond dissociation energy (from 315 kJ mol−1 for some tert-butyl radicals to 370 kJ mol−1 for prime radicals [22]).
The reason of such dramatic difference in kinetics of volatile hydrocarbon formation (by m/z 41) between the unfilled HDPE (or even HDPE–A200/BHT) and HDPE filled with trimethylsilylated silica containing BHT at the surface lies in different mechanisms of BHT adsorption on hydrophobic as compared to hydrophilic surface. BHT molecules are retained on hydrophobic silica surface mostly by relatively weak dispersion forces. Upon the temperature rise, BHT molecules are gradually released from hydrophobic silica surface and act as efficient radical scavengers (as in the case of HDPE with just BHT added) inhibiting chain reactions of HDPE decomposition. Those parts of hydrophobic silica surface from which BHT molecules were released also become the participants of chain degradation reactions. So in this case, the additive effect of BHT molecules and hydrophobic silica surface is observed. In order to verify the validity of the assumption on easier release of BHT molecules from hydrophobic surface, as well as to make a general estimation of the mobility of BHT in HDPE depending on the form of this antioxidant, we compared the changes in the intensity of ion with m/z 57 (second by the abundance ion after the one with m/z 205 in the electron ionization mass spectrum of BHT [23]) upon the temperature rise. The results are shown in Fig. 8.

Volatility of the antioxidant BHT (by 57 m/z ion) in 1 HDPE–hydrophilic silica/BHT; 2 HDPE–hydrophobic silica/BHT; 3 HDPE–BHT; 4 free BHT
As one may see, indeed the least volatility is observed for HDPE containing BHT immobilized on hydrophilic silica surface. The mobility of BHT, adsorbed on hydrophobic silica, in HDPE matrix is much higher but still less than in the case of just BHT added to the polymer. Thus, introducing hydrophobic nanosilica with immobilized antioxidant into HDPE matrix seems to be a perspective approach not only to decrease the physical loss of the antioxidant preserving its antioxidant activity, but also to improve thermal stability of the polymer.
Conclusions
Hydrophilic silica filler has no essential effect on HDPE thermal decomposition and only slightly increases the activation energy of chain scission reactions. The effect of hydrophobic silica is characterized by the participation of surface trimethylsilyl groups in radical reactions, which results in suppressing of chain scission reactions and producing attached to the surface degradation products whose further decomposition pathways differ from those for neat HDPE.
The presence of BHT antioxidant in polymer promotes chain initiation reactions at the main stage of HDPE degradation and inhibits chain scission reactions. The antioxidant mobility (expressed as volatility) decreases in the following sequence: free BHT > BHT in HDPE > hydrophobic silica/BHT in HDPE > hydrophilic silica/BHT in HDPE.
The inhibiting effect of BHT immobilized on hydrophilic silica during HDPE thermolysis differs essentially from that for the antioxidant immobilized on hydrophobic silica: in the first case, the antioxidant is not mobile, and mainly methyl radicals of its molecules are involved in high-temperature radical scavenging, while in the second case, this process occurs with participation of a phenolic group as well. Moreover, there is an additive inhibiting effect of BHT and hydrophobic silica because of easier release of the antioxidant molecules from hydrophobic surface. The capability of the additives to inhibit chain scission reaction during thermal decomposition of HDPE in vacuum is as follows: hydrophobic silica/BHT > BHT > hydrophobic silica > hydrophilic silica/BHT > hydrophilic silica ≈ no additives.
References
Till DE, Ehntholt DJ, Reid RC, Schwartz PS, Sidman KR, Schwope AD, Whelan RH. Migration of BHT antioxidant from high density polyethylene to foods and food simulants. Ind Eng Chem Prod Res Dev. 1982;21:106–13.
Widomski M, Kowalska B, Kowalski D, Kwietniewski M, Czerwinski J. Modelling the concentration of antioxidant BHT migrating from polyethylene pipe to water. In: Mambretti S, Brebbia CA, editors. Urban water. Southampton: WIT Press; 2012. p. 49–60.
Tombesi NB, Freije H. Application of solid-phase microextraction combined with gas chromatography-mass spectrometry to the determination of butylated hydroxytoluene in bottled drinking water. J Chromat A. 2002;963:179–83.
Wessling C, Nielsen T, Leufven A, Jagerstad M. Mobility of alpha-tocopherol and BHT in LDPE in contact with fatty food simulants. Food Addit Contam. 1998;15:709–15.
Lee YS, Shin HS, Han JK, Lee M, Giacin JR. Effectiveness of antioxidant-impregnated film in retarding lipid oxidation. J Sci Food Agr. 2004;84:993–1000.
Munteanu D, Mracec M, Tincul I, Csunderlik C. Monomeric antioxidants. An 1H-NMR spectrometry study of their homopolymerization. Polym Bull. 1985;13:77–82.
Kim TH, Song Y, Kim JN. Synthesis and properties of new polymer having hindered phenol antioxidants. Bull Korean Chem Soc. 2003;24:1853–5.
Lipatov YS. Polymer Reinforcement. Toronto: ChemTech Publishing; 1995.
Dorigato A, Pegoretti A, Frache A. Thermal stability of high density polyethylene–fumed silica nanocomposites. J Therm Anal Calorim. 2012;109:863–73.
Bolbukh Yu, Kuzema P, Tertykh V, Laguta I. Thermal degradation of polyethylene containing antioxidant and hydrophilic/hydrophobic silica. J Therm Anal Calorim. 2008;94:727–36.
Pokrovskiy VA. Temperature-programmed desorption mass-spectrometry. J Therm Anal Calorim. 2000;62:407–15.
Madorsky SL. Thermal degradation of organic polymers. New York: Interscience Publishers; 1964.
Peterson JD, Vyazovkin S, Wight CA. Kinetics of the thermal and thermo-oxidative degradation of polystyrene, polyethylene and poly(propylene). Macromol Chem Phys. 2001;202:775–84.
Grassie N, Scott G. Polymer degradation and stabilization. Cambridge: Cambridge University Press; 1985.
Gugumus F. Thermolysis of polyethylene hydroperoxides in the melt: 1. Experimental kinetics of hydroperoxide decomposition. Polym Degrad Stab. 2000;69:23–34.
Gugumus F. Re-examination of the thermal oxidation reactions of polymers. 2. Thermal oxidation of polyethylene. Polym Degrad Stab. 2002;76:329–40.
Ranzi E, Dente M, Faravelli T, Bozzano G, Fabini S, Nava R, Cozzani V, Tognotti L. Kinetic modeling of polyethylene and polypropylene thermal degradation. J Anal Appl Pyrolysis. 1997;40–41:305–19.
Chrissafis K, Paraskevopoulos KM, Pavlidou E, Bikiaris D. Thermal degradation mechanism of HDPE nanocomposites containing fumed silica nanoparticles. Thermochim Acta. 2009;485:65–71.
Hinsken H, Moss S, Pauquet J-R, Zweifel H. Degradation of polyolefins during melt processing. Polym Degrad Stab. 1991;34:279–93.
Choi M-K, Kim E-J, Bu SY, Sung MK, Jo C-W, Kang M. Analysis of antioxidant activity of silicon in vitro and murine macrophages. FASEB J. 2013;27(859):1.
Liauw CM, Childs A, Allen NS, Edge M, Franklin KR, Collopy DG. Effect of interactions between stabilisers and silica used for antiblocking applications on UV and thermal stability of polyolefin film. 1. Adsorption studies. Polym Degrad Stab. 1999;63:391–7.
Luo Y-P. Comprehensive handbook of chemical bond energies. Boca Raton: CRC Press; 2007.
Mass spectrum (electron ionization) of butylated hydroxytoluene. In: NIST mass spectrometry data center. 2010. http://webbook.nist.gov/cgi/cbook.cgi?Name=bht&Units=SI&cMS=on. Accessed 10 Oct 2014.
Acknowledgements
The research leading to these results has received funding from the People Programme (Marie Curie Actions) of the European Union’s Seventh Framework Programme FP7/2007–2013/under REA grant agreement No PIRSES-GA-2013-612484.
Author information
Authors and Affiliations
Corresponding author
Rights and permissions
About this article

Cite this article
Kuzema, P.O., Bolbukh, Y.M., Tertykh, V.A. et al. Vacuum thermal decomposition of polyethylene containing antioxidant and hydrophilic/hydrophobic silica. J Therm Anal Calorim 121, 1167–1180 (2015). https://doi.org/10.1007/s10973-015-4646-5
Received:
Accepted:
Published:
Issue Date:
DOI: https://doi.org/10.1007/s10973-015-4646-5