
Abstract
The current approach to selection of a population PK/PD model is inherently flawed as it fails to account for interactions between structural, covariate, and statistical parameters. Further, the current approach requires significant manual and redundant model modifications that heavily lend themselves to automation. Within the discipline of numerical optimization it falls into the “local search” category. Genetic algorithms are a class of algorithms inspired by the mathematics of evolution. GAs are general, powerful, robust algorithms and can be used to find global optimal solutions for difficult problems even in the presence of non-differentiable functions, as is the case in the discrete nature of including/excluding model components in search of the best performing mixed-effects PK/PD model. A genetic algorithm implemented in an R-based NONMEM workbench for identification of near optimal models is presented. In addition to the GA capabilities, the workbench supports modeling efforts by: (1) Organizing and displaying models in tabular format, allowing the user to sort, filter, edit, create, and delete models seamlessly, (2) displaying run results, parameter estimates and precisions, (3) integrating xpose4 and PsN to facilitate generation of model diagnostic plots and run PsN scripts, (4) running regression models between post-hoc parameter estimates and covariates. This approach will further facilitate the scientist to shift efforts to focus on model evaluation, hypotheses generation, and interpretation and applications of resulting models.
Introduction
The current approach to population PK/PD model selection is formally known as downhill search and belongs to a class of optimization methods known as local search [1]. Local search uses information about a small number of similar candidate models (perhaps only two models) to make step-wise changes in the model. Within the set of optimization algorithms, downhill search is the most efficient (completing with the fewest evaluations of model quality), but the least robust. At the other extreme (least efficient, but most robust) is an exhaustive search. Exhaustive search entails examining all possible combinations of structural, statistical, and covariate model features and would give rise to millions of potential models for even a standard population pharmacokinetic model search space. Out of necessity, the traditional approach to population PK/PD modeling greatly reduces the sample space of models by proceeding in a stepwise manner, with the user first identifying the best base structural model, and then searching for significant covariate relationships and statistical models. Not only is this approach labor intensive in that it requires a great deal of manual work by the user, it is also not guaranteed to find the optimal solution due to interaction between structural, statistical, and covariate model components [2]. Further, this method involves many repetitive (i.e. testing various covariate model functional forms) and predictable (i.e. testing 1, 2, 3 compartment) processes that lend themselves to automation.
Genetic algorithms
Genetic algorithms (GA) are a class of optimization algorithms inspired by the mechanisms of evolution [3]. By applying selective pressure to a population of potential solutions of a problem and combining features of well performing solutions, GAs proceed in an analogous manner as fit organisms surviving and producing offspring. Over time, generations will progressively become stronger and solutions improved. Just like evolution, genetic algorithms are guided in part by random processes. However, it is important to note they are certainly not a uniform random search. On average, a uniform random search would be expected to be no more efficient than an exhaustive grid search. While a uniform random search will sample models with uniform probability, genetic algorithms exploit historical information from previous iterations to direct the search towards better solutions. As such, in the trade off between most efficient, least robust (downhill) and least efficient, most robust (exhaustive search), GA lies somewhere near the middle: more robust than downhill, but much more efficient than exhaustive search.
Theory
Genetic algorithms were developed by Dr. John Holland et al. at the University of Michigan in the 1960s [4]. The motives for his efforts were to formally explain adaptive processes seen in natural systems and to construct methods in which these adaptive processes could be implemented in computer systems. Since then, GAs have been applied across many fields and industries including molecular and evolutionary biology, mathematics, engineering, and political sciences. Their robust nature allows them to be applied to many types of difficult optimization problems.
To understand and appreciate the mechanisms of the genetic algorithm, it is important to have an understanding of evolution and in particular the concept of survival of the fittest. The phrase survival of the fittest was coined by biologist Herbert Spencer in his book Principles of Biology [5]. The concept is a core element of the Darwinian theory of evolution and describes the preservation of species that are most suited to their environment and possess traits which increase their ability to reproduce. The word ‘fit’ in this context, of course, does not refer solely to physical strength, but any attribute that increases the chances of survival. Evolution then, driven by survival of the fittest, becomes a trial-and-error iterative procedure towards establishing ‘fitter’ organisms as generations pass. This is essentially a naturally occurring optimization algorithm, where efficiency is likely important to the continuation of the species. This is the driving principle in the genetic algorithm applied in this setting.
The algorithm begins with an initial “population” of models, and continues through several generations, modifying and running different models through each generation until no better solution can be found. GA has been implemented in several available software platforms including R, Matlab, Julia and Python.
Model components commonly included in population pharmacokinetic model search space
Structural
Absorption
-
Lag time: presence or absence of a lag time
-
Transit compartments: the number of absorption site transit compartments, if any
-
Absorption rate: zeroth or first order absorption, or both.
-
Non-linear processes: saturable absorption (decreased bioavailability with increased dose), saturable degradation at absorption site (increased bioavailability).
Distribution
-
Number of compartments: 1, 2, 3 compartments (> 3 compartments is often indistinguishable from 3 compartments).
Elimination
-
Saturable clearance: presence or absence of saturable clearance.
PD model
-
Pharmacodynamic models: Indirect response (I-IV), direct response, biophase, etc.
Initial estimates for NONMEM quasi-Newton minimization.
Statistical model components
-
Residual error on dependent variable/s: additive, proportional, or combined
-
Inter-individual variability (IIV) on structural parameters: lognormal or absent
Covariate model components
Linear relationship
With a linear relationship, the typical value of a parameter changes linearly for each unit change in the covariate value. The relationship is shown in Eq. 1:
Covi is the value of the covariate for an individual, \(\widehat{\mathrm{Cov}}\) is the population median value of the covariate, TVParam is the typical value of the parameter in a subject with Covi, THETAA is the typical value of the parameter for a subject with the median value of the covariate, and THETAB is the linear slope parameter for the change of TVParam for each unit change in the covariate.
Exponential relationship
With an exponential relationship, the typical value of a parameter changes exponentially for each unit change in the covariate value. The relationship is shown in Eq. 2:
The value of THETAB now represents the change in log(TVParam) for each unit change in the covariate.
Power relationship
With a power relationship, the change in the typical value of the parameter with a change in the covariate value is described by a power function. The relationship is shown in Eq. 3:
The value of THETAB now represents the change in log(TVParam) for each unit change in log(Covi).
Current approach to population PK/PD modeling
The traditional approach to selecting the optimal popPK/PD model proceeds in a stepwise manner. The general process is shown in a diagram from the NONMEM user’s guide [6], shown below in Fig. 1. After careful examination of the data through exploratory analyses, the user begins by testing the simplest biologically plausible model given the drug’s mechanism and the results of the data exploration. Typically, model fitness and the selection of an optimal model is guided by an objective function (usually the − 2LL) as well as various graphical indicators such as residual plots and visual predictive checks.
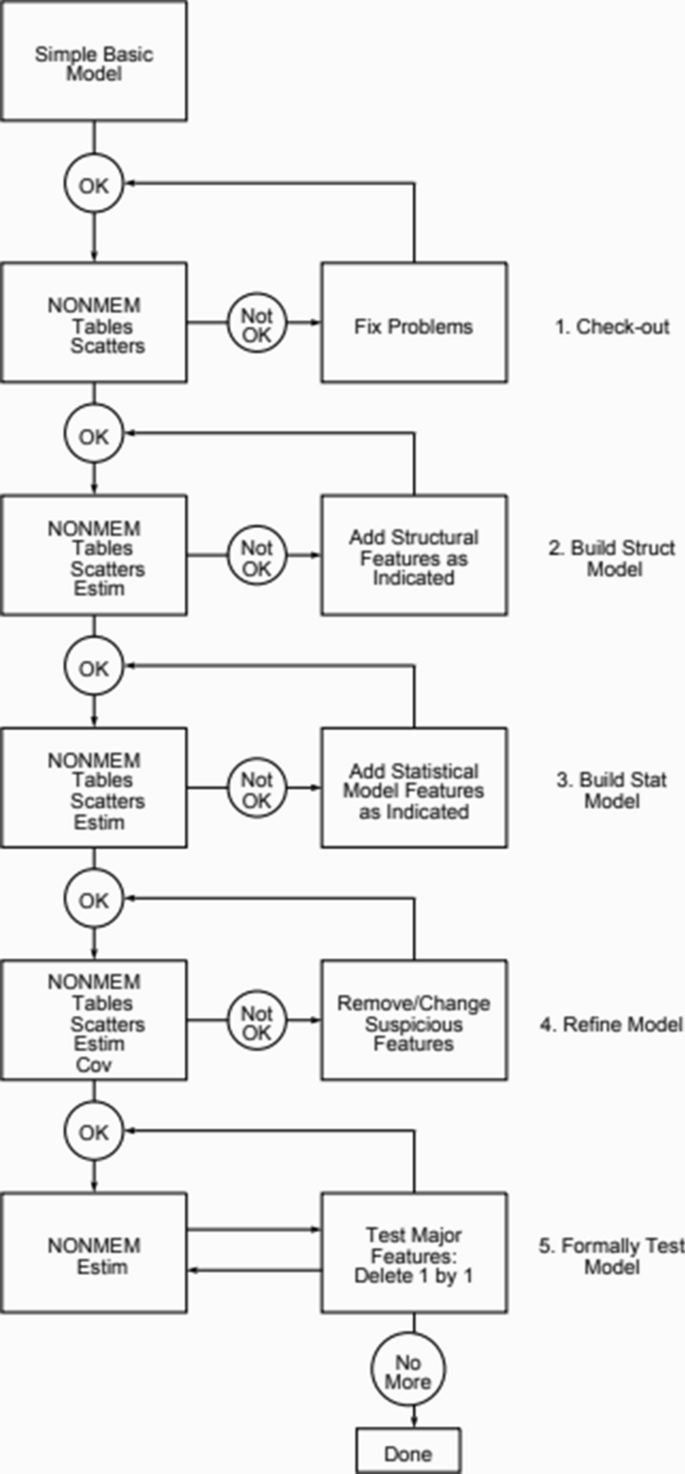
Schematic for model building from NONMEM manual (used with permission)
The current approach is a local search and is not guaranteed to find the globally optimal combination of model components. In fact, a paper by Sherer et al. compared this approach to a genetic algorithm based global search and found in seven out of seven datasets the traditional approach failed to find the global solution identified by the GA [7]. A population PK model and a tumor growth trajectory example are provided to illustrate the application of this approach.
Methods
Software
The genetic algorithm was adapted from an established implementation described in Sherer et al. [7]. The graphical user interface was developed with R version 3.3.2. The application has external software dependencies of NONMEM and Perl-Speaks-NONMEM. NONMEM version 7.3 and PsN 4.8.1 were used for application development and testing. The program is available cross-platform and has been tested on Windows and Linux (github.com/mhismail/nmga).
The genetic algorithm implementation
The general outline of how the algorithm proceeds is shown in Fig. 2. Each step in the GA evolution is described in the following sections.

Schematic of genetic algorithm approach to model selection
The chromosome
The term ‘chromosome’ refers to the representation of a candidate solution as a vector of parameters, or characteristics. If a user defines the search space to explore N model features the chromosome becomes:
where Pi represents the selected value for the ith parameter. For example, the chromosome of a candidate population PK/PD model may look something like:
The above representation shows an encoding in which model features are represented as character strings. Upon receiving instructions to run a model with the features encoded in the chromosome, the program translates the chromosome representation of the model into a syntactically correct control stream, to be described in later sections.
In previous iterations of the GA developed by Eric Sherer, Robert Bies and Mark Sale [1, 7], the chromosome was encoded as a binary string. Each model feature was represented as a string of zeros and ones. The direct encoding of the model as character strings, implemented here, has two main benefits over binary encoding. First, it is more interpretable and the user can easily understand which model is being run based on its chromosome. Second, it prevents the issue of degeneracy—in which some values of a parameter will be redundantly expressed, biasing solutions towards those values.
Initial population
The genetic algorithm begins by randomly selecting, without replacement, an initial population of models to be run. In general, the number of models in the initial population should be larger with an increasing number of model features to be tested, to allow for representation of all features. The models are then run in parallel and upon completion, the fitness of each is determined.
Defining model fitness
To allow the algorithm to proceed autonomously, there must be some objective measure of model performance. In the realm of genetic algorithms, this value is termed the fitness of the candidate solution. The fitness function used in the current program is by default the Akaike information criterion (AIC) as shown in Eq. 4 [8].
where L is the likelihood of the data given the model, and p is the number of total parameters, including fixed effects parameters (thetas) and random effect parameters (omegas and sigmas). While the AIC is the default fitness function, the user may specify a different information criteria or to include additional penalty terms depending on the intended goal of the project and on the personal preferences of the user. A project which aims to identify model parameters with adequate certainty may place greater emphasis on a successful covariance step. A project where the purpose of the modeling is to be used for simulations of new dosing scenarios may place more emphasis on predictive checks/external validation. Due to the uniqueness of each modeling assignment the following penalty terms can be added to the fitness function:
-
User defined penalty for unsuccessful convergence
-
User defined penalty for unsuccessful covariance step
-
User defined penalty for highly correlated parameters
-
User defined penalty for large eigenvalues
After the fitness of the models are determined, the genetic operators described in the next sections apply selective pressure and sporadic random changes (i.e., mutations) to determine the next generation of models.
Selection
The selection operator decides the next generation of models/individuals based on the fitness of the models in the previous generation. There are several selection methods for genetic algorithms, the most commonly known are roulette-wheel selection, rank selection, and tournament selection3. Roulette wheel selection assigns a probability to each model to be selected proportional to its fitness. Its name comes from a roulette wheel being partitioned into Nmods sections, with the size of each section being proportional to the performance of the model as shown in Eq. 5.
After probabilities are assigned, the operator samples with replacement from the discrete distribution the models which will continue to the crossover and mutation phases. This method suffers when one fitness value dominates—leading to premature convergence—and when fitness values are close in magnitude—leading to nearly uniform sampling—as is the case in the NONMEM objective function between models. This issue can be partially resolved by scaling the fitness values so that extreme values do not dominate the distribution. The rank selection method attempts to quell these disadvantages by instead assigning probabilities proportional to the rank of the individual model in the generation. In this case, the most fit model in the generation would be assigned the highest rank—“#1”, the least fit model would have the lowest fitness function value and lowest rank, so for a generation with 100 model candidates, that would be ranked #100. Other models are assigned an appropriate ordering/rank based on their relative fitness function values. Models would then be selected based on their rank with the highest rank (i.e., #1 model) having the highest probability of selection. The tournament selection method, another rank based method which is implemented in the current program, iterates through each individual model in the

generation, and for each chooses a random opponent from the remaining individual models. The one with the better fitness value is carried into the crossover pool. The process is shown by the following pseudo-code:
Crossover
Once the selection procedure is complete, the algorithm then applies the crossover operator to the selected models. Crossover is meant to mimic biological reproduction by combining features of well performing models in search of potentially better performing models. Two point crossover was implemented, which randomly selects two points along the parents’ chromosomes, and exchanges all features between those two points. A single crossover example is shown below in Fig. 3, however this process occurs for all models in the generation. Each row represents a specific model and the columns represent the features included in the model. The triangles in the figure represent randomly selected crossover points. Once crossover is complete, the models are then carried forward to the mutation phase.

Illustrated crossover showing the random selection of the crossover point (top panel) and the resulting change in the models (bottom panel)
Mutation
The mutation operator randomly changes features of the model with a low probability. The purpose of mutation is to prevent the algorithm from converging to a local minima by introducing new combinations of features throughout the entirety of the search. The mutation probability is typically set to a low value, as a high probability would convert the algorithm to essentially a random walk. Each feature of each model has a probability of 0.05 of being mutated, i.e. replaced with a different feature. Pseudocode to illustrate this function is shown below:

Elitism
Throughout the operations of crossover and mutation, it is always possible the best performing model from the previous generation will be lost. To preserve the best performing model through generations, elitism is implemented. After crossover and mutation are complete, the elitism operator randomly selects one model from the new generation to be replaced with the best performing model from the previous generation unaltered. Genetic algorithms will perform better if the most fit model is always included in the crossover pool [9], and elitism ensures this.
Downhill (local) search
While the genetic algorithm is very good at finding a solution near the global minimum quite fast, it can struggle to find the optimal solution locally. Take for example a search space in which one of the features being tested is a covariate relationship. The genetic algorithm may discover that including a covariate effect (linear, exponential, or power) drastically improves the model fit. However, the genetic algorithm cannot determine which of the three is the best until they are all introduced into the population by chance crossover and mutation. This single change typically must be implemented by mutation, which is a rare event. To expedite the identification of the locally optimal solution, the GA can be combined with a local search to form what is known as a hybrid GA. The local search implemented in this program is similar to the traditional approach to population model building. Starting from the current best model, all models that differ from the best model by exactly one feature are built and run. This downhill search is implemented every fifth generation and the best model is carried forward as an elite.
Two scenarios are explored to evaluate the model selection approach. Step-wise and genetic algorithm approaches (as implemented in the app) were applied to: (1) a simulated pharmacokinetic dataset and; longitudinal tumor growth measurements from a xenograft study.
Simulated PK dataset
A two compartment model was used to simulate a PK dataset. This dataset comprised 100 subjects receiving a 150 mg dose at time zero. Six concentrations were simulated for each subject. Three concentrations were simulated at random time points between 0 and 12 h and three samples were simulated a random time points between 12 and 48 h. Two continuous covariates were included in the dataset and were correlated with a r of 0.5. One continuous covariate (Cont_A) was related to clearance and volume of distribution. Two categorical covariates were simulated (Cat_A and Cat_B). Only Cat_B was related to parameters in the model (related to clearance only). A proportional residual error model was used for the simulation. The two continuous covariates were correlated with an r of 0.5. Inter-individual variability was included as an exponentiated term on CL, central volume of distribution and the first order absorption rate (Ka).
Mr. Yu and Dr. Bies were not aware of the model being simulated. The only elements that were considered were the scope of search to be considered for evaluating possible model candidates. The scope of search was evaluating if the PK model was 1, 2 or 3 compartment, whether there is inter-individual variability on any of these parameters, whether there is lag time for absorption (in addition to a first order process for absorption). The categorical and continuous covariates were assessed on CL or central volume of distribution only. If categorical, an exponentiated form was used to describe the relationship. If continuous, an exponentiated, additive and power law model structure were all considered for the model search space. Mr. Yu conducted the stepwise analysis. The fitness function used is shown below in Eq. 6:
where \(-2{\varvec{L}}{\varvec{L}}\) is minus two times the log likelihood (i.e., NONMEM objective function value), \({{\varvec{N}}}_{{\varvec{P}}{\varvec{a}}{\varvec{r}}}\) is the number of parameters, \({{\varvec{P}}}_{{\varvec{C}}{\varvec{o}}{\varvec{n}}{\varvec{v}}{\varvec{e}}{\varvec{r}}{\varvec{g}}{\varvec{e}}}\) is a flag for the penalty for non-convergence of the mode1 (0 for successful convergence, 1 for unsuccessful convergence) and \({{\varvec{P}}}_{{\varvec{C}}{\varvec{o}}{\varvec{v}}{\varvec{a}}{\varvec{r}}{\varvec{i}}{\varvec{a}}{\varvec{n}}{\varvec{c}}{\varvec{e}}}\) is a flag for the penalty for an unsuccessful covariance step (0 for successful convariance step, 1 for unsuccessful covariance step). The genetic algorithm was run with 200 models per generation for 30 generations. All models were run in NONMEM 7.4 using the FOCE-Interaction estimation method.
Tumor growth profiles
A series of tumor xenograft growth profiles were modeled with two investigators blinded to each others results. 24 mice with established LNCaP xenograft tumors were randomized into four groups: control, vehicle treatment (five intact mice); intact (not castrated) with diazepam treatment (five mice), castrated mice with vehicle treatment (seven mice) and castrated mice receiving diazepam treatment (seven mice). Castration and treatment were treated as dichotomous and time dependent (i.e., these were not instantiated immediately) depending on when the intervention was initiated in the experiment [10]. Models evaluated included the Simeoni growth with either cell distribution or signal distribution killing and the Koch growth model with either cell or signal distribution killing [11]. The models evaluated are shown in Fig. 4.

Matrix of models comprising the search space for the tumor growth measurements
Results
Workflow
Beginning from a one compartment base model NONMEM control stream with no covariate effects, the workflow implementing the genetic algorithm on a PK dataset will be shown.

Placeholders, termed token groups, are added to the NONMEM control stream by the user. These placeholders will eventually be replaced by tokens, which are snippets of NONMEM code, to produce a syntactically correct NMTRAN control stream. For example, to test a covariate effect, changes need to be made to the $PK block to include the mathematical relationship, and the $THETA block to include the initial estimate of the slope parameter. Thus, a placeholder would be added in those two locations. In this example, the following model components will be explored:
Structural
-
Number of compartments: 1 or 2.
Statistical
-
Presence or absence of IIV on clearance and central volume parameters.
Covariate effects
-
Linear, exponential, power, or no covariate relationship between age, weight, and sex on clearance.
-
Linear, exponential, power, or no covariate relationship between age, weight, and sex on central volume.
Expanding a full grid of possible models, there are over 8000 unique combinations of the above components for this simple search space. Here is the control stream again with the token groups added in the appropriate locations. Note, only blocks with changes are shown in the interest of compactness.

Now that the placeholders have been included, the user then uses the graphical user interface (GUI) to add features they would like to test. Shown in Fig. 5 below is the GUI when adding a covariate effect. First the placeholder corresponding to that covariate effect should be selected from the token group list, then the user specifies which relationships to test (token sets), and whether or not to center the covariate by its median.

Screenshot of genetic algorithm menu options for an example covariate implementation (weight on clearance)
Once all components to be tested have been added, the user can choose to view all possible models and run them manually or go directly to initiating the genetic algorithm.
When viewing the “All Models” modal, shown in Fig. 6, the user can perform several actions to a selected model including running the model directly from the user interface, deleting or editing the model, and opening the model location in a file explorer window. Once a model is run, either manually or by the GA, the user can see parameter estimates and generate Xpose [12] diagnostic plots.

Genetic algorithm software output table showing descriptive results of a series of models. The highlighted model corresponds to the parameters shown on the right side of the figure
To initiate the genetic algorithm, the user simply selects the corresponding button in the main interface and selects “Start”. The initial population will then be shown and NONMEM will be called through PSN [13] to run each model in parallel across multiple cores.
Shown in Fig. 7 are the results of the initial population. The program repeatedly queries running tasks, and once it finds all NONMEM instances are complete, it will start the next generation. This continues until the user manually ends the search.

Genetic algorithm model list showing the different models and the goodness of fit plot for the GA for part of generation 1
Each generation can be viewed by clicking on the buttons at the bottom of the model. Included on the right side of the interface, shown in Fig. 8, is a plot illustrating the progression of the search. The black line indicates the fitness of the best model and the red line shows the average fitness in the nth generation. Instead of returning the results of just the best model based on fitness, all model results are returned. The user can then look at the top performing models and apply further criteria to selecting the most appropriate model based on diagnostic plots or some other model diagnostic. The code for the app is provided as a supplemental file entitled PKGA.R and App.R and is also available at the github repository (github.com/mhismail/nmga).

Genetic algorithm model list snapshot showing model list and the fitness functions (median and best) for generations 1 through 16 (right had side of figure)
Population PK analysis results
A two compartment model with first order absorption was simulated. Covariate effects of phenotype (e.g. poor metabolizer) and Weight (power model) were included on clearance. IIV was included on clearance and central volume. The residual error model was proportional. The parameter used to generate the dataset from this model are shown in Table 1.
Step-wise model search
A forward addition threshold of 0.05 and backward elimination thresholds of 0.01 were used for model search.
GA model search
The genetic algorithm approach considered the following search scope: (1) one, two or three compartment model; (2) inter-individual variability present/absent as additive or exponentiated forms on all parameters; (3) continuous covariate relationships on any of the parameters as multiplicative, additive and exponentiated; (4) categorical covariate relationships on any of the parameters as present/absent with an exponentiated form (switching from a unique effect for each category). The control stream and token set utilized for this analysis are provided as supplemental files (nmdata1.csv and GAPK.ctl).
Stepwise analysis results
For the stepwise approach using the p < 0.05 forward and p < 0.01 backward, a two compartment model additive and proportional residual error resulted in a model with an OFV of − 2187. The continuous covariate A and categorical covariate B was identified as significant on clearance, BSV was identified on CL.
The true model used for simulation was implemented and parameter values estimated (Table 1). The objective function value that resulted was − 2174.09.
GA search results: best objective function value
The model with the lowest OFV (but not the lowest fitness function value) had an OFV of − 2161 and a fitness function value of − 2039. This model comprised a two compartment structure with first order elimination and an absorption lag. BSV was included on CL, V2 and V3. CovA, Cont_A was on CL, all covariates on v2 (cat a cat b Cont_A Cont_B). The parameter values are shown in Table 1.
GA search results best fitness function
The model with the lowest fitness function (− 2069) had an OFV of − 2153. The model comprised a two compartment structure with first order elimination and no absorption lag. BSV was included on CL and V2. The Cont_A and CATB covariates were included on clearance and the Cont_A on v2. The parameters are shown in Table 1.
Tumor growth profiles
Based on the computation power, we set to run 38 models per generation. It took on average 1 h to run a generation. The algorithm found the best model after 15 generations defined as no further improvement in the “best” model in each generation. Approximately 500 unique models were run. The Koch growth combined with cell distribution killing model performed best for the test dataset. The model with the best fitness had the following IIV characteristics: exponential IIV model on λ0; exponential IIV model on λ1; exponential IIV model on baseline tumor volume; no IIV on Tau of group 2; proportional IIV on K of group 2; exponential IIV on Tau of group 3; additive IIV on K of group 3; no IIV on Tau of group 4; and proportional IIV on K of group 4. The residual error model selected was proportional error model. The best fitness function of the GA selected model is 4885 for the Koch growth plus cell distribution killing model, while the typical approach to model building conducted by a “blinded” colleague resulted in a fitness of 5135 for a Simeoni model combined with signal distribution killing model. The GA control stream is provided (GATUMOR.ctl) and the dataset (tumor.csv) as supplemental files.
Discussion
The application of GA to population pk model selection requires the separation of the hypothesis generation process (human intelligence/experience required) from the hypothesis testing process (can be automated). In traditional model selection, these processes occur alternately. That is, initial hypotheses are generated, models are run, diagnostics are generated, hypotheses are tested, then additional hypotheses are generated, and the process repeat many times. The genetic algorithm implemented here capitalizes on the decreasing cost and increasing capabilities of computing power in recent years, while more fully addressing the issue of interactions between model components in the popPK/PD model search. While it proceeds autonomously, the genetic algorithm will never replace the expertise of an experienced user. The experienced user still needs to define biologically plausible model components and apply project specific criteria to selecting the most appropriate model. The work flow described suggests that all (human driven) hypothesis generation occurs prior to the GA run. Experience suggests that modeling using GA still requires cycling through iterations of hypothesis generation followed by hypothesis testing. However, many, many hypotheses can be tested autonomously, and diagnostics examined for only a small number of those. Thus, GA may typically be run perhaps two or three times, essentially batching hypotheses and permitting human evaluation and additional hypothesis generation much fewer times. By automating control stream text editing to generate new combinations of model features and initiating model runs, it will allow the user to spend less time on monotonous tasks and more time leveraging the model output information to generate additional hypotheses and to provide insight to the development of the drug.
The tumor growth profile model selected using the genetic algorithm had a substantially lower OFV than that identified using stepwise modeling.
The PK model identified by the GA was close (what were the actual characteristics) to the one used for the simulations. Importantly, while the GA selected the same number of compartments as the traditional and the “true” model, the estimates for Cl and central volume were quite different. It seems that this value is not well defined, as the OFV was different. Further exploration of this difference could be done by using the GA to search not only for the number of compartment etc., but also on different initial estimates. It is also noted that the GA had a parsimony penalty of 2 points, based on the AIC, where the traditional step wise had a penalty of 10 points. This difference in penalty could influence the final selection of covariates, with the stepwise approach (having the larger penalty per parameter) resulting in selection of more parsimonious models. The PK model identified by the stepwise user (0.05 forward and 0.01 reverse), resulted in a model that was quite different from the one used for the simulations, but with a lower objective function value than that discovered using the GA (with a 10 point per parameter penalty).
References
Sale M, Sherer EA (2015) A genetic algorithm based global search strategy for population pharmacokinetic/pharmacodynamic model selection. Br J Clin Pharmacol 79(1):28–39
Wade JR, Beal SL, Sambol NC (1994) Interaction between structural, statistical, and covariate models in population pharmacokinetic analysis. J Pharmacokinet Biopharm 22(2):165–177
Goldberg DE (1989) Genetic algorithms in search, optimization, and machine learning. Addison-Wesley Professional, Boston
Mitchell M (1996) An introduction to genetic algorithms. MIT Press, Cambridge
Jonsson EN, Wade JR, Karlsson MO (2000) Nonlinearity detection: advantages of nonlinear mixed-effects modeling. AAPS PharmSci 2(3):E32
Beal S, Sheiner LB, Boeckmann A, Bauer RJ (2009) NONMEM user’s guides (1989–2009). Icon Development Solutions, Ellicott City
Sherer EA, Sale ME, Pollock BG et al (2012) Application of a single-objective, hybrid genetic algorithm approach to pharmacokinetic model building. J Pharmacokinet Pharmacodyn 39(4):393–414
Akaike H (1998) Information theory and an extension of the maximum likelihood principle. In: Parzen E, Tanabe K, Kitagawa G (eds) Selected papers of Hirotugu Akaike. Springer series in statistics (perspectives in statistics). Springer, New York
Sharma P, Wadhwa A, Komal K (2014) Analysis of selection schemes for solving an optimization problem in genetic algorithm. Int J Comput Appl. https://doi.org/10.5120/16256-5714
Pillai N, Pflug B, Dai H, Bies R (2019) Population analysis of castrate resistant prostate cancer tumor trajectories with modulation of translocation protein function. Br J Clin Pharmacol 85(7):1633–1634
Pillai N Liu S, Ismail M, Pflug B, Sale M, Bies R (2019) Single objective genetic algorithm based approach for optimal population PK/PD model selection for tumor growth response. PAGE 28, Abstract 8878 [www.page-meeting.org/?abstract=8878]
Jonsson EN, Karlsson MO (1999) Xpose—an S-PLUS based population pharmacokinetic/pharmacodynamic model building aid for NONMEM. Comput Methods Programs Biomed 58(1):51–64
Lindbom L, Ribbing J, Jonsson EN (2004) Perl-speaks-NONMEM (PsN)—a Perl module for NONMEM related programming. Comput Methods Programs Biomed 75(2):85–94
Author information
Authors and Affiliations
Corresponding author
Additional information
Publisher's Note
Springer Nature remains neutral with regard to jurisdictional claims in published maps and institutional affiliations.
Supplementary Information
Below is the link to the electronic supplementary material.
Rights and permissions
About this article

Cite this article
Ismail, M., Sale, M., Yu, Y. et al. Development of a genetic algorithm and NONMEM workbench for automating and improving population pharmacokinetic/pharmacodynamic model selection. J Pharmacokinet Pharmacodyn 49, 243–256 (2022). https://doi.org/10.1007/s10928-021-09782-9
Received:
Accepted:
Published:
Issue Date:
DOI: https://doi.org/10.1007/s10928-021-09782-9