
Abstract
Cloud migration allows organizations to benefit from reduced operational costs, improved flexibility, and greater scalability, and enables them to focus on core business goals. However, it also has the flip side of reduced visibility. Enterprises considering migration of their IT systems to the cloud only have a black box view of the offered infrastructure. While information about server pricing and specification is publicly available, there is limited information about cloud infrastructure performance. Comparison of alternative cloud infrastructure offerings based only on price and server specification is difficult because cloud vendors use heterogeneous hardware resources, offer different server configurations, apply different pricing models and use different virtualization techniques to provision them. Benchmarking the performance of software systems deployed on the top of the black box cloud infrastructure offers one way to evaluate the performance of available cloud server alternatives. However, this process can be complex, time-consuming and expensive, and cloud consumers can greatly benefit from tools that can automate it. Smart CloudBench is a generic framework and system that offers automated, on-demand, real-time and customized benchmarking of software systems deployed on cloud infrastructure. It provides greater visibility and insight into the run-time behavior of cloud infrastructure, helping consumers to compare and contrast available offerings during the initial cloud selection phase, and monitor performance for service quality assurance during the subsequent cloud consumption phase. In this paper, we first discuss the rationale behind our approach for benchmarking the black box cloud infrastructure. Then, we propose a generic architecture for benchmarking representative applications on the heterogeneous cloud infrastructure and describe the Smart CloudBench benchmarking workflow. We also present simple use case scenarios that highlight the need for tools such as Smart CloudBench.
1 Introduction
In recent years there has been an exponential growth in the number of vendors offering Infrastructure-as-a-Service (IaaS), with a corresponding increase in the number of enterprises looking to migrate some or all of their IT systems to the cloud. The IaaS model typically involves the on-demand, over-the-internet provisioning of virtualized computing resources such as memory, storage, processing and network using a pay-as-you-go model. While IaaS consumers have the choice of operating system and deployed software stacks, they have no control over the underlying cloud infrastructure. IaaS vendors tend to use varying combinations of CPU, memory, storage and networking capacity to offer a variety of servers and use different virtualization techniques to provision them. As such, when consumers request and receive virtual machines from cloud providers, they perceive them as black-boxes whose run-time behavior is not known. Given this black-box view, the only way to objectively compare different types of cloud servers is by benchmarking the performance of software systems running on top of them.
One way of doing this is by deploying in-house software systems and applications on cloud infrastructure and carrying out rigorous performance tests against them to evaluate their performance under different conditions. However, this approach can be complex, time-consuming and expensive, and small and medium businesses may not possess the time, resources and in-house expertise to do a thorough and proactive evaluation in this manner. A more practical alternative is to benchmark representative applications Footnote 1 against representative workloads to estimate the performance of different types of applications when deployed on cloud infrastructure. The benchmarking results can then be used to estimate the performance on the different infrastructure offerings and to obtain valuable insights into the difference in performance across providers. By combining benchmarking results with server pricing and specifications, enterprises can objectively compare the alternative offerings from competing providers in the terms of performance and cost trade-offs. Benchmarking representative applications is useful even if the representativeness of the benchmark for a particular application domain is questionable, or customer workloads do not match the workloads represented by the benchmark, because the test results still enable more-informed comparison of cloud server offerings from different providers.
Smart CloudBench (Baruwal Chhetri et al. 2013a, b, 2014) is a provider-agnostic framework that assists prospective cloud consumers to directly evaluate and compare cloud infrastructure performance by running representative benchmark applications on them. It enables the evaluation of infrastructure performance in an efficient, quick and cost-effective manner, through the automated setup, execution and analysis of the benchmark applications on multiple IaaS clouds under customized workloads. Using Smart CloudBench, decision makers can make more informed decisions during the provider selection phase by evaluating available alternatives based on their price, specification and performance. Even after selecting a particular cloud provider and migrating in-house applications to the cloud, organizations can continue to use Smart CloudBench to benchmark the infrastructure performance on an on-going basis to ensure quality assurance. Benchmark tests conducted on public cloud infrastructure using Smart CloudBench show that higher prices do not necessarily translate to better or more consistent performance and highlight the need for tools such as Smart CloudBench to provide greater visibility into cloud infrastructure performance.
The key features of Smart CloudBench that differentiate it from other cloud evaluation tools include:
-
Direct comparison of cloud servers. Smart CloudBench enables the direct comparison of different cloud servers in an objective and consistent manner. This is made possible by deploying the exact same application stack on all cloud servers being tested. The application performance and the underlying resource consumption are then measured under custom workloads and the cloud infrastructure performance is estimated from the measured metrics.
-
Cost, effort and time efficiency. Since the cloud servers being benchmarked can be instantiated and terminated on-demand and in a fully automated manner, Smart CloudBench can help achieve significant time and cost savings. The provided support for scheduled testing also improves cost, effort and time efficiency and eliminates errors that can arise due to manual setup and execution of tests.
-
Greater insight into cloud performance. Smart CloudBench provides greater insight into cloud server performance by measuring both the benchmark application performance e.g., response time, throughput, and error rate, and the corresponding resource consumption e.g., CPU usage and memory usage. This can potentially help identify (a) over-provisioned and under-performing servers, (b) resource consumption patterns under different workloads, (c) resource constraints that could be affecting application performance, and (d) stability and reliability of cloud infrastructure.
-
Initial service selection and ongoing quality assurance. Smart CloudBench can assist cloud consumers with service selection during the initial migration stage when they are evaluating and comparing the IaaS offerings from competing providers, and with performance monitoring for service quality assurance during the subsequent cloud consumption phase. This is to ensure that the performance of the infrastructure offerings from the selected vendor does not deteriorate over time.
-
Generic and modular design. Smart CloudBench uses a generic and modular design which allows it to be easily extended to support new representative benchmark applications and to benchmark the performance of new cloud infrastructure.
2 Primer on benchmarking cloud infrastructure performance
Benchmarking is a traditional approach for verifying that the performance of an IT system meets the expected levels and to facilitate the informed procurement of computer systems. In the context of cloud infrastructure, the key objective of performance benchmarking is to compare the IaaS offerings from competing providers based on price and performance and to determine the price-performance tradeoffs. In this Section, we give a brief overview of performance benchmarking of cloud infrastructure.
2.1 Benchmarking elements
There are three key elements to any benchmarking process (a) System Under Test (SUT) which refers to the system whose performance is being evaluated, (b) workload, which refers to the operational load that the SUT is subjected to, and (c) Test Agent (TA), which is the test infrastructure used to carry out the benchmark tests (i.e., generate the workload). In the context of Smart CloudBench, SUT is the virtual cloud server whose performance we are interested in. From the user perspective, it is a black box, whose operational details are not exposed and the evaluation is based only on its output. TA can either be deployed on cloud infrastructure or on traditional hosts, although the cloud is perfectly suited to deliver scalable test tool environments which are necessary for the different types of performance tests.
2.2 Benchmark classification
There are two broad categories of benchmarks that can be used to test the performance of cloud infrastructure – micro benchmarks and macro benchmarks. Micro benchmarks focus on the performance of specific components of cloud infrastructure such as memory, cpu or disk. Examples include Geekbench, (http://www.primatelabs.com/geekbench/), IOzone (http://www.iozone.org), Iperf (http://iperf.sourceforge.net/), UnixBench (https://code.google.com/p/byte-unixbench/), Fio (http://freecode.com/projects/fio) and Sysbench (https://launchpad.net/sysbench). Macro benchmarks (or application stack benchmarks), are concerned with benchmarking the performance of a software system or application running on top of cloud infrastructure. While a set of micro benchmarks can offer a good starting point in evaluating performance of the basic components of cloud infrastructure, application stack benchmarking offers a better understanding of how a real-world application will perform when hosted on cloud infrastructure. Hence, from a cloud consumer perspective, macro benchmarking can provide greater visibility into the performance of cloud infrastructure.
Depending upon the type of application, macro benchmarks can be grouped into a number of different categories. Rightscale (Rightscale 2014), a leading cloud management platform provider has identified ten types of applications that are predominantly deployed on the cloud, which are (a) gaming, (b) social, (c) big data, (d) campaigns, (e) mobile, (f) batch, (g) internal web apps, (h) customer web apps, (i) development, and (j) testing of applications. If prospective consumers can find representative benchmarks corresponding to these types of applications, they can design experiments to match internal load levels and load variations, and then test the representative application on different cloud infrastructure to determine how they compare cost-wise and performance-wise. Examples of application benchmarks include TPC-W (TPCW 2003) which is a typical enterprise web application, DaCapo (http://www.dacapobench.org/) which is a Java benchmarking application, RUBIS (http://rubis.ow2.org/index.html) which is an auction site application modeled after eBay, RUBBos (http://jmob.ow2.org/rubbos.html/) which is an online news forum modeled after slashDot (http://slashdot.org/), and CloudSuite (http://parsa.epfl.ch/cloudsuite/cloudsuite.html) which is a benchmark suite for scale-out applications.
2.3 Performance characteristics
Performance is a key Quality of Service (QoS) attribute that is important to both consumers and providers of cloud services. It should not only be specified and captured in Service Level Agreements (SLA) but should also be tested in order to substitute assumptions with hard facts. In the context of cloud-based IT solutions and applications systems, and in particular web applications, the following performance characteristics are of particular interest to a prospective cloud consumer who intends to deploy client-facing web applications on the cloud.
-
Application Performance. At the application level, cloud consumers are interested in the time behaviour of the application running on cloud infrastructure i.e., response time, processing time and throughput rate of the software system when subjected to different workloads. They are also interested in determining the maximum limits of the software system parameters such as the maximum number of concurrent users that the system can support and the transaction throughput. Such information is necessary so that cloud consumers can guarantee their end-consumers appropriate QoS levels.
-
Resource Consumption At the infrastructure level, cloud consumers are interested to know the resource utilization levels when running a particular type of application under different workloads. Monitoring resource utilization can help to identify over-provisioned and under-performing resources. It can help to identify the resource consumption patterns under different workloads and determine the level of hardware utilization achievable while maintaining the application QoS requirements. It can potentially help to determine if resource limits are causing degradation in application performance and also help to evaluate the reliability of the cloud infrastructure provided by different cloud providers.
2.4 Performance tests
Performance testing is generally used to determine how a system performs in terms of responsiveness and stability under a particular workload. It can also serve to investigate other quality attributes such as scalability, reliability and resource usage. The most common types of performance testing are listed below:
-
Load Testing This test is the simplest form of performance testing. It is used to understand the performance of the SUT under specific expected workloads. An example workload could be the concurrent number of users performing a specific number of transactions on the application within a given duration.
-
Scalability Testing This test is used to determine how the SUT scales. In this test, the workload is gradually increased and the corresponding performance is measured. Using this test, one can determine the load level beyond which application performance degrades significantly.
-
Soak Testing This test is also known as endurance testing and is used to determine if the SUT can sustain continuous expected load without any major deviation in performance. It involves observing the system behavior while continuously testing it with the expected workload over a significant period of time.
-
Stress Testing This test is used to determine the upper boundaries of the SUT. An unusually heavy load is generated to determine if the system will perform sufficiently or break under extreme load conditions.
-
Spike Testing This test is used to determine how the system behaves when subjected to sudden spikes in the workload. The goal is to determine if the performance degrades significantly, or the system fails altogether.
3 Rationale behind smart CloudBench approach
In this section we explain our rationale behind the Smart CloudBench approach; we describe how we can estimate the run-time behavior of a black box cloud infrastructure using macro benchmarking and then explain how this information can be used to directly compare heterogeneous infrastructure from different cloud providers.
The Infrastructure as a Service (IaaS) model provides users with virtualized servers, storage and networking via a self-service interface. While the vendor manages the virtualization and the underlying hardware i.e., servers, storage and networking, the users have the flexibility to choose the operating system of their choice and manage the middleware, runtime and the software that runs on top of the OS. Thus, even though the different servers are not directly comparable at the infrastructure level where they appear as black boxes to the users, they are directly comparable at the software level where they are user-managed. Users can deploy the exact same benchmark application on cloud servers which are from different vendors, have different server configurations and have been provisioned using different virtualization techniques, and test them using the same workload conditions to estimate the performance of the underlying cloud infrastructure.
As shown in Fig. 1, the cloud servers from different cloud providers can be benchmarked using various representative applications to estimate the performance of the cloud infrastructure offerings. After measuring the benchmark application performance and the underlying resource consumption, the performance results can be combined with price and specification information to enable ranking of the available alternatives.

Infrastructure as a Service Provisioning Model
Figure 2 shows a concrete example of a representative benchmark used for evaluating the performance of cloud server offerings when hosting transactional web applications. Since the three different servers from Rackspace, Amazon EC2 and GoGrid are not directly comparable due to differences in their server specifications; the only way to make them comparable is by benchmarking the exact same application stack on top of virtual cloud servers that have the same base OS installed on them. These SUTs can then be subjected to the exact same workload conditions to measure the application performance and the underlying resource utilization. The application performance can be combined with the pricing and specification information to rank the three different servers according to user preferences.

Benchmarking Software Systems Running on Heterogeneous Infrastructure
4 Generic architecture of smart CloudBench
Smart CloudBench is a configurable, extensible and portable system for the automated performance benchmarking of cloud infrastructure using representative applications. It has a generic architecture that is based on the principles of black box performance testing. In addition, Smart CloudBench also enables the comparison and ranking of different cloud service offerings based on user requirements in terms of infrastructure specification, costs, application performance, geographic location and other requisite criteria (Baruwal Chhetri et al. 2013a, b, 2014). It can be used to run benchmark tests against public and private cloud infrastructure using complex workloads and to capture results with high statistical confidence. In this section we present the Smart CloudBench architecture. We also briefly describe our approach for bundling benchmark applications to enable on-demand deployment on cloud servers. We also briefly explain how we integrate resource consumption monitoring with application performance monitoring to provide greater visibility into cloud infrastructure performance. Figure 3 shows the key components of Smart CloudBench.

Core Components of Smart CloudBench
-
Benchmark Orchestrator (BO) - Benchmark Orchestrator is the main component of Smart CloudBench. It orchestrates the automated performance benchmarking of IaaS clouds. It controls the entire process of performance benchmarking including test scheduling, test execution, performance monitoring (Baruwal Chhetri et al. 2014) and result collection. It automates all the tasks that would be manually carried out in a traditional benchmarking exercise.
-
Cloud Manager (CM) – Cloud Manager performs fundamental cloud resource management. Instance Manager (IM) procures appropriate instances on the different providers - both for SUT and for TA based on the resource provisioning instructions from the BO. It is also responsible for decommissioning the instances at the end of each test. Virtual Machine Image (VMI) Manager is responsible for creating and maintaining virtual machine images on the different cloud providers. Common Cloud Interface (CCI) provides a common interface to different public cloud providers and enables the automated management of cloud instances including instantiation and termination.
-
Cloud Comparator (CC) – Cloud Comparator allows users to automatically compare the different cloud infrastructure offerings based on the cost and configuration of the benchmarked servers (stored in the server catalog) and the performance benchmarking results (stored in the benchmark results database). Report Generator generates test reports in different formats including graphical, tabular and textual formats for consumption by both technical and non-technical users. The Ranking System allows users to use different ranking and evaluation criteria to grade the cloud servers. Finally, the Visualizer component allows users to visualize the test results.
-
Database - The Smart CloudBench Database stores the following information:
-
Server Catalog – The Server Catalog maintains a list of supported cloud infrastructure providers and their offerings.
-
Benchmark Catalog – The Benchmark Catalog maintains a list of supported benchmarks for the different types of representative applications.
-
Benchmark Results - Performance benchmarking results are stored in the results database for short-term and long-term performance analysis.
-
Benchmark Scripts & Binaries - Smart CloudBench also maintains the scripts/binaries for each supported benchmark application to enable automated setup of the benchmark on the cloud virtual server.
-
-
Admin Interface - The admin interface allows the Smart CloudBench administrator to manage the cloud server catalog, and the benchmark catalog. Servers can be added or removed from the list of supported cloud servers. Similarly, new benchmark applications can be added to the benchmark catalog along with the corresponding binaries and associated setup scripts.
-
User Interface - Users can interact with Smart CloudBench via the user interface. Through this interface, testers can configure and run benchmark tests, view completed test results and also compare cloud servers based on their cost, specification and performance.
4.1 Bundling application benchmarks
In order to make the different cloud server types directly comparable, Smart CloudBench deploys the exact same application stack on all cloud servers (both the SUT and the TA). To do this, Smart CloudBench makes use of platform and cloud-agnostic software bundles in an approach similar to that described in (Oliveira et al. 2012). A domain expert codifies knowledge of a particular benchmark application in a software bundle which is then added by the Smart CloudBench administrator to the Benchmark Repository along with the corresponding Benchmark Installation Script. The Benchmark Catalog is also updated with the new entry. There are two key benefits of using software bundles:
-
The use of software bundles enables easy installation and setup of benchmark applications on any cloud platform making it easy to extend the Benchmark Catalog and the Cloud Server Catalog. It also minimizes human error during the setup of the SUT and TA servers.
-
It enables direct comparison of the application stack on top of two or more cloud servers built using different server configurations and different virtualization techniques by installing the exact same software stack on all servers.
Figure 2 shows an example software bundle for the TPC-W benchmark application (TPCW 2003) which is representative of a typical enterprise web application. The left-hand side of the image shows the typical software bundle for an enterprise application which comprises of the run time environment, the backend database, the application server and the web server. This software bundle has to be deployed on top of the base operating system that is running on the virtual cloud server which has the selected configuration in terms of CPU, RAM and storage. As can be seen at the right-hand side of Fig. 2, the concrete server specifications and the virtualization techniques can be different. However, each server can have the same base operating system and can have the exact same software bundle deployed on top of it, which makes the performance of the application stack on each cloud server directly comparable.
4.2 Multi-layer performance measurement
Smart CloudBench uses a lightweight, distributed monitoring solution which employs monitoring agents on both the SUT and the TA. The multi-layer monitoring used in Smart CloudBench is illustrated in Fig. 4. The Resource Monitor (RM) is deployed on the SUT and tracks resource consumption on it during the test period. Similarly, the Application Monitor (AM) is deployed on the TA and tracks the application performance. The monitoring solution used by Smart CloudBench is a provider-agnostic software-only solution which can be easily deployed on both public and private cloud infrastructure. Each time the SUT and the TA are launched, the RM and the AM agents are automatically deployed on them. At the end of a benchmarking test exercise, Smart CloudBench aggregates the application performance captured by the AM with the resource consumption captured by the RM and returns the aggregated results to the users for evaluation and analysis.

Smart CloudBench – Multi Layer Monitoring
Aggregating application performance with resource consumption can help identify (a) over-provisioned and under-performing resources, (b) resource issues that are affecting application performance, (c) resource consumption patterns under different workloads, and (d) determine the reliability of cloud infrastructure. More details about the monitoring solution implemented in Smart CloudBench are available in (Baruwal Chhetri et al. 2014)
5 Smart CloudBench workflow
In this Section, we explain how Smart CloudBench works. Figure 5 shows the steps involved in a typical benchmarking exercise using Smart CloudBench. The first three steps involve the user while Steps 4–10 are executed by Smart CloudBench. Step 11 again involves the user.

Smart CloudBench – Test Workflow
-
1.
Provider Selection - The user selects the cloud servers that are to be evaluated and compared. They can be provisioned by a single provider or by multiple cloud providers.
-
2.
Benchmark Selection - The user selects the representative benchmark application to be used to evaluate the performance of the selected cloud servers.
-
3.
Test Setup Specification - The user specifies the different scenarios to be used to evaluate the performance. This might include the workload, the test duration and the interval between subsequent test runs.
-
4.
Instance Procurement - Smart CloudBench procures the required cloud servers on the selected cloud providers. If on-demand setup and configuration of benchmark applications is supported, Smart CloudBench chooses default machine images. If not, pre-built custom images containing the packaged benchmark application and the workload generator are used to instantiate the SUT and TA.
-
Benchmark Setup & Configuration - If on-demand setup and configuration of benchmark applications is supported through the use of automated execution of post-bootup scripts, Smart CloudBench sets up and configures the selected benchmark application on the cloud server.
-
-
5.
Monitoring Commencement - Smart CloudBench issues remote call to the Resource Monitor on the SUT to commence monitoring of resource consumption on it.
-
6.
Benchmark Execution - Smart CloudBench executes the benchmark by issuing remote calls to the test agents running on TA and waits for the test results.
-
7.
Monitoring Completion - Smart CloudBench issues remote call to the Resource Monitor to cease monitoring of resource consumption and retrieves the resource consumption data.
-
8.
Result Aggregation - Smart CloudBench aggregates the application performance metrics with the infrastructure performance metrics and stores the results in the Results DB for evaluation and analysis by user.
-
9.
Instance Decommissioning - Smart CloudBench decommissions the cloud servers at the end of the benchmark tests.
-
10.
Evaluation & Analysis - The user evaluates and analyses the test results to compare the tested cloud servers.
6 Use case scenarios
In this Section, we first briefly describe the TPC-W benchmark application that we use as the representative benchmark application in our tests. The source code for the benchmark application is available online at http://www.cs.virginia.edu/th8k/downloads/. We then present two different use case scenarios to illustrate how Smart CloudBench can be used to evaluate and compare cloud server offerings. We first describe some test scenarios on Google Compute Engine (GCE) as the candidate cloud infrastructure provider, where we run tests using Smart CloudBench on three different types of cloud servers (see Table 1). We then describe a second set of test scenarios that we have conducted on cloud infrastructure procured from the Deutsche Borse Cloud Exchange Marketplace (http://www.dbcloudexchange.com/en/). We run tests on three cloud servers with exactly the same server specification but provisioned by different vendors and at three different prices.
6.1 TPC-W benchmark application
We have used the TPC-W benchmark application (TPCW 2003) as our representative benchmark application. It simulates an online book store which represents the most popular type of application running on the cloud. It has a relatively simple and well understood behaviour. It includes a web server to render web pages, an application server to execute business logic, and a database to store application data. It is designed to test the complete application stack and does not make any assumptions about the technologies and software systems used in each layer. The benchmark consists of two parts. The first part is the application itself, which is deployed on the SUT and supports a mix of 14 different types of web interactions and three workload mixes, including searching for products, shopping for products and ordering products. The second part is the remote browser emulation (RBE) system which is deployed on the TA and generates the workload to test the application. The RBE simulates the same HTTP network traffic as would be seen by a real customer using the browser.
6.2 Use-case scenario 1: Google compute engine
In our first scenario, we selected Google Compute Engine as the candidate cloud providers for experimental evaluation. Three different types of servers, namely standard, high memory, and high CPU were used to instantiate the SUT servers. High memory instances were used to host the Test Agents (TA) in all three cases. Both the SUT and TA servers used Debian distribution of Linux and were hosted in the US data centre (us-central-1a). The pricing and specification details of the selected cloud servers are provided in Table 1. Table 2 shows the different application and infrastructure level performance metrics collected during the tests.
6.2.1 Test scenarios
We carried out three different performance tests on Google Compute Engine using Smart CloudBench over a period of three days from 28/01/2014 to 30/01/2014. The tests are presented below in the order of execution.
-
Scalability Test - The objective of this test was to determine the maximum workload that could be handled by the selected server types while maintaining acceptable performance characteristics. We used Apdex or Application Performance Index (see Table 3) to establish an acceptable performance limit. We set the apdex at 0.5 as the threshold and ran multiple tests starting at an initial load of 50 concurrent clients and increased the workload by 50 in each round. The benchmarking exercise was terminated when Apdex < 0.5, meaning that there were more unsatisfied users than satisfied users.
Table 3 Application performance index -
Soak Test - The objective of this test was to analyze the consistency of the three cloud servers’ performance overtime. We continuously ran tests using the same workload over a 24 h period on 29/01/2014. The workload selected for each SUT was the maximum workload determined in the scalability test.
-
Reliability Test - The objective of this test was to determine the reliability of the cloud provider. We launched three servers of the same type and subjected them to a sustained workload over a period of 24 h on 30/01/2014. Given that the configuration of the three servers is the same, one would expect the performance to be the same or similar but the results show otherwise.
7 Discussion of results
In this section, we present the results obtained from the different types of tests and discuss their significance.
-
Scalability Test - The results of the scalability test are presented in Fig. 6. We plot graphs for apdex, maximum CPU and RAM utilization. The key observations are:
-
The HighCPU and HighMem instances could not maintain acceptable apdex above 850 clients, while the Standard server reached up to 1150 clients while maintaining acceptable performance (Fig. 6a).
-
CPU was a bottleneck for all three servers peaking at 100 % and affecting the application performance (Fig. 6b). All three servers have the same amount of CPU Cores.
-
HighCPU instance used up practically all the available RAM, HighMem instance used only around 20 % of RAM while Standard instance used around 40 % (Fig. 6c). All three instances have different amounts of RAM.
-
Standard instance happened to perform the best in this test even though it has lesser resources than the HighMem instance and is cheaper. We do not have a definitive explanation for this behaviour, other than it may be due to CPU bursting. CPU bursting allows instances to opportunistically take advantage of available physical CPUs in bursts. Since our resource consumption model only measures the percentage of CPU consumption, we cannot confirm this.
Fig. 6 
Scalability Test Graphs
-
-
Soak Test - The results of the soak test are presented in Fig. 7. We plot graphs for average response time, the average CPU and RAM utilization over a duration of 8 h, and the box plot for the response time across all test runs for all three servers. The key observations are:
-
The average CPU utilization gradually decreased (Fig. 7b), while average RAM utilization increased over the duration of the test (Fig. 7c). The increased utilization of RAM is linked with the caching of requests. We suppose that the reduced CPU utilization is also linked with it (CPU caching).
-
HighCPU server had the most stable performance among all three selected instance types.
-
HighMem server was the least stable instance even though it is the most expensive one among the three.
Fig. 7 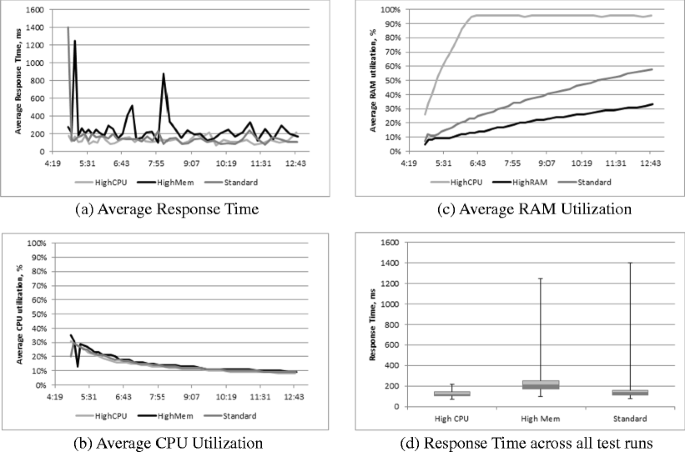
Soak Test Results (with load of 800 clients)
-
-
Reliability Test - The results of the reliability test are presented in Fig. 8. In this test, we selected three servers of the Standard type. All three servers were launched on the same subnet, and possibly operated on the same physical node. As the three servers have the same configuration are from the same provider, the corresponding performance was expected to be very similar. However, we can see that the server performance was variable overtime (Fig. 8a). We plot the results over a period of 12 h. The key observations are:
-
Instance #1 had long term performance degradation, which resulted in the server crashing at around 8:00 AM.
-
Instance #2 exhibited relatively consistent application and infrastructure performance.
-
Instance #3 exhibited a sudden degradation in performance around 5:30 AM in the average response time
-
The application performance decreased in all three servers (to a different extent) at the same time, at around 5:30 AM.
-
There is a similar performance pattern for the average CPU and RAM utilization across all 3 servers. Initially, the utilization of RAM gradually increased, while the requests were being cached on the server. After that, RAM utilization remained at the same level at around 70 % (Fig. 8c). Average CPU utilization was relatively stable overtime (Fig. 8b).
Fig. 8 
Reliability Test Results (with 800 clients)
-


These simple examples highlight two points. Firstly, they are illustrative of the different types of tests that can be defined using Smart CloudBench to measure the consistency and reliability of cloud infrastructure providers. By running the same workloads on multiple instances of the same server, at the same time and in the same region, we can get an estimation of the consistency and reliability of the cloud service provider. Similarly, by running the same workloads across different server instances, we can get an estimation of the performance of the different servers as well. Secondly, they also highlight the variability in cloud infrastructure performance and the need for benchmarking tools such as Smart CloudBench.
7.1 Use-case scenario 2: Deutsche borse cloud exchange marketplace
Deutsche Borse Cloud Exchange (DBCE) (http://www.dbcloudexchange.com) is an open marketplace for cloud resources, where multiple cloud resource vendors can join and exchange infrastructure cloud services with other market participants. Currently DBCE is in a beta trial stage with early participants (cloud providers and cloud consumers) participating in the trials. We have selected three different cloud providers available through DBCE for our evaluation of Smart CloudBench that we shall name A, B and C. We have used standard medium servers with Ubuntu 14.4 as the SUT for all three providers. For each provider, we had two SUT-TA pairs set up for testing. In the first instance, we co-located the SUT and TA VMs within the cloud provider’s network. In the second instance, we setup the TA on a m1.medium server on the Nectar Research Cloud (https://www.nectar.org.au/research-cloud) located in the Tasmanian data center. The pricing and specification details of the selected SUT cloud servers are provided in Table 4. The Nectar Infrastructure is freely available for research use. Table 5 shows the different application and infrastructure level performance metrics collected during the tests.
7.1.1 Test scenarios
We carried out the reliability test on the three standard-medium servers from the three selected vendors. The objective of this test was to determine the reliability and consistency of performance on the cloud servers with identical server specifications provisioned by different cloud vendors. We launched two SUT servers on each provider and subjected them to a sustained workload of 500 concurrent users trying to access the application over a period of 96 h between the period 19/01/2015 – 27/01/2015. Given that the configuration of the three servers is the same, one would expect the performance to be the same or similar but the results show otherwise.
7.1.2 Discussion of results
-
We can see that although the three servers had the same configurations, their performance in the conducted experiments was different.
-
The server provisioned by Provider B cloud showed worst performance with increasing deviation in response time, while the other two servers had a very low and consistent response time (Fig. 9)
Fig. 9 
Scenario 1: Response Time over time across three cloud servers with same configuration (local TA)
-
It terms of CPU utilization, we can see different levels of CPU usage across all three servers (Fig. 10), even though the generated workload was the same. It means that while the publicly available server configurations are the same, the actual physical infrastructure has a different level of performance.
Fig. 10 
Scenario 1: CPU Utilization over time across three cloud servers with same configuration (local TA)
-
When the TA is located on a remote geographical location, the response time across all three servers increases due to the network delay (Fig. 11). However, the cloud server from Provider B shows consistently higher response time.
Fig. 11 
Scenario 2: Response Time over time across three cloud servers with same configuration (remote TA)
-
The CPU usage data (Fig. 12), which is identical to the case of local TA, confirms that the degraded response time is not due to the internal servers’ performance, but rather due to an external factor, such as network delay.
Fig. 12 
Scenario 2: CPU Utilization over time across three cloud servers with same configuration (remote TA)
-
The graph in Fig. 13 illustrates the variations in performance of the three servers. The servers showed consistent comparative performance in both scenarios. The most reliable results were demonstrated by the server from Provider A. The server from Provider C showed a very similar result to that of Provider A with slightly higher deviation whereas Provider C had the highest performance deviation.
Fig. 13 
Consistency of performance across providers in two different scenarios


8 Related work
There has been significant research activity on the measurement and characterization of cloud infrastructure performance to enable decision support for provider and resource selection.
In (Li et al. 2010), the authors present CloudCmp, a framework to compare cloud providers based on the performance of the various components of the infrastructure including computation, scaling, storage and network connectivity. The same authors present the CloudProphet tool (Li et al. 2011) to predict the end-to-end response time of an on-premise web application when migrated to the cloud. The tool records the resource usage trace of the application running on-premise and then replays it on the cloud to predict performance. In (Ferdman et al., 2012), the authors present CloudSuite, a benchmark suite for emerging scale-out workloads. While most work on cloud performance looks at the performance bottlenecks at the application level, this work focusses on analyzing the micro-architecture of the processors used.
In (Luo et al. 2012), the authors propose CloudRank-D, a benchmark suite for benchmarking and ranking the performance of cloud computing systems hosting big data applications. The main difference between CloudRank-D and our work is that CloudRank-D specifically targets big-data applications while our framework applies to any application. In (Gmach et al. 2012), the authors present their results on the analysis of resource usage from the service provider and service consumer perspectives. They study two models for resource sharing - the t-shirt model and the time-sharing model. While we look at the performance of the different cloud providers from a cloud consumer’s perspective, the resource usage results can be included as part of the benchmarking results to highlight the resource usage under different load conditions. The resource usage levels could also potentially affect the resource and provider selection process.
In (Lenk et al. 2011), the authors propose a methodology and process to implement custom tailored benchmarks for testing different cloud providers. Using this methodology, any enterprise looking to examine the different cloud service offerings can manually go through the process of selecting providers, selecting and implementing (if necessary) a benchmark application, deploying it on multiple cloud resources, performing the tests and recording the results. Evaluation is done at the end of the tests. Our work differs in that it offers prospective cloud consumers with a service to do all of this without having to go through the entire process of setup. Additionally, it gives users the flexibility to try out different what-if scenarios to get additional information about the performance.
In (Iosup et al. 2013), the authors discuss the IaaS cloud-specific elements of benchmarking from the user’s perspective. They propose a generic approach for IaaS cloud benchmarking which supports rapidly changing black box systems, where resource and job management is provided by the testing infrastructure and tests can be conducted with complex workloads. Their tool SkyMark provides support for micro performance benchmarking in the context of multi-job workloads based on the MapReduce model. In (Folkerts et al. 2013), the authors provide a theoretical discussion on what cloud benchmarking should, can and cannot be. They identify the actors involved in cloud benchmarking and analyze a number of use cases where benchmarking can play a significant role. They also identify the challenges of building scenario-specific benchmarks and propose some solutions to address them.
In (Zhao et al. 2010), the authors present the Cloud Architecture Runtime Evaluation (CARE) framework for evaluating cloud application development and runtime platforms. Their framework includes a number of pre-build, pre-configured and reconfigurable components for conducting performance evaluations across different target platforms. The key difference between CARE and our work is that while CARE looks at micro performance benchmarking, Smart CloudBench looks at performance benchmarking across the complete application stack.
There are a number of commercial tools that provide support for cloud performance benchmarking. Some of them focus on micro benchmarking while others focus on macro (or application) benchmarking. CloudHarmony (http://www.cloudharmony.com/) provides an extensive database of benchmark results across a number of public cloud providers using a wide range of benchmark applications. Cloud Spectator (http://cloudspectator.com/) carries out periodic benchmarking and publishes the results in reports which can be purchased. ServerBear (http://serverbear.com/) performs micro benchmarking and provides customised reports against selected providers for a fee. There are numerous commercial cloud monitoring tools. Some of them are cloud dependant such as Amazon CloudWatch (http://aws.amazon.com/cloudwatch/), while others are cloud independent such as Monitis (http://www.monitis.com/), LogicMonitor (http://www.logicmonitor.com/), CopperEgg (http://copperegg.com/) and Nagios (http://www.nagios.org/). Some of them only monitor specific layers of the cloud e.g., CloudHarmony and OpenNebula (http://opennebula.org/), while others monitor across cloud layers including infrastructure, platform and software. Monitis offers a cloud monitoring solution which allows monitoring virtual server instances across providers from a unified dashboard. CopperEgg, Nimsoft (http://www.ca.com/us/opscenter/ca-nimsoft-monitor.aspx) and LogicMonitor are cloud monitoring tools that offer monitoring across cloud layers. Cedexis (http://www.cedexis.com/) offers tools for the real time monitoring of response times to over 100 cloud providers and Global Delivery Networks.
The following features differentiate Smart CloudBench from other cloud performance benchmarking tools.
-
Real-time benchmarking - Smart CloudBench allows users to conduct live, real-time benchmarking of selected cloud providers and servers.
-
Customized workloads - users are not restricted to predefined workloads but can instead specify workloads that are representative of their own in-house workloads making the benchmark results more meaningful and relevant.
-
Performance base lining - users can baseline the performance of cloud servers against a wide range of workloads. This helps them select the cloud instance that best meets the performance criteria.
-
Monitoring across cloud layers - Smart CloudBench monitors both the application performance as well as the underlying infrastructure performance. The aggregated results give greater insight into how different benchmark applications perform on cloud infrastructure.
9 Conclusion
In order to confidently migrate in-house systems to the cloud, prospective cloud consumers need to have sufficient trust in the cloud service offerings. While the cloud infrastructure pricing and specification is publicly available information, their run-time behaviour is unknown. The use of different virtualization technologies by cloud providers and multi-tenancy used by cloud infrastructure can impact the performance of software systems running on them. The only way to get a concrete measure of cloud infrastructure performance is by benchmarking software systems running on top of the cloud infrastructure rather than relying on assumptions based on its price and specification. Performance benchmarking of cloud infrastructure can help prospective cloud consumers, both in the initial cloud selection phase and the subsequent cloud consumption phase. During the cloud selection phase, the prospective cloud consumers can obtain a quick assessment of the price, specification and performance of shortlisted cloud infrastructure providers by running short-term performance tests. Once they have selected a particular cloud service provider and migrated in-house applications to the cloud, they may continue to periodically benchmark the cloud providers to ensure that there is no degradation in the service quality over time. They may also do periodic benchmarking of cloud infrastructure from different cloud providers to get a better insight into the long-term evolution of the service providers.
In this paper, we have presented Smart CloudBench that automates the execution of representative benchmarks on different IaaS clouds under user-tailored representative load conditions to help estimate their performance levels. The users of Smart CloudBench can design different types of experiments to test the performance of representative applications using load conditions that match the load levels of their own in-house applications. Smart CloudBench is particularly useful for organizations that do not possess the time, resources and in-house expertise to do a thorough evaluation of multiple cloud platforms using in-house applications. Two representative sets of test results obtained for commercial cloud infrastructure using Smart CloudBench show that higher price does not necessarily translate to better or more consistent performance and that two cloud servers with exactly the same server specification can exhibit significantly different performance. Such results highlight the need for benchmarking cloud infrastructure performance, and the need for tools such as Smart CloudBench.
Notes
Some example representative applications include TPC-W for a transactional e-commerce web application (TPCW 2003) and Media Streaming benchmark application for media streaming applications such as Netflix or Yuku (Ferdman et.al. 2012)
References
Baruwal Chhetri, M, Chichin, S., Bao Vo, Q., & Kowalczyk, R. (2013a). Smart Cloud Broker: Finding your home in the clouds. In Automated Software Engineering (ASE), 2013 IEEE/ACM 28th International Conference on (pp. 698–701). IEEE.
Baruwal Chhetri, M., Chichin, S., Vo, Q. B., & Kowalczyk, R. (2013b). Smart CloudBench-- Automated Performance Benchmarking of the Cloud. In Cloud Computing (CLOUD), 2013 I.E. Sixth International Conference on (pp. 414–421). IEEE.
Baruwal Chhetri, M., Chichin, S., Vo, Q.B., & Kowalczyk, R. (2014). Smart CloudMonitor-Providing Visibility into Performance of Black-Box Clouds. In Cloud Computing (CLOUD), 2014 I.E. 7th International Conference on (pp. 777–784). IEEE.
Ferdman, M., Adileh, A., Kocberber, O., Volos, S., Alisafaee, M., Jevdjic, D., & Falsafi, B. (2012). Clearing the clouds: a study of emerging scale-out workloads on modern hardware. In ACM SIGARCH Computer Architecture News (Vol. 40, No. 1, pp. 37–48). ACM.
Folkerts, E., Alexandrov, A., Sachs, K., Iosup, A., Markl, V., & Tosun, C. (2013). Benchmarking in the cloud: What it should, can, and cannot be. In Selected Topics in Performance Evaluation and Benchmarking (pp. 173–188). Springer Berlin Heidelberg.
Gmach, D., Rolia, J., & Cherkasova, L. (2012, April). Comparing efficiency and costs of cloud computing models. In Network Operations and Management Symposium (NOMS), 2012 I.E. (pp. 647–650). IEEE.
Iosup, A., Prodan, R., & Epema, D. (2013, May). IaaS cloud benchmarking: approaches, challenges, and experience. In HotTopiCS (pp. 1–2).
Lenk, A., Menzel, M., Lipsky, J., Tai, S., & Offermann, P. (2011). What are you paying for? performance benchmarking for infrastructure-as-a-service offerings. In Cloud Computing (CLOUD), 2011 I.E. International Conference on (pp. 484–491). IEEE.
Li, A, Yang, X., Kandula, S. and Zhang, M. (2010) CloudCmp: comparing public cloud providers. In Proceedings of the 10th Annual Conference on Internet Measurement.
Li, A., Yang, X., Kandula, S., Yang, X. and Zhang, M. (2011) CloudProphet: towards application performance prediction in cloud. In ACM SIGCOMM Computer Communication Review (Vol. 41, No. 4, pp. 426–427). ACM.
Luo, C., Zhan, J., Jia, Z., Wang, L., Lu, G., Zhang, L., & Sun, N. (2012). Cloudrank-d: benchmarking and ranking cloud computing systems for data processing applications. Frontiers of Computer Science, 6(4), 347–362.
Nielsen J. (1994). Usability Engineering. Elsevier.
Oliveira, F., Eilam, T., Kalantar, M., & Rosenberg, F. (2012). Semantically-Rich Composition of Virtual Images. In Cloud Computing (CLOUD), 2012 I.E. 5th International Conference on (pp. 277–284). IEEE.
RightScale (n.d) 2014 State of the Cloud Report. Retrieved from http://assets.rightscale.com/uploads/pdfs/RightScale-2014-State-of-the-Cloud-Report.pdf
Zhao, L., Liu, A., & Keung, J. (2010). Evaluating cloud platform architecture with the care framework. In Software Engineering Conference (APSEC), 2010 17th Asia Pacific (pp. 60–69). IEEE.
Author information
Authors and Affiliations
Corresponding author
Rights and permissions
About this article

Cite this article
Baruwal Chhetri, M., Chichin, S., Vo, Q.B. et al. Smart CloudBench—A framework for evaluating cloud infrastructure performance. Inf Syst Front 18, 413–428 (2016). https://doi.org/10.1007/s10796-015-9557-2
Published:
Issue Date:
DOI: https://doi.org/10.1007/s10796-015-9557-2