
Abstract
Many fire disasters have occurred on the thermoplastic expanded polystyrene (EPS) external thermal insulation composite systems (ETICS) installed vertically on the building facade. Thus, it is important to understand the reaction-to-fire performance of EPS ETICS and the effect of sample scale, orientation, and masonry cover in fire tests. In this work, both specimens of EPS alone and EPS ETICS with masonry cover are tested under three different scales, (1) 0.01-m2 small-scale cone calorimeter test (ISO 5660-1), (2) 1-m2 intermediate-scale test (ISO 14696), and (3) 7-m2 larger-scale test (JIS A 1310). Results show that the impact of sample orientation is important, because the heated vertical EPS can melt and flow away without ignition, and the masonry cover limits the flow of EPS melts. The peak heat release rate per unit area (pHRRPUA) in the small-scale test doubles that of the large-scale facade test with a vertical flame spread, so that it cannot be simply scaled up. Moreover, the masonry cover on the EPS ETICS can significantly reduce the burning rate and HRR by a factor of 50%, and it is effective from small-scale to large-scale fires. The embedded rock-wool fire barrier inside the EPS ETICS can significantly reduce the vertical flame-spread rate and HRR. This work helps understand the scale-effect of facade fire test and quantifies the effect of masonry cover on lowering facade fire hazards.
Graphic Abstract

1 Introduction
The External Thermal Insulation Composite System (ETICS) has been used in buildings for decades due to its thermal advantages, low cost, and ease of installation [1]. The principal design of an ETICS includes wall construction, insulation material, cement bound mortar (or the masonry cover) with reinforcement, rendering, and fixation by dowels and mortar [2]. The expanded polystyrene (EPS) is one of the common thermal insulation thermoplastic materials used on external walls of buildings [3].
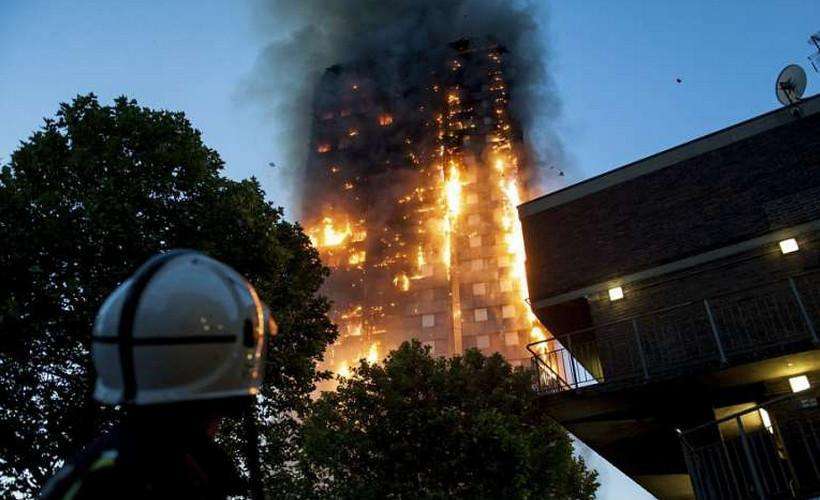
Like the high fire risk in the aluminum composite facade, such as the Grenfell Tower fire [4, 5], many fire accidents have also occurred in the EPS ETICS facade and cause significant casualties and economic losses. The 2010 EPS ETICS fire in Dijon, France, caused seven deaths and 130 people injured from toxic smoke (Fig. 1a). Multiple fire accidents of the EPS ETICS facade have also occurred recently in China. For example, the Shenyang fire in 2011 (Fig. 1b) was ignited by the hot metal particles from an illegal firework display, and eventually, the facade fire spread into the building and caused significant damage, despite no casualty. Another more recent facade fire at Chongqing, China, in 2020 (Fig. 1c) was ignited by the spilled flame from the balcony of the 2nd floor, and the flame spread upward to the 30th floor within just a few minutes. In most fire events of the EPS ETIC facade, the flame spread over the entire building quickly within just a few minutes.

Typical EPS ETICS facade accidents, a Dijon fire, France in 2010 https://www.bbc.com/news/world-europe-11752303, b Shenyang fire, China in 2011 http://news.sina.com.cn/c/2011-02-08/153321924087.shtml, and c Chongqing fire, China in 2020 http://cmszfb.oss-cn-beijing.aliyuncs.com/u/cms/www/202001/02143433gso9.jpg
It is well known that the EPS and its foam are quite flammable, and it has a low limiting oxygen index (LOI) of 18% that can be easily ignited by the flame and hot metal particles [6,7,8]. The EPS foam can be easily ignited by a flame or hot particles [7, 8]. Decorative moldings made of EPS are reported to bring significant safety and health risks, releasing a large amount of toxic pyrolysis gases and combustion smoke [9]. When EPS is exposed to heat, a melt-flow or melt-drip process consisting of EPS melting, dripping flowing, and pool fire of melts will first take place [10, 11]. By adding non-combustible surface layers like a masonry cover for EPS can reduce the impact of fire and slow down the flame spread, so that some multi-layer EPS ETICS can pass some standard facade fire tests. Nevertheless, in real facade fires, even with the masonry cover, the flame spread over the EPS ETICS is still fast (Fig. 1). Today, the measurements of fire-spread and heat release rate (HRR) of high-cost large-scale EPS facades [12,13,14,15,16,17,18,19,20,21,22,23] are still limited, so our understanding of EPS facade fire risk and phenomena is still relatively limited.
In the literature, there have been many small-scale and intermediate-scale tests on the EPS foam samples [24,25,26,27,28]. However, whether the reduced-scale fire tests data, such as the fuel-burning flux and heat release rate per unit area (HRRPUA), can be scaled up by the size of fuel is still unclear, considering that scaling up fire tests plays a critical role in understanding the realistic large fire events [29]. Also, the EPS is widely used in the vertical direction as insulation with finishing masonry coating in the facade so that their fire behaviors will be different from horizontal samples and the pure EPS facades. The fire dynamics of the whole EPS ETICS has been studied in limited tests, including the fire spread rate [17,18,19,20,21, 23], fire rescue analysis [30], fire barrier influence on the fire performance [31], post-fire evaluation methods [20] and so on. Although it is clear that the vertical EPS exhibits a complex reaction-to-fire performance because of its tendency to melt and flow, little knowledge is available for the EPS melt-flow process and the scale effect on the EPS facade fire HRR.
In this work, both specimens of EPS and EPS ETICS (with masonry cover) are tested under three different scales, (1) 0.01-m2 small-scale cone calorimeter test, (2) 1-m2 intermediate-scale test, and (3) 7-m2 larger-scale tests. The ignition, flame spread, and HRR of fire tests of different scales are analyzed to understand the effect of fire scale and masonry cover.
2 Experiment and Method
2.1 EPS and EPS ECTIS Samples
Figure 2a shows the EPS ETICS sample consisting of polymer cement mortar (PCM), cement mortar (CM), and EPS foam from the surface to the internal, same as past studies [15, 23]. The PCM had 6% styrene-butadiene rubber (SBR) which was combustible. For all samples, the thicknesses of PCM and CM were 2 mm and 1 mm, respectively. The specimen was made by Nohara Co. Ltd., Japan, according to the JIS A 1310 standard method. The density of EPS foam was 15 kg/m3, and its thickness varied from 50 to 200 mm.

(a) Small-scale EPS ETICS sample with the masonry cover, (b) small-scale (0.01-m2) cone-calorimeter test, (c) intermediate-scale (1-m2) fire test, and (d) large-scale (7-m2) facade system fire test
The viscosity of molten EPS as a function of temperature was measured by a viscoelastic spectrometer (ToyoSeiki Seisaku-sho), and the results are shown in the Appendix (Fig. 10). In general, the viscosity of molten EPS drops rapidly at about 200 °C and becomes very small above 350 °C. The pyrolysis products of PCM and EPS were measured by the TDS1200II (Thermal desorption spectroscopy) with a quadrupole mass spectrometer [18]. Results in Fig. 11 of the Appendix show that the major pyrolysis gases from EPS are ethylene and propane above 350 °C.
2.2 Small-Scale (0.01-m2) Cone Calorimeter Tests
The cone calorimeter (ISO 5660-1 standard) is the most widely used device to measure the ignitability and the fire heat release rate (HRR) of bench-scale material [32]. With a cone calorimeter, the EPS and EPS ETICS samples were mounted horizontally and vertically by using a specimen frame under the hood (Fig. 2b). The bottom of the holder was lined with a ceramic fiber blanket, and the surroundings were wrapped with a 0.02-mm thin aluminum foil. To fit into the frame, the specimen was directly cut from an EPS ETICS sample, so it had a masonry cover. The sample size was fixed to a cross-section of 94 mm × 94 mm (about 0.01 m2) and a thickness of 53 mm (50-mm EPS + 1-mm CM + 2-mm PCM). The HRR was measured by the principle of oxygen calorimetry and by measuring the dried exhaust gas. Once heated, the EPS would melt and shrink into a thin molten layer and eventually burn like a pool fire; thus, thicker 100-mm and 200-mm EPS samples were not tested.
Thus, the heat flux in the small-scale cone test was fixed to 30 kW/m2, where the temperature of the cone heater was 655 °C. The value of 30 kW/m2 was chosen because the peak heat flux on the inert façade 50 cm above the opening was about 30 ± 5 kW/m2, when the internal HRR was below 800 kW. The spark was placed at the top of vertical specimens and over the center of horizontal specimens, as well as at 5 mm above the surface of PCM. The ambient temperature is 20.3 °C, the barometric pressure is 1.01 bar, and the relative humidity is 19%. Each test condition was repeated three times to reduce the random uncertainty.
2.3 Intermediate-Scale (1-m2) Facade Sample Test
To scale up the fire, the vertical intermediate-scale (1-m2) facade sample was tested under the ISO 14696 standard of the intermediate scale calorimeter (ICAL) [33]. The dimension of the square facade sample was 1.0 m × 1.0 m, the thickness of EPS ETICS was 53 mm (50-mm EPS + 2-mm PCM + 1-mm CM). As illustrated in Fig. 2c, the fire HRRs of the EPS and EPS ETICS panels were measured under the same principle of oxygen calorimetry. The sampled exhaust gas was dried before the oxygen concentration was measured. The setup consisted of radiant panel assembly in a vertical orientation, radiant panel constant irradiance controller, water-cooled heat shield, specimen holder, weighing platform, exhaust collection system, gas flow meter, and data acquisition system. The specimen is exposed to a uniform and constant heat flux from a gas-fired radiant panel up to 50 kW/m2. The radiant heat flux was measured by heat flux gauge on the sample and adjusted by the distance between radiant panel and sample. Two hot electrical wires were used as the pilot sources. One hot wire was on the top and the other was on the bottom, both of which were placed 5 mm in front of the vertical sample surface. To ensure a `fair comparison with the small-scale test, the heat flux of 30 kW/m2 (same as the small-scale cone-calorimeter tests) was applied for the piloted ignition and HRR measurement.
2.4 Large-Scale (7-m2) Facade System Test
The large-scale facade fire test with a sample size of about 7-m2 was conducted under the JIS A 1310 standard [14, 34]. The original size of the EPS facade sample was 4.10 m × 1.82 m (7.5 m2), and two thicknesses (100 and 200 mm) were examined. Excluding the opening to the fire chamber, the EPS fuel size was about 6.6 m2, as illustrated in Fig. 2d. The large-scale test facility consisted of a cubic chamber with a length of 1,350 mm, a square opening with a length of 910 mm, a square gas burner with a length of 600 mm, specimen substrate, and a specimen support frame. Chamber was used to produce different chamber (or compartment) fire HRRs, which were controlled by the flow rate of propane. The interior surface of the chamber was coated by a 25-mm thick ceramic fiber blanket. The specimen substrate was made by laying two pieces of 12 mm thickness calcium silicate board, and the joint of the first layer was not overlapped with the joint of the second layer. The specimen support frame was made of stainless steel and employed to support the specimen and its substrate.
The K-type thermocouples were used to measure the temperature on the surface of the facade specimen in the height of 0 m (T0), 0.50 m (T1), 0.90 m (T2), 1.50 m (T3), 2.00 m (T4), and 2.50 m (T5) above the upper edge of the opening, respectively. The incident heat flux varying test time was recorded by a series of water-cool heat flux meters, which were placed 2 m away from the facade surface. Moreover, the surface heat-flux profile on the inert facade was also measured as the baseline case. The value of HRR was also measured by oxygen calorimetry, and the total heat release (THR) was calculated. Before the large-scale fire test, a 4-L alcohol compartment fire (with a 25-mm inert ceramic fiber facade) was used to calibrate the whole test setup and all sensors. Then chamber heating intensity in kW was determined by controlling the mass flow of high purity propane.
3 Results and Discussion
3.1 Small-Scale (0.01-m2) Samples
Figure 3a shows the test process and the measured HRR of the small-scale (0.01-m2) EPS sample under the irradiation of 30 kW/m2. For the vertical sample, no ignition occurred, and the HRR was negligible. It was because all EPS was melted and flowed away before reaching the pyrolysis point. A similar process was also observed previously for EPS foam [35].

Phenomena and HRR of 0.01-m2 cone tests under the 30-kW/m2 irradiation, (a) EPS sample, where no ignition occurs on the vertical sample, and (b) EPS ETICS sample with the masonry cover, where ignition occurs on both horizontal and vertical samples
For the horizontal sample, the frame prevented the flow and leakage of molten EPS, so that the piloted ignition occurred under the irradiation of 30 kW/m2. Note that the piloted ignition delay time was quite long (135 s), probably because the melting and shrinkage of EPS increased the vertical distance between the pilot source (i.e., the spark) and the top surface of the molten EPS. In prior to the ignition, most of the EPS had been molten. During the burning process, the molten EPS burnt like a pool fire, and the masonry cover was partly sunk into the molten EPS, so that the influence of the initial ignition and the thickness of EPS sample on HRR was relatively small.
Table 1 lists the key test results and fire characteristics. The burning process was like a pool fire, and all fuel was burnt out in 257 s (Δtf), because the heated EPS first shrank and eventually became liquid [36]. The measured THR was 25.3 MJ/m2, the peak HRR per unit area (pHRRPUA) was 269 kW/m2 at 146 s right after ignition, and the mean HRRPUA was 98 kW/m2. The mean yields were 0.05 kg/kg for CO and 2.2 kg/kg for CO2, indicating a high combustion efficiency of EPS flame with a CO/CO2 ratio of 2.3%.
Figure 3b shows the test process and the measured HRR of the small-scale EPS ETICS sample with the masonry cover under the irradiation of 30 kW/m2. For the horizontal EPS ETICS sample, the ignition time (97 s) was short than the pure EPS sample in Fig. 3a. It was because (1) what was first ignited was the pyrolysis gas from the polymer component in the PCM cover, and (2) PCM was close to the pilot source, while the pure EPS sample would shrink quickly once heated. In addition, there are two peaks in the HRR curve, where the 1st peak stands for the burning of PCM and EPS, and the 2nd represents the EPS fire after the collapse of the PCM cover. Because PCM only has a small amount of polymer, its effective heat of combustion is much lower than pure plastics. For the same reason, the EPS ETICS sample with the masonry cover has a smaller effective heat of combustion.
For the vertical EPS ETICS sample, interestingly, the ignition occurred at only 53 s, and it was the fastest ignition, as compared in Table 1. It is probably the effect of the pilot location; that is, the spark near the top of the sample was easier to pilot fuel gases. Nevertheless, most of the molten EPS still flew away, so that the peak HRR, burning duration, effective heat of combustion (HOC), and THR were lower than those of the horizontal samples, which burnout all EPS.
3.2 Intermediate-Scale (1-m2) Facade Sample
Figure 4a shows the test process and the measured HRR of the intermediate-scale (1-m2) EPS sample under the irradiation of 30 kW/m2 (see Video S1). After radiant heating for 7 s, the light smoke came from the top of the specimen, which was likely the condensed EPS pyrolysis gases (fuel and water vapors). At 20 s, the molten EPS started to drip. The molten EPS continued to flow down for 15 s until all EPS melts dripped off. As expected, no ignition occurred because the molten EPS flew away driven by gravity before generating sufficient pyrolysis gases that could be piloted by the hot wire. Consequently, the HRR was negligible without igniting a flame, and its entire process was quite similar to the small-scale EPS sample in Fig. 3a.

The 1-m2 intermediate-scale tests under 30 kW/m2 irradiation (a) EPS sample, where no ignition occurs, and all molten fuel flows away (Video S1), (b) EPS ETICS sample with the masonry cover, where ignition occurs, and part of molten EPS flows away (Video S2), and the evolution of fire THR and HRR
Figure 4b shows the test process and the measured HRR of the intermediate-scale (1-m2) EPS ETICS sample with the masonry cover under the irradiation of 30 kW/m2 (see Video S2). Because the masonry cover (the PCM layer) blocked the direct heating to the EPS foam, smokes came out from the top of the specimen much later after 41 s, and they were likely the water vapor and pyrolysis gases of the PCM polymer component. The ignition occurred at 105 s, and the flaming process lasted for 181 s. During the burning process, part of the molten EPS flowed down without burnout in flame, which was essentially the same as the small-scale test in Fig. 3b. After the flame disappeared, the hot molten EPS continued to release heavy smoke (i.e., pyrolysis gases) for about 16 min. Such a smoke plume could be easily ignited in the presence of a pilot source. In real fire scenarios, these dripping and molten flows are potential fire hazards to accelerate the downward fire spread [10, 11] and cause remote ignitions [37, 38]. Also, these unburnt gases would affect the measurement of HRR, so the HRR data after extinction was irrelevant.
Table 1 compares the fire characteristics between the small-scale (0.01 m2) and intermediate-scale (1 m2) vertical EPS ETICS samples. A comparison shows that pHRR and THR of intermediate-scale tests were 73% and 220% of those in small-scale tests, and a similar trend applies to the pHRRPUA and THRPUA. The ignition times are close to each other for both scales. Despite molten EPS flow, the burning duration of the intermediate-scale test (245 s) is still much longer than the small-scale test (49 s). In general, the fire behaviors of EPS ETICS are very different from small scale to intermediate scale. This is different from wood fuels, for which small-scale and intermediate-scale tests gave more similar results [39]. There are two major reasons,
-
1.
The EPS, as a typical thermoplastic, melts and flows easily after heating, so the amount of fuel that can be pyrolyzed to feed the flame changes case by case; and
-
2.
The combination of the masonry cover and the EPS foam affects the ignition process and flow process of melts.
Thus, the ignition, HRRPUA, and burning duration of EPS ETICS are expected to be very different across the scale. There is no simple linear scaling law, and the setup (e.g., sample orientation and pilot location) can strongly affect the facade fire behaviors and hazards.
3.3 Large System-Scale (7-m2) Facade
According to the JIS A 1310 facade fire test standard method (see Fig. 2d), the calibration and baseline tests were carried out first with a non-combustible facade (25-mm ceramic fibers + 50-mm calcium silicate panel). The HRR of chamber fire was controlled by the propane gas burning varying from 400 to 1100 kW.
The surface temperatures of the inert facade were recorded by thermocouples, and the surface heat flux profile (\({\dot{q}}_{s}^{{{\prime}}{{\prime}}}\)) was monitored by heat flux (HF) gauges embedded into the inert facade surface. Because the gas burner HRR was fixed, both temperature and heat flux could reach a quasi-steady state. Table 2 shows typical measurements of surface temperature and fire radiation for large façade test under JIS A 1310 standard method, where the subscripts of op, 0, 1, 2, 3, 4, and 5 indicate the center of opening, 0 m, 0.50 m, 0.90 m, 1.50 m, 2.00 m, and 2.50 m above the upper of opening, respectively.
3.3.1 Large-Scale EPS Facade Fire
Figure 5a shows the reaction of EPS panel with a thickness of 100 mm to a chamber fire of 600 kW, and the temperature evolutions of facade surface are presented in Fig. 5b. The flame spilled from the window at about 64 s, where the temperature on the surface quickly exceeded the pyrolysis temperature of EPS (300–400 °C), so that the EPS foam near the upper of the opening could be ignited. At the same time, the bottom part of the window opening shrunk soon, and a little EPS melt-dripping was observed clearly at 88 s. Then, the large bulk of EPS melts accompanied by flame started to flow down at 208 s, and a strong pool fire of EPS melts was formed. The measured surface temperature decreased due to the removal of burning fuel. Afterward, the flame height and size quickly increased, and the entire sample was fully ignited at 246 s. Due to the safety concern, the gas burner inside the chamber was stopped at 260 s. The temperature profile in Fig. 5b further shows that at about 120 s, the hot flame started to anchor on the EPS panel and heat up the entire facade intensively.

EPS facade (thickness = 100 mm) fire test results under the chamber gas burner fire of about 600 kW, (a) timeline of fire development, and (b) thermocouple measurements on the facade surface
Figure 6a shows the reaction of the EPS panel with a thickness of 200 mm to a chamber fire of 400 kW. The spilled flame occurred slightly later at 70 s than Fig. 5 due to a smaller chamber fire HRR. The ignition of EPS occurred after 162 s because it was more difficult to heat the thicker EPS sample. Although there was a clear melting and dripping process, the pool fire of melt did not occur until 234 s. Figure 6b shows the surface temperature, where the flame of EPS reached the top of the facade after about 240 s. Thus, it also took a longer duration for the flame to spread over the 200-mm thick EPS, showing a lower flame spread rate than the 100-mm EPS. The overall burning duration of the 200-mm EPS facade is larger than that with 100-mm EPS in Fig. 5 due to (1) a smaller chamber gas-burner HRR as the ignition source (the major reason) and (2) a larger fuel thermal inertia for a thicker sample (the minor reason).

(a) Timeline of fire development for the 200-mm thick EPS facade fire test results under the chamber gas burner of 400 kW, (b) corresponding thermocouple measurements on facade surface; and (c) comparison of overall fire HRR between 100-mm and 200-mm thick EPS facade
The observed fire includes three components, that is, (1) the gas burner inside the chamber, (2) the burning and flame spread of the EPS facade, and (3) the pool fire of melts on the ground. The same three components contribute to the overall fire HRR, as compared in Fig. 6c. For the 200-mm thick EPS facade, the ignition occurred much later, where the HRR exceeds 400 kW at about 200 s. Thus, by the end of the gas burner at 320 s, the 200-mm EPS facade had not been fully ignited, and the flame was still spreading. For the same reason, the measured pHRR of 900 kW (subtracting the 400-kW gas burner) for the 200-mm thick EPS was lower than 1090 kW (subtracting the 600-kW gas burner) for the 100-mm thick EPS facade, which was ignited earlier and supported a faster flame spread.
3.3.2 Large-Scale EPS-ETICS Fire
Figure 7 shows (a) the reaction of a 200-mm thick EPS ETICS under a chamber fire of 1100 kW, (b) the surface temperature evolution, and (c) the heat flux 2 m away from the facade. Compared to the EPS facade fire in Figs. 5 and 6, although the chamber fire is much larger, the ignition was not occurred until about 180 s, indicated by the 2nd peak temperature in T4 and T5. Clearly, the polymer cement mortar (PCM) and cement mortar (CM) provided a certain fire resistance, and the ignition of EPS only occurred after the covering materials were gradually damaged. For the same reason, only part of the internal EPS foam was exposed to the spilled flame and ignited, so that the dripping flow of EPS melts was much smaller, and no pool fire was formed on the ground. After burning for more than 20 min, a big hole on the facade sample was found, and nearly all of the EPS was burnt out.

EPS ETICS (thickness = 200 mm) fire test with chamber fire HRR of 1100 kW, (a) samples before and after the test, (b) facade surface temperature, and (b) heat flux in front of facade fire
In terms of the surface temperature (Fig. 7b), the thermocouples in the lower part of the facade (from T0 to T3) were always in contact with the flame (either the spilled flame from the chamber or the EPS flame), so their temperatures were higher. For the thermocouples in the upper part of the facade, they were in contact with the pulsating EPS flame, so their temperatures were lower. For all thermocouples, their contract condition changed due to the damage of the local facade surface, so a large variation in temperature was observed in the later burning stage. For the incident heat flux 2 m away from the burning EPS ETICS (Fig. 7c), the heat flux right above the window (HF1) was the highest, and it had a peak value of 12.4 kW/m2, because of the larger flame thickness and view angle. The heat fluxes measured in other heights were below 10 kW/m2. As summarized in Table 2, the pHRR of the EPS ETICS with masonry cover was calculated as 500 kW (subtracting the 1,100-kW gas burner).
3.3.3 EPS ETICS Facade with Fire Barrier
The fire barrier of the facade was often employed to slow down the vertical flame spread and mitigate the potential internal melt-flow process inside the EPS ETICS facade. As illustrated in Fig. 8a, two fire barriers made of 150-mm high mineral wool were installed right above the window opening and 2.5 m above, respectively. Note that the sample width is 2730 mm that is larger than 1820 mm required in the JISA 1310 standard test method, while the height is the same 4.1 m. Compared with the case without the fire barrier, the fire barrier was effective in reducing the flame spread speed, the temperature on the surface was reduced by about 30% due to a smaller flame (Fig. 7b), and the overall HRR was also reduced (Fig. 7c). Finally, the pHRR was calculated as 187 kW by subtracting the 1,100 kW of the gas burner, so it was reduced by 63%, as compared with the case without the fire barrier in Table 2.

Large-scale fire test of the 200 mm thick EPS ETICS facade with the sample width of 2730 mm, mineral wool fire barriers, and a chamber fire HRR of about 1100 kW, (a) samples before and after the test, (b) facade surface temperature, and (c) HRR comparison between with and without fire barrier
3.4 Scale-Up Analysis
Table 2 compares the peak HRR normalized to the sample size (or the pHRRPUA) from the small-scale to the large-scale EPS and EPS ETICS (with the masonry cover) samples. For small- and intermediate-scale vertical EPS samples, a large portion of EPS melt without ignition, so the scale effect is only compared for the vertical EPS ETICS samples. For a large-scale EPS ETICS sample, the molten EPS could flow to the ground and into the chamber, making it is difficult to determine the exact burning area. Thus, the original sample size (7 m2) was used to estimate the pHRRPUA. Figure 9 further illustrates the scale effect of EPS ETICS (with the masonry cover) samples in both the normal (upper row) and logarithm (lower row) coordinates. As expected, the pHRRPUA in the cone-calorimeter test is much larger than that of the large-scale facade test. Specifically, the pHRRPUA for the vertical EPS ETICS is 137 kW/m2 in the cone-calorimeter test, which is almost two times of 76 kW/m2, as found in the large-scale facade test.

Scale effect of fire test on EPS ETICS with the masonry cover, (a) peak heat release rate (pHRR), and (b) peak heat release rate per unit area (pHRRPUA), where the sample sizes are 0.01 m2 (small scale), 1 m2 (intermediate scale), and 7 m2 (large scale)
It is because for the small-scale sample, the entire sample is ignited without the flame-spread process, and the burning process is also assisted by external radiation. On the other hand, for a large-scale facade sample, the sample is gradually ignited during the upward flame spread process, and the bottom sample can be partially burnt out before the flame reaches the top part. Thus, using the pHRRPUA from the cone-calorimeter test in the scale-up analysis assumes that every part of the large facade is burning intensively like a cone sample and ignores the actual fire spread process. Thus, such a scaling-up will significantly over-estimate the fire power, hazard, and impact in a real facade fire. Nevertheless, using the large value of pHRRPUA from the small-scale cone test may provide the worst facade fire scenario for a conservative fire safety design.
Moreover, the masonry cover of the EPS ETICS sample can significantly reduce the burning rate and HRR of EPS by a factor of 50% (see the comparison of large-scale façade in Table 2), and it can also mitigate the impact of external radiation and flame. The mitigation of masonry cover is effective for both small-scale and large-scale facade samples, so that its effect remains across different scales. Thus, it may be possible to explore the effectiveness of different masonry covers in small-scale cone-calorimeter tests.
4 Conclusions
In this work, both the EPS and the EPS ETICS (with the masonry cover) specimens are tested under three different scales, (1) 0.01-m2 small-scale cone calorimeter test, (2) 1-m2 intermediate-scale test, and (3) 7-m2 larger-scale tests. Results show that the impact of sample orientation is important in fire tests. For the vertical EPS sample heated by external radiation, it can melt and flow away without a piloted ignition, as found in both small-scale and intermediate-scale tests. In contrast, the masonry cover tends to limit the flow of EPS melts, which promotes the piloted ignition during the fire tests.
The peak heat release rate per unit area (pHRRPUA) found in the small-scale test doubles that of the large-scale facade test with a vertical flame spread. Thus, the small-scale test results cannot be simply scaled up to a large-scale facade sample. Nevertheless, using the large value of pHRRPUA from the small-scale cone-calorimeter test can provide the worst facade fire scenario for a conservative fire safety design.
Moreover, the masonry cover on the EPS ETICS sample can significantly reduce the burning rate and HRR of EPS fire by a factor of 50%, and it is effective from the small-scale to large-scale facade samples. The embedded rock-wool fire barrier inside the EPS ETICS can effectively reduce the vertical flame-spread rate and HRR. This work helps understand the scale-effect of the facade fire test and quantifies the effect of the masonry cover on lowering facade fire hazards.
5 Appendix
With an aim to clarify the vertical melt-flow process, a viscoelastic spectrometer made by ToyoSeiki Seisaku-sho was firstly used to measure the tan δ according to JIS K 7199 standard method based on Cross-WLF model. Figure 10a shows the measured apparent viscosity of EPS varying with shear rate and temperature from 200 °C to 350 °C, where the apparent viscosity decreases with the shear rate ranged from 122 s−1 (200 °C) to 2432 s−1 (260 °C). The reduction rate of viscosity becomes small at a higher temperature. The relationship between shear rate-averaged viscosity of EPS and temperature is shown in Fig. 10b. Specifically, the shear rate-averaged viscosity decreases from 4931 Pa·s (T = 200 °C) to 35 Pa·s (T > 350 °C). Therefore, when the EPS is heated to a temperature of over 260 °C, the EPS would show a strong melt-flow phenomenon. In addition, viscosity and softening temperature are inferred to play a considerable role in thermoplastic vertical wall burning. Thus, when vertical EPS is exposed to irradiation, the EPS melt-flow effect should not be ignored.

The description of apparent viscosity varies with shear rate and temperature, (a) apparent viscosity vs. shear rate, and (b) apparent viscosity vs. temperature
The apparatus consisted of the specimen holder, ultrahigh vacuum (UHV) chamber, quadrupole mass spectrometer, and temperature controller. The sample was exposed to a heating rate of typically 0.1 K/s to 30 K/s under UHV conditions. During the test, the computer recorded preselected partial pressures of chosen elements and exhibited its evolution on the screen display in both graphical and numerical forms. The 0.3 mg sample was inserted into the heating chamber, pumped to the base pressure of 10~5 Pa, and then the temperature starts to rise to form a linear temperature ramp. The sample was evolved gradually, expressing several typical peaks. After completing the heating process at about 700 °C, the calibration dose of molecular helium was injected into the heating chamber. The resulting data are then plotted versus the time, integrated, and calibrated for content calculation in mole %.
Figure 11a shows the EPS dependence of the evolution curve shape on the temperature. The main pyrolysis products of EPS are found to be ethylene, ethane, propylene, propane, hydrogen, and methane. The pyrolysis starts from 350 °C and approaches a peak at 660 °C. Figure 11b shows the PCM dependence of the evolution curve shape on the temperature. The main pyrolysis products are ethybenzene, styrene, toluene, benz aldehyde, methyl styrene, which agree with EPS pyrolysis product [40]. The main pyrolysis product of PCM (or its SBR component) is styrene. The yield of styrene starts from 430 °C and approaches a peak value at the temperature of 660 °C.

Pyrolysis gas measurement under N2 atmosphere, (a) EPS, and (b) PCM
Typical data of heat fluxes and surface temperatures are shown in the Table 3.
References
Barreira E, de Freitas VP (2013) Experimental study of the hygrothermal behaviour of external thermal insulation composite systems (ETICS). Build Environ 63:31–39
Nilica R, Harmuth H (2005) Mechanical and fracture mechanical characterization of building materials used for external thermal insulation composite systems. Cement Concrete Res 35:1641–1645
Kolbrecki A (2015) Model of fire spread out on outer building surface. Bull Polish Acad Sci Tech Sci 63:135–144
Khan AA, Lin S, Huang X, Usmani A (2021) Facade fire hazards of bench-scale aluminum composite panel with flame-retardant core. Fire Technol
MacLeod G (2018) The Grenfell tower atrocity. City 22:460–489
Mandilaras I, Atsonios I, Zannis G, Founti M (2014) Thermal performance of a building envelope incorporating ETICS with vacuum insulation panels and EPS. Energy Build 85:654–665
Wang S, Huang X, Chen H, Liu N, Rein G (2015) Ignition of low-density expandable polystyrene foam by a hot particle. Combust Flame 162:4112–4118
Wessies SS, Chang MK, Marr KC, Ezekoye OA (2019) experimental and analytical characterization of firebrand ignition of home insulation materials. Fire Technol 55:1027–1056
Doroudiani S, Omidian H (2010) Environmental, health and safety concerns of decorative mouldings made of expanded polystyrene in buildings. Build Environ 45:647–654
Luo S, Xie Q, Qiu R (2019) Melting and dripping flow behaviors on the downward flame spread of a wide XPS foam. Fire Technol 55:2055–2086
Xie Q, Zhang H, Ye R (2009) Experimental study on melting and flowing behavior of thermoplastics combustion based on a new setup with a T-shape trough. J Hazard Mater 166:1321–1325
Griffin GJ, Bicknell AD, Bradbury GP, White N (2006) Effect of construction method on the fire behavior of sandwich panels with expanded polystyrene cores in room fire tests. J Fire Sci 24:275–294
Xu Q, Jin C, Griffin G, Jiang Y (2014) Fire safety evaluation of expanded polystyrene foam by multi-scale methods. J Therm Anal Calorim 115:1651–1660
Yoshioka H, Nishio Y, Tamura M, Yoshida M, Noguchi T, Ohmiya Y et al (2014) Facade tests on fire propagation along combustible exterior wall systems. Fire Sci Technol 33:1–15
Nishio Y, Yoshioka H, Noguchi T, Ando T, Tamura M (2013) Experimental study on fire propagation over combustible exterior facades in Japan. MATEC Web of Conferences: EDP Sciences, p 04001
Mikkola E, Hakkarainen T, Matala A (2013) Fire safety of EPS insulated facades in residential multi-storey buildings. MATEC Web of Conferences: EDP Sciences, p 04002
Mandilaras I, Atsonios I, Zannis G, Founti MJE (2014) Thermal performance of a building envelope incorporating ETICS with vacuum insulation panels and EPS. Buildings 85:654–665
Hofmann A, Kaudelka S, Hauswaldt SJF (2018) Fire safety of FACADES with polystyrene foam insulation. Materials 42:466–474
Hajduković M, Knez N, Knez F, Kolšek J (2017) Fire performance of external thermal insulation composite system (ETICS) facades with expanded polystyrene (EPS) insulation and thin rendering. Fire Technol 53:173–209
Zhou B, Yoshioka H, Noguchi T, Ando T (2018) Experimental study of expanded polystyrene (EPS) External Thermal Insulation Composite Systems (ETICS) masonery facade reaction-to-fire performance. Thermal Science and Engineering Progress 8:83–92
Zhou B, Yoshida M, Noguchi T, Ando T (2020) Experimental study on vertical temperature profile of buoyant window spill plume from intermediate-scale compartments. Fire Mater (in press)
Zhou B, Yoshioka H, Noguchi T, Ando TJF (2018) Effects of opening edge treatment and EPS thickness on EPS external thermal insulation composite systems (ETICS) facade reaction-to-fire performance based on JIS A1310 standard facade fire test method. Materials 42:537–548
Zhou B, Yoshioka H, Noguchi T, Wang K, Huang X (2021) Upward fire spread rate over real-scale EPS ETICS Facades. Fire Technol
Rossi M, Camino G, Luda M (2001) Characterisation of smoke in expanded polystyrene combustion. Polym Degrad Stabil 74:507–512
Bakhtiyari S, Taghi-Akbari L, Barikani M (2010) The effective parameters for reaction-to-fire properties of expanded polystyrene foams in bench scale. Iran Polym J 19:27–37
Huang X, Wang Q, Zhang Y, Yin Y, Sun J (2012) Thickness effect on flame spread characteristics of expanded polystyrene in different environments. J Thermoplast Compos 25:427–438
Xu Q, Jin C, Jiang Y (2014) Analysis of the relationship between MCC and thermal analysis results in evaluating flammability of EPS foam. J Therm Anal Calorim 118:687–693
Stec AA, Hull TR (2011) Assessment of the fire toxicity of building insulation materials. Energ Build 43:498–506
Torero JL (2013) Scaling-Up fire. Proc Combust Inst 34:99–124
Kumm M, Söderström J, Lönnermark A (2013) EPS insulated facade fires from a fire and rescue perspective. MATEC Web of Conferences: EDP Sciences, p 05003
Bjegovic D, Pecur IB, Messerschmidt B, Milovanovic B, Alagusic M. Influence of fire barriers on fire performance of facades with combustible insulation. MATEC web of conferences: EDP Sciences, p 05006
ISO 5660-1 (2015) I. Reaction-to-fire tests—heat release, smoke production and mass loss rate—part 1: heat release rate (cone calorimeter method). International Organization for Standardization Geneva, Switzerland
ISO 14696 (2009) I. Reaction-to-fire tests—determination of fire and thermal parameters of materials, products and assemblies using an intermediate-scale calorimeter (ICAL)
JISA1310 (2015) Test method for fire propagation over building facades
Tsai K-C (2009) Orientation effect on cone calorimeter test results to assess fire hazard of materials. J Hazard Mater 172:763–772
Babrauskas V (2016) Heat release rates. Springer, SFPE handbook of fire protection engineering, pp 799–904
Huang X (2018) Critical drip size and blue flame shedding of dripping ignition in fire. Sci Rep 8:16528
Sun P, Lin S, Huang X (2020) Ignition of thin fuel by thermoplastic drips: An experimental study for the dripping ignition theory. Fire Safety J 115:103006
Janssens M, Urbas J (1996) Comparison of small and intermediate scale heat release data. Proceedings of Interflam, p 26–29
Kusch P, Knupp G (2004) Headspace-SPME-GC-MS identification of volatile organic compounds released from expanded polystyrene. J Polym Environ 12:83–87
Acknowledgements
The authors gratefully acknowledge reviewers for the meaningful content discussion. The authors gratefully acknowledge Masamichi Tamura and Yutaka Tanaike from University of Tokyo, Yuhei Nishio, Miki Nakamura, and Yuji Kanda from Tokyo University of Science for preparation of the experiment and the help in the experimental operation, and Zilong Wang from HK PolyU for valuable comments on the analysis.
Author information
Authors and Affiliations
Corresponding authors
Additional information
Publisher's Note
Springer Nature remains neutral with regard to jurisdictional claims in published maps and institutional affiliations.
Supplementary Information
Below is the link to the electronic supplementary material.
Supplementary file1 (MP4 9537 kb)
Supplementary file2 (MP4 7333 kb)
Rights and permissions
About this article

Cite this article
Zhou, B., Yoshioka, H., Noguchi, T. et al. Fire Performance of EPS ETICS Facade: Effect of Test Scale and Masonry Cover. Fire Technol 59, 95–116 (2023). https://doi.org/10.1007/s10694-021-01195-x
Received:
Accepted:
Published:
Issue Date:
DOI: https://doi.org/10.1007/s10694-021-01195-x