
Abstract
Assessing glaciers’ response to climate change is vital for water resource management. This study investigates changes in glacier areas, retreats and mass balance in the Garhwal Himalayan region. Initially, multitemporal Landsat imagery was used to delineate sample glacier boundaries for different study years manually. Subsequently, the Friedman test was employed to assess glacier area changes and retreats’ temporal status across the Garhwal Himalayan region. The findings reveal a 1.12% deglaciation rate, consistent across observation periods. Mean area change for the first (2001-11), second (2011-16), and third epochs (2016-21) range from − 0.053 to -0.203, -0.084 to -0.309, and − 0.088 to -0.257%yr− 1, respectively. Glacier retreat also shows homogeneous length loss across all epochs, with mean scores ranging from 7.024 to 14.65, 7.87 to 17.03, and 8.956 to 14.98 myr− 1, respectively. Mass balance ranges from − 0.547 to -1.089 m.w.e.yr− 1 between 2000 and 2020, influenced by variations in mean slope and debris cover on individual glaciers. Debris cover and glacier slope are identified as key determinants, with debris cover exhibiting a positive coefficient and glacier slope demonstrating an inverse relationship with mass balance. Additionally, a 10% increase in debris cover corresponds to a 0.36 m.w.e.yr− 1 mass gain for a given slope, while a 10% increase in slope steepness results in a 0.86 m.w.e.yr− 1 mass loss for a given debris cover. The study highlights that glacier area doesn’t affect the heterogeneous response. Instead, a strong correlation exists between glacier area and debris cover, with debris cover playing a key role in characterizing responses to changing climates. Thus, glacier area serves effectively as a proxy for debris cover extent.
1 Introduction
The Hindu Kush Himalayan (HKH) region boasts one of the world’s largest glacier expanses, rivaling those found in polar regions (Ramsankaran et al., 2019). This vast reservoir of freshwater is essential for sustaining over a billion people and driving the economies of the developing Indian subcontinent and beyond (Immerzeel et al., 2010; Frey et al., 2014; Azam et al., 2018, 2021). Particularly, the Indian sector of the Central Himalaya, the birthplace of the Ganga River, significantly influences India’s agrarian economy. Hence, understanding glacier responses, including changes in area, length, thickness, or mass balance in response to climate change, is crucial to mitigate potential water scarcity-induced instability (IPCC, 2014). Additionally, a thorough comprehension of glacier responses is vital for predicting variations in coastal areas due to rising sea levels (IPCC 2019) and assessing impacts on ecosystems and cryosphere-related hazards (Stoffel & Huggel, 2012; Cauvy-Fraunié & Dangles, 2019; Hugonnet et al., 2021).
Glacier mass changes in the Hindu Kush Himalayan (HKH) region exhibit significant variation, as highlighted in several previous studies (Brun et al., 2017; Lin et al., 2017; Shean et al., 2020; Hugonnet et al., 2021; Bhambri et al., 2023). This variability is observed even within the same climatic zone, with glaciers exhibiting diverse thickness and mass changes. For example, Zhou et al. (2019) found that in the Pamir range, mass balance ranged from − 0.12 to 0.63 m.w.e.yr-1. The study utilized KH-9 imagery from 1975 to create a historical digital elevation model (DEM) and compared it with SRTM-C DEM to calculate glacier thickness changes. Similarly, Abdullah et al. (2020) analyzed glacier thickness changes in the Upper Indus basin from 2000 to 2012 using TanDEM-X and SRTM-C DEMs. The study found the highest thinning at -1.69 ± 0.60 m.yr-1 and marginal thinning at -0.11 ± 0.32 m.yr-1 (Abdullah et al., 2020). Likewise, Pieczonka et al. (2013) documented heterogeneous mass loss in the Aksu-Tarim Catchment from 1976 to 2009. The study presents mass changes for 12 glaciers, utilizing 1976 KH-9 Hexagon, 2000 SRTM3, and 2009 SPOT-5 datasets in the Aksu-Tarim Catchment. The glacier mass balance ranged from 0.05 ± 0.23 to -1.53 ± 0.23 m.w.e.yr-1 and 0.51 ± 0.19 to -0.69 ± 0.19 m.w.e.yr-1 during 1976–1999 and 1999–2009, respectively (Pieczonka et al., 2013). Numerous other studies (Bandyopadhyay et al., 2019; Bhattacharya et al., 2021; Bhambri et al., 2023) underscore different glacier mass balance magnitudes across various catchment levels within the same climatic zone in different HKH regions.
Scherler et al. (2011) reported that glaciers respond to climate change, with the magnitude of this response depending on various topographical and morphological parameters. These controlling geomorphic parameters vary significantly from one glacier to another, contributing to the heterogeneous response observed. Additionally, Pellicciotti et al. (2015) underscored the intricate and diverse nature of glacier response patterns within catchments, influenced by a complex of dynamic and surface factors. Recent studies have endeavoured to unravel the reasons behind heterogeneous glacier responses, particularly at the catchment or basin level, where the assumption of the same climatic zone is valid. These studies have utilized various topographic and morphological factors as predictors (Brahmbhatt et al., 2017; Garg et al., 2017a, b, 2019; Abdullah et al., 2020; Bhattacharya et al., 2021; Romshoo et al., 2022).
Some of these studies seek to elucidate heterogeneous responses through expert intuition, a subjective method that introduces variability among experts and lacks the quantification of controlling parameters. Furthermore, other studies adopted multiple simple linear regression models for individual morphological parameters to anticipate diverse glacial responses (Ali et al., 2017; Brahmbhatt et al., 2017). However, employing a distinct simple linear regression model for each morphological parameter (predictor) is not entirely optimal (James et al., 2013). When the morphological parameters utilized in previous studies as predictors are correlated, this approach can yield misleading estimates of the association between each morphological parameter and glacier response parameters. Consequently, utilizing a multivariate regression model that accommodates numerous predictors directly is preferable to fitting separate simple linear regression models for each predictor (James et al., 2013).
The scarcity of comprehensive glacier data in the Central Himalayas has impeded a thorough assessment of regional mass balance estimations (Dobhal et al., 2008; Pratap et al., 2015; Kumar et al., 2021). Therefore, most glacier studies focus on changes in glacier areas and retreat to gauge glacier health. Limited regional studies (Bhambri et al., 2011; Garg et al., 2017a; Kumar et al., 2021) marginally cover segments of the Indian Central Himalayan glaciers. Bhambri et al. (2011) analyzed changes in the glacier area in the Garhwal Himalayan zone, observing a transition from 599.9 ± 15.6 to 572.5 ± 18.0 km2 between 1968 and 2006, indicating a loss of 4.6 ± 2.8%. Garg et al. (2017a) assessed glacier changes and topographical impacts on 18 Central Himalayan glaciers from 1994 to 2015, noting a reduction in glacier area from 313.34 ± 7.95 to 306.36 ± 8.04 km2 during this period. Kumar et al. (2021) monitored a 10% deglaciation rate between 1980 and 2017 in the Rishi Ganga catchment. However, relying on a small sample of glaciers may not adequately represent the entire region, especially when improper statistical methods are employed (Guha & Tiwari, 2022). Furthermore, to the best of knowledge in drafting this manuscript, previous studies from the Garhwal Himalaya have neither comprehensively covered all glaciers in the region nor employed suitable statistical methods to extrapolate findings to the entire region from a limited sample. Consequently, the condition of glaciers in India’s Central Himalayan region remains inadequately understood.
The purpose of the current study is dually based on the aforementioned literature gap:
-
i)
The current study employs inferential statistical techniques to calculate temporal changes in the glacial area and glacial retreat for more than two decades in the twenty-first century;
-
ii)
Compute the mass balance and identify factors influencing heterogeneous glacier mass balance through appropriate statistical learning methods.
2 Study area
The study focuses on the Garhwal Himalayan zone, a region in the Central Himalayas of India. This area is of interest due to the convergence of two major precipitation regimes—the Indian Summer Monsoon in the summer and mid-latitude westerlies in the winter—that nourish the glaciers (Dobhal et al., 2008; Bookhagen & Burbank, 2010; Garg et al., 2017a). Situated within the Indian state of Uttarakhand (Fig. 1), the study also includes a few glaciers extending beyond the Indo-China border. Twenty-three representative glaciers in the Garhwal Himalayan zone are examined in this study, selected based on criteria such as size, altitude, slope, and debris cover extent.

Location of studied glaciers
These sampled glaciers range widely in size, from the largest spanning 51.8 km2 to the smallest covering 2.01 km2. In terms of the equilibrium line altitude (ELA), the sampled glaciers exhibit a broad range, with the highest ELA recorded at 6196 m and the lowest at 5529 m. Slopes vary among the glaciers, ranging from the steepest at 21.25 to the gentlest at 10.37. Similarly, the mean elevation of these glaciers ranges from 6113 to 5440 m. Notably, the sample includes both heavily debris-covered and clean glaciers, providing a diverse representation of glacier conditions in the Garhwal Himalayan range. Therefore, these selected sample glaciers provide a comprehensive snapshot of the region’s glacier dynamics, forming the basis for the subsequent statistical analysis in this study.
3 Data and methods
3.1 Data used
The Landsat precision and terrain-corrected product (L1T) exhibit very high geodetic and radiometric accuracy, including ground control points, utilizing a DEM for topographic displacement (Yan & Roy, 2021). Consequently, the Multitemporal Landsat (L1T) product was obtained from the United States Geological Survey (USGS) portal (https://earthexplorer.usgs.gov/) and used for parameter collection, such as glacial boundary, glacial area and debris cover (Supplementary Table 1). Simultaneously, the Shuttle Radar Topography Mission (SRTM) and Aster DMO14 DEMs were acquired from the SRTM Data (http://srtm.csi.cgiar.org/srtmdata/) and Earthdata (https://earthdata.nasa.gov/) web portals, respectively. These DEMs were utilized to calculate glacial thickness change, ELA, slope, and mean elevation of the glaciers.
For meteorological data, the CTU 4.06 half-degree datasets covering the study area were employed (Harris et al., 2020) for four grids: 79.25oE & 31.25oN, 79.25oE & 30.75oN, 79.75oE & 31.25oN, and 79.75oE & 30.75oN. The average of these datasets was used for meteorological trend analysis.
3.2 Methodology
The methodology is structured into three subsections (Fig. 2). The initial phase involves examining temporal changes in glaciers across the Garhwal Himalayan region, encompassing assessments of glacier area variations and retreats. Furthermore, appropriate statistical methodologies were utilized to extrapolate findings from sample glaciers to the broader area. The second segment of the study focuses on determining glacier mass balance using geodetic techniques. Subsequently, the third part of the methodology aims to identify factors influencing the heterogeneous mass balance in the Garhwal Himalayan zone. Potential parameters affecting glacier mass balance were identified from relevant literature sources (Bhambri et al., 2011; Hanshaw & Bookhagen, 2014; Nuimura et al., 2012; Pellicciotti et al., 2015). Following this, specific constraining parameters were selected from this list, and their respective impacts were assessed using a multivariate regression model.
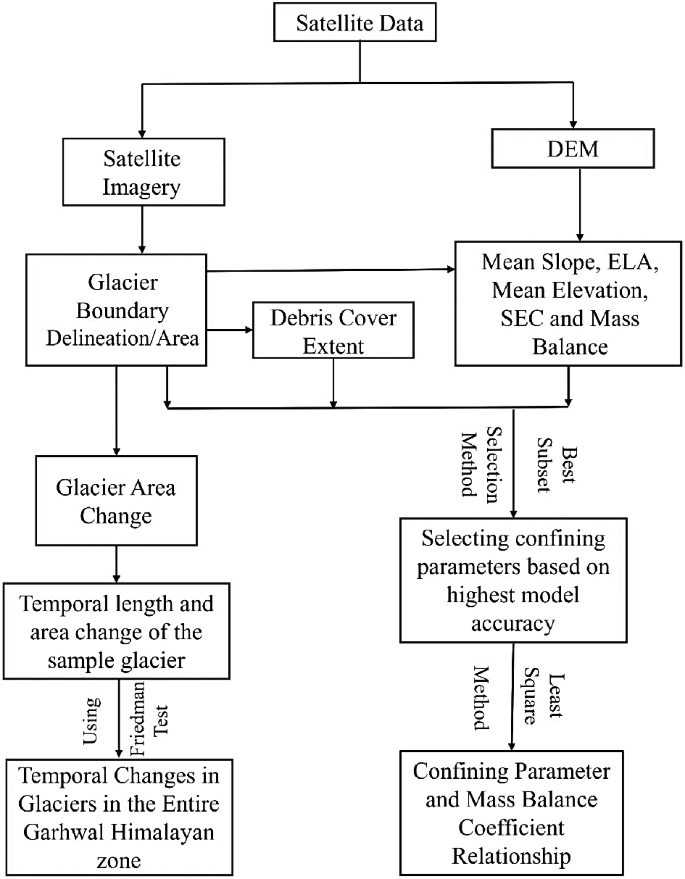
Methodology flowchart of this study
3.2.1 Spatio-temporal variation analysis
3.2.1.1 Spatial changes of the glaciers
Initially, the panchromatic sharpening method was applied to increase the spatial resolution from 30 m to15 m of all Landsat Enhanced Thematic Mapper Plus (ETM+) and Operational Land Imager (OLI) datasets. Further, the onscreen manual digitization process has delineated individual glacier boundaries. The method is most accurate for delineating glacier boundaries (Albert, 2002; Tiwari et al., 2016), mainly for the debris-covered glaciers in the Himalayan landscape (Guha & Tiwari, 2022). Various false colour compositions (FCC) like Near-infrared (NIR)- Short-wave infrared (SWIR) -Red, SWIR-NIR-Green, and NIR-Red-Green have been used for greater conception and image interpretation. Furthermore, the topmost portion of the glaciers was delineated by understanding the position of the ice divide. In addition, the debris-covered glacier ablation zone and non-glacier rocky terrain have been distinguished using the SWIR-NIR-RED band combination in the Landsat images (Pandey et al., 2011). The most challenging glacier snout area has been identified by tracking various morphological features and locating the ice-wall shadow or the origin of any stream or runnel supplied by that specific glacier.
To achieve the objective, area change was converted into the rate of area changes per year (% yr-1), followed by a statistical test. Stripes were drawn 50 m apart and parallel to the glacier’s primary flow direction to calculate changes in glacial length or retreats. The mean length where the stripes intersected with the glacier outlines was then used to measure length change (Bhambri et al., 2012). Finally, the rate of area changes (%yr-1) and retreat (myr-1) between 2001 and 2011, 2011‒2016, and 2016‒2021 was tagged as first (TF1), second (TF2), and third timeframe/epoch (TF3), respectively. The uncertainty of average annual area changes is 100.62, 201.24, and 127.2 m2yr-1 for TF1 to TF3, respectively (Supplementary Table 2). Likewise, the uncertainty of the average annual retreat is 3.39, 6.67, and 4.24 myr-1 for the TF1, TF2, and TF3, respectively.
3.2.1.2 Statistical analysis
In this study, inferential statistics were utilized to gain insights into temporal variations in Garhwal Himalayan glaciers, using a dataset of 23 sample glaciers. The application of inferential statistics commences with the selection of an appropriate test statistic (Marshall & Jonker, 2011; Guha et al., 2024). When working with datasets involving at least three groups, researchers often consider analysis of variance (ANOVA) as a primary option. Various types of ANOVA exist, such as parametric ANOVA, repeated measures ANOVA, Kruskal-Wallis ANOVA, and the non-parametric Friedman ANOVA, among others. ANOVA and Kruskal-Wallis ANOVA are designed for independent data, while repeated measures ANOVA and the Friedman test are tailored for repetitive datasets (Sanders et al., 2019; Guha et al., 2024). It is essential to acknowledge that parametric tests tend to yield more effective results when specific assumptions are met (McCrum-Gardner, 2008). However, one key assumption for parametric tests like ANOVA is that the dataset follows a normal distribution. To assess this assumption, a quartile-quartile plot (Q-Q plot) was employed in the current study. The results from the Q-Q plot indicated that the dataset deviates from a normal distribution (Supplementary Fig. 1). Hence, in the present study, the non-parametric Friedman test was selected as the most suitable test statistic for hypothesis testing, given its compatibility with repetitive data and its ability to handle non-normally distributed data (Cleophas and Zwinderman, 2016; McCrum-Gardner, 2008).
The Friedman test (1937), is a robust non-parametric analytical tool that operates without stringent assumptions about data distributions. The test is ideal for working with ordinal or ranked data and exhibits resilience when dealing with skewed or non-normally distributed datasets (Noguchi et al., 2012). The choice of the Friedman test was driven by the need to circumvent potential violations of parametric assumptions. The fundamental purpose of the Friedman test is to determine whether significant differences exist among the groups, accounting for the inherent nature of repeated measurements in the data. In cases where the outcomes of the Friedman test yield statistical significance, post-hoc analyses become necessary. These post-hoc examinations often manifest as pairwise comparisons, carried out using suitable non-parametric tests such as the Wilcoxon signed-rank test (Guha & Tiwari, 2022). These comparisons frequently require specific adjustments to discern the unique disparities among groups. Conducting the Friedman test necessitates an initial step where the data is organized into a tabular format, with each condition occupying a distinct column. In this study, which delved into temporal analysis across three distinct epochs, each column represented one epoch, while each row corresponded to an individual glacier. Once the glacier data was ranked within their respective epochs, the sum of these ranks was computed. Utilizing these rank-sum values, the Friedman test statistic (Fr) was calculated using the following formula:
Where the sum of the ranks of each group, number of samples, and number of epochs are represented by R, N, and K, respectively. Finally, with a significance threshold of 0.05, the study proceeds to test the hypotheses outlined in Table 1.
3.2.1.3 Post hoc test and Bonferroni correction
In the context of hypothesis testing involving multiple groups, particularly after conducting ANOVA or other similar tests, the rejection of the null hypothesis (H0) raises questions about specific group differences. Generally, ANOVA results do not offer detailed information on which particular group pairs exhibit significant differences. Therefore, researchers often perform supplementary analyses to uncover these distinctions among specific groups. To address this, employing a multiple comparison test, often referred to as a post-hoc test, is necessary (Cleophas and Zwinderman, 2016).
In a statistical hypothesis test, the significance probability, often expressed as a P value, represents the likelihood of observing an extreme result if H0 is true. This significance level ranges between 0 and 1, signifying the probability of observing an outcome that supports H0 (Lee & Lee, 2018).
In the context of comparing three groups, such as Group X versus Group Y, Group Y versus Group Z, and Group X versus Group Z, each pair of comparisons is regarded as a family. The family-wise error, a Type I error that may be encountered during each of these family-wise comparisons, is denoted as such. To illustrate the impact of not adjusting the significance level (α) when multiple statistical analyses are conducted involving these families concurrently, the following scenario is contemplated: A Student’s t-test is conducted between two groups, X and Y, with a 5% alpha error level, leading to a statistically non-significant outcome. In this case, the probability that H0, which posits that groups X and Y are identical, is true, stands at 95%. Now, another group, Group Z, to be compared with both Groups X and Y, is introduced. If a subsequent Student’s t-test between Groups X and Y also yields a non-significant result, the likelihood of non-significance between X and Y, as well as between Y and Z, is calculated as 0.95 × 0.95 = 0.9025, or 90.25%. Consequently, the alpha error for these tests is determined to be 1 − 0.9025 = 0.0975, surpassing the initial 0.05 level. Furthermore, if the statistical analysis between Groups X and Z also results in non-significance, the combined probability of all three pairs (families) yielding non-significant results is found to be 0.95 × 0.95 × 0.95 = 0.857, resulting in an actual testing alpha error of 1 − 0.857 = 0.143, exceeding 14%.
This underscores the significance of adjusting the α level when multiple comparisons are made to maintain the desired Type I error rate and prevent the inflation of the error rate (Guha & Tiwari, 2022). To manage this increased risk of Type I error, the Bonferroni correction is a commonly used method for adjusting the significance level in multiple comparisons. It ensures that the family-wise error rate is maintained at the desired level. This correction entails dividing the alpha level (typically set at 0.05) by the number of tests conducted. The adjusted alpha level is then used to evaluate the statistical significance of each individual test, thereby reducing the likelihood of detecting false positives (Napierala, 2012).
For pairwise post hoc tests, where in the current study have three groups of datasets from three epochs (k = 3), the total number of hypotheses tested for pairwise comparisons is calculated as 3C2 = 3. The adjusted alpha for these pairwise tests can be determined using the formula:
Adjusted alpha (Adj α) = α/3 (Eq. 2).
In this case, the level of significance (α) is 0.05/3, resulting in α = 0.0166.
In the current study in the context of the post hoc test, a series of non-parametric Wilcoxon signed-ranked tests have been conducted between each pair of groups, utilizing a significance level of 0.0166 to mitigate the risk of Type I error. The Wilcoxon signed-ranked test involves the summation of ranks and is conceptually akin to a paired-sample Student t-test in which rank adjustments are applied before incorporating difference scores into the t-formula. This approach is analogous to a one-sample Student t-test conducted on signed ranks, with differences replacing the observations (Zimmerman & Zumbo, 1993).
3.2.1.4 Bootstrapping confidence interval
Regardless of the distribution of the dataset, the bootstrapping confidence interval method helps estimate the empirical confidence intervals (Christopher Z. Mooney and Robert D. Duval, 1993; Efron and Tibshirani, 1993; Haukoos & Lewis, 2005) statistically. By periodically taking random samples from the known sample with replacement, the technique creates a sampling distribution using data from one sample (Endo et al., 2015). For each period in our current study, 1000 bootstrap samples were developed to calculate the 95% confidence interval.
3.2.2 Glacier surface elevation changes and mass balance calculation
The co-registration algorithm developed by Nuth and Kääb (2011) is a widely recognized method for minimizing horizontal and vertical discrepancies between two Digital Elevation Models (DEMs). In our study, we employed the universal co-registration technique as the initial step in calculating glacier mass balance. Subsequently, the DEM differencing approach was applied to quantify surface elevation changes between the initial and final epochs. To ensure accuracy, outliers in the surface elevation change (SEC) data were identified and removed by excluding pixels where the height difference exceeded three standard deviations from the mean (Ramsankaran et al., 2019).
Following the outlier removal process, glacier volume change was derived from the SEC data, using manually digitized glacier boundaries. The resulting volume change was then converted to mass change for the entire glacier using a density conversion factor of 850 ± 60 kg m− 3, as per the methodology outlined by Huss (2013).
3.2.3 Quantification for heterogenous glacier responses
3.2.3.1 Selection of confining parameters that regulate the glacier response
In the subsequent phase, the plausible factors influencing the glacier response within the same climate zone were chosen from earlier research publications (Nuimura et al., 2012; Hanshaw & Bookhagen, 2014; Pellicciotti et al., 2015). Multiple studies have used the parameter of the glacier area (Bhambri et al., 2011; Basnett et al., 2013; Kriegel et al., 2013; Garg et al., 2017a, b). The ELA is another critical parameter as it helps determine the relationship between the distribution of glacier mass and local climate (Hanshaw & Bookhagen, 2014) ) and the overall state of the glacier (Shukla & Qadir, 2016; Garg et al., 2017a, b). Therefore, the current study selected the ELA as one of the probable parameters. The study incorporates slope (Nuimura et al., 2012; Pellicciotti et al., 2015) and glacier elevation (Garg et al., 2017a; Brahmbhatt et al., 2017), drawing from prior research in the Himalayan region. These parameters were chosen for their established relevance in understanding mass balance fluctuations. Debris cover, a key factor in glacier responses (Basnett et al., 2013; Garg et al., 2017a, b), was also included. The final step involved selecting controlling parameters from the probable list using the best subset selection method, ensuring maximum model accuracy. Subsequently, the study established relationships between these parameters and mass balance.
3.2.3.2 Extraction of other parameters
With the manual digitization process, the debris cover extent in the glacier has been outlined. Further, the ELA has been calculated by Accumulation Area Ratio (AAR) using the ELA toolbox made by Pellitero et al. (2015). Additionally, the mean elevation of the glacier was derived from the DEM. Another important factor, glacier slope, was determined by dividing the elevation difference by the glacier’s length along the main flow line.
3.2.3.3 Optimization of parameter subset and coefficient estimation
For predicting a quantitative response, linear regression is a very effective tool (Guha & Tiwari, 2023). Therefore, the current study uses multiple linear regression to determine the link between the different morphological parameters as predictors and response, i.e., mass balance, because there are more independent variables than one. In many scenarios, only a small amount of the available predictors is correlated with response to a greater extent (James et al., 2013; Guha & Tiwari, 2023). Equation (3) can be used to express the basic formula for multiple linear regressions.
where Y is the response variable. X1, X2, and Xp are predictors that the subset selection method can select. a, b1,b2, and bp are the coefficients of the model.
Amidst numerous potential variables, choosing a concise set of significant predictors is crucial for reducing model complexity. The present study utilizes the best subset selection method with the aim of identifying a limited subset of predictors that maximizes the expected prediction accuracy of the resulting linear model (Zhu et al., 2020). This approach systematically tests all possible combinations of predictors, selecting the subset that ensures optimal model accuracy.
The chosen metric to assess the accuracy of the model is Adjusted R2 in this study. The most common metric, R2 simply explains the training error, which may be decreased by overfitting or adding more predictors, so the chosen parameter has an advantage over R2. However, the more significant test error—that is, an error from a new, unexposed dataset—is defined by the adjusted R2. The Adjusted R2 parameter also aids in removing pointless predictors. Consequently, in order to reduce redundancy and model complexity, the Adjusted R2 is essential (James et al., 2013).
The final section computes the model coefficients based on the smallest least square error, where the values minimizing the sum of squares between the model and measurements serve as estimates of model parameters in the least-squares approach (Abdi, 2007).
4 Results
4.1 Status and temporal changes in the glaciers
The results of the current study reveal a discernible pattern in the total area of the sampled glacier, which underwent a reduction from 391 ± 0.056 to 386 ± 0.044 km² during the period from 2001 to 2021. This corresponds to a deglaciation rate of approximately 1.12%. Notably, Glacier 6 (G6) experienced the most significant area change, with a decrease of 12.93%, while Glacier 23 (G23) exhibited the smallest area change of only 0.04% during the observation period (Supplementary Table 3).
The findings of the Friedman test, with a significance level of 0.30, suggest that there are no statistically significant differences in the temporal area changes. This p-value, notably higher than the conventional threshold of 0.05, leads to the retention of the null hypothesis, signifying that the available data does not provide sufficient evidence to assert unequal rates of area change.
Further analysis reveals varying trends in area changes over the study’s three distinct epochs. In the initial period (2001–2011), Glaciers G6, G1, and G4 displayed the most substantial area changes, while G23, G15, and G20 exhibited the least variation. From 2011 to 2016, G6, G13, and G8 recorded the greatest area changes, while G11, G23, and G10 displayed the least. Finally, between 2016 and 2021, G6, G1, and G4 once again exhibited the most significant area changes, with G23, G22, G20, and G21 remaining the most stable glaciers with the least area changes. When considering the entire study period, G6, G1, and G4 consistently displayed the maximum area changes, while G23, G20, and G19 remained the most stable. On average, the area changes for individual glaciers between 2001 and 2021 was − 0.153%yr-1. Notably, Glaciers G3, G9, and G18 closely mirrored the overall regional trends. Finally, the mean rates of area change for the first-, second-, and third-epochs ranged from − 0.053 to -0.203, -0.084 to -0.309 and − 0.088 to -0.257% yr-1, respectively, with a 95% confidence level (Fig. 3 and Supplementary Table 5).

Change in glacier area with 95% confidence interval
During the entire study period, the sample glaciers exhibited an average retreat of 11.97 myr− 1. The chronological assessment using the Friedman test yielded non-significant results for retreat, mirroring the pattern observed in the area change parameter. Consequently, the average retreat remains consistent across all epochs in the Garhwal Himalayan zone. However, some variations in retreat within the same glaciers were noted across different epochs.
Between 2001 and 2011, the maximum retreat was observed in G16, G1, and G17, while marginal retreat occurred in G23, G14, and G22 during the same epoch. In the subsequent epoch (TF2), the maximum retreat transpired in G13, G15, and G5, whereas G20, G19, and G14 emerged as the most stable glaciers. Between 2016 and 2021, the highest retreat was observed in G7, G14, and G9, while the three glaciers with the least retreat were G23, G22, and G20. Notably, G16 exhibited the maximum retreat at a rate of 25.48 myr− 1 throughout the entire study period, followed by G13 and G17 (Supplementary Table 4). In contrast, minimal length changes were observed in G23, G22, and G20, each with a magnitude of around one myr− 1, falling below the study’s uncertainty level between 2001 and 2021. At a 95% confidence level, the mean scores of length changes for the first, second, and third epochs range between − 7.024 to -14.65, -7.87 to -17.03 and − 8.956 to -14.98 myr− 1, respectively (Fig. 4 and Supplementary Table 6).

The 95% confidence interval of the retreat
Interestingly, while G16 experienced the maximum retreat, G6 exhibited the maximum area changes. This discrepancy is attributed to lateral retreat or glacier width changes, a prevalent phenomenon in many smaller glaciers (Fig. 5). While G16 demonstrates high retreat, G6 undergoes deglaciation due to alterations in glacier width.

Comparison of glacier width changes in the Garhwal Himalayan region (2001–2021) using high-resolution google earth imagery (Left) and landsat imagery (Right) at 30 m spatial resolution
4.2 Assessment of glacier thickness change and mass balance
The result shows that the mean surface elevation changes of the studied glaciers are − 0.96 myr− 1 between 2000 and 2020. All the glaciers show thinning in the ablation zone and thickening in the upper accumulation zone (Fig. 6).

Temporal shifts in surface elevation changes in Garhwal Himalayan glaciers from 2000 to 2020
The result also shows that all the sample glaciers have a negative mass balance. Additionally, the magnitude of the mean mass balance is -0.818 ± 0.21 m.w.e.y− 1 (Fig. 7). The 95% confidence interval of mass balance comes between − 0.547 and − 1.089 m.w.e.yr− 1 in the entire Garhwal Himalaya (Supplementary Table 7).

Variability in mass balance among the investigated glaciers
4.3 Influence of morphological parameter
From the subset selection, we observed that only two predictors, debris cover extends and slope, are sufficient to describe the reason behind different mass balances (Fig. 8, Supplementary Fig. 2). In detail, the debris cover has a positive coefficient means mass balance is less negative to positive when the debris cover extent is greater and vice versa. On the other hand, mass balance is inversely proportional to the glacier’s slope (Figs. 8 and 9), which means mass balance is more negative when the slope is stiff, and less negative or positive mass balance can be seen if the slope of the glacier is gentle.

The relation between selected predictors and mass balance

The relation between mass balance and selected predictors for various intervals
The above equation can be interpreted as follows: for a given slope, an additional 10% debris cover is associated with 0.36 m.w.e.yr− 1 as gain in mass, approximately (Eq. 4). On the other hand, an additional 10% slope is associated with the loss in mass of 0.86 m.w.e.yr− 1, for a given debris cover. The P-value of the coefficients is below 0.001, which means both coefficients are highly significant. Besides that, the correlation matrix shows that the slope and debris cover is correlated weekly, proving the model’s strength.
Finally, the accuracy of the model has been calculated. The R2 value of the model is 0.75, which means the proposed model can explain more than three fourth variation in the mass balance in the training dataset. But the R2 value significantly increases by selecting all five morphological predictors instead of only the slope and debris cover. However, we aim to make a simple model with less test errors, not the training error. Therefore, the parameters are selected based on the maximum adjusted R2 value. The adjusted R2 shows that only the slope and debris cover can explain the 73% variation in the mass balance (Supplementary Fig. 3).
5 Discussions
5.1 Climatic analysis
Over the past century, there has been a global increase in average surface air temperature by approximately 0.7 °C (IPCC 2001). This trend is particularly pronounced in high topographic areas like the Himalayas, where climate conditions differ significantly from those in lower-elevation regions, potentially biasing global trends for specific regions (Sahu & Gupta, 2020). Unfortunately, due to the scarcity of meteorological stations in or near Himalayan glaciers, there is often ambiguity in associating climatic components with glacial responses. Moreover, there are only a few catchments for high-altitude meteorological observations in the Central Himalayan region (Garg et al., 2017a). For instance, at the Chorabari glacier, the mean daily temperature ranged from 12 to -1 °C between June and October 2003‒2010, with average summer precipitation recorded at 1253 mm between June and October 2007‒2010 (Dobhal et al., 2013). Furthermore, the Mukhim station, also situated in the Indian Central Himalayan region, showed a statistically insignificant decreasing trend in mean annual temperature between 1957 and 2005, along with a decreasing trend in precipitation over the same period (Bhambri et al., 2011). Similarly, between 2000 and 2012, the Bhojwasa station recorded mean annual temperatures ranging from 11.1 to -2.3 °C and precipitation of 2575 mm, situated at an elevation of approximately 3780 m a.s.l. (Gusain et al., 2015). At the Dokriani glacier (around 3760 m above sea level), daily mean air temperatures ranged from 17 to 1 °C between May and October 1992‒2002, with summer precipitation ranging from 1000 to 1300 mm from 1992 to 2000 (Dobhal et al., 2013).
In the Himalayan region, a dearth of long-term meteorological data (Sahu & Gupta, 2020) and inadequate data sharing policies pose challenges for researchers aiming to access local meteorological datasets for scientific purposes. However, the availability of reanalysis meteorological products in recent years has eased the study of climatic trends in the Himalayan terrain, owing to their global coverage. As a result, annual temperature and precipitation trends have been estimated from 1901 to 2021 using reanalysis datasets in this study.
The Mann-Kendell test and Sen’s slope estimator are commonly employed methods for trend analysis (Garg et al., 2024). The results of the Mann-Kendall test in the current study show significant trends in temperature and precipitation (Table 2). Sen’s slope estimator suggests an increasing trend in mean annual temperature with a magnitude of 0.007 °C per year (Fig. 10), while precipitation data show a downward trend (-1.35 mm per year).
Multiple studies have established a strong relationship between temperature, precipitation, and glacier dynamics (Mir & Majeed, 2018; de Kok et al., 2020; Kaushik et al., 2020). Although temperature has a more pronounced effect on glacier melting than precipitation, leading to increased energy absorption by ice and snow and subsequent acceleration in glacier melting and negative mass balance (Sahu & Gupta, 2020).

The temporal variation of temperature (a) and precipitation (b) in the study area
5.2 Comparison with previous studies
According to the current study, the glaciers in the Garhwal Himalayan region are currently going through a stage of depletion. The current study shows that the glaciers in the Garhwal Himalayan area are going through a depletion stage in the 21st century. Also, the temporal rate of area changes and retreats are equal in the entire observed time in the current study. The following comparison study is carried out with the previously published study in the same or its surrounding region.
According to statistics on area changes for the investigated glaciers, 1.12% of the glacier’s area was lost over the course of the 20 years under study, which is less than the 2.23% claimed by (Garg et al., 2017a). The main reason for this difference is methodology and sample selection. Garg et al., (2017a) neither studied the glacier’s presence in the Central Himalayan region nor did any statistical analysis to conclude the entire area of interest. Therefore, the result of (Garg et al., 2017a) only says about the studied glacier, not the entire Central Himalayan region. On the other hand, the current study infers the actual mean or population mean, that is, the mean of area changes and retreat in the entire Garhwal Himalayan region from the sample glaciers. Also, the current study’s result shows that the sample mean of area change lie between − 0.079 to 0.228%yr− 1 based on different sample selections from the Garhwl Himalayan zone. On the other hand, (Garg et al., 2017a) found that from 1994 to 2001 and 2001–2015, the rates of area change were − 0.13 ± 0.28 and − 0.10 ± 0.1% yr− 1, respectively, which also supports the findings of the present study.
The average retreat rate for the entire Garhwal Himalayan region is estimated at 11.97 myr− 1, with a 95% confidence interval indicating that the sample mean of retreat may vary from 8.956 to 14.98 myr-1 between 2001 and 2021. In comparison, Garg et al. (2017a) reported a higher average retreat rate of 15.39 ± 7.39 myr− 1 from 1994 to 2001, which differs from the findings of the current study. This variance can be attributed to differences in sample selection and observation periods between the two studies. According to Garg et al. (2017a), the retreat magnitude from 2001 to 2015 was 11.29 ± 5.71 myr− 1, which closely aligns with the results of the present study.
Kumar et al. (2021) documented a 10% deglaciation rate in the Upper Rishi Ganga basin of the Central Himalayas between 1980 and 2017. This variation in deglaciation rates could stem from differing climate conditions across various regions within the Central Himalayan zone, as well as disparities in observation periods. Similarly, Bhambri et al. (2011) noted a transition in glacier area from 324.7 ± 8.4 to 306.3 ± 9.5 km2, indicating a deglaciation rate of 0.15 ± 0.07%yr− 1 between 1968 and 2006 in the Garhwal Himalayan region. While lacking formal statistical analyses, their findings notably align with those of the present study.
In the Mt Everest region of the Central Himalayas, retreat rates ranged from 14 ± 3 to 64 ± 5 myr− 1 between 1989 and 2015 (King et al., 2018). Meanwhile, the Gangotri glacier, the largest in the Garhwal Himalayan region, experienced a retreat rate of 17.9 ± 0.5 myr− 1 from 1965 to 2015 (Bhattacharya et al., 2016). The observed retreat magnitude for the Gangotri glacier in the present study was 14.08 myr− 1, slightly lower than that reported by Bhattacharya et al. (2016). This difference may be attributed to higher retreat rates recorded in the 1990s compared to the early 2000s (Bhattacharya et al., 2016; Shukla & Qadir, 2016), influencing the variations between these findings.
Bandyopadhyay et al. (2019) reported an average mass balance of -0.61 m.w.e.yr− 1 between 2000 and 2014 in the Ganga basin. In the Garhwal Himalayan zone, part of the Ganga basin, the magnitude of mass balance ranged from − 0.547 to -1.089 m.w.e.yr− 1 in the current study. The mean mass balance calculated in this study is -0.818 m.w.e.yr− 1, slightly higher than that reported by Bandyopadhyay et al. (2019). This difference may be due to variations in study periods, as Bandyopadhyay et al. (2019) analyzed data up to 2014, while this study extended six years further. Notably, the findings of the previous study fall within the range of mass balance observed in this study, indicating consistency between the two.
Various studies tried to understand the reason behind different glacier responses in the same catchment or river basin scale where uniform intra zonal climatic assumption is valid. Either these studies adopted a nonmathematical subjective method, or others used a single parameter or separate simple linear regression for each parameter (Bhambri et al., 2011; Basnett et al., 2013; Ali et al., 2017; Brahmbhatt et al., 2017; Garg et al., 2017a, b, 2019; Bhattacharya et al., 2023).
However, our current study reveals that glacier area alone does not significantly influence the heterogeneous response. Instead, we observe a robust correlation between glacier area and debris cover (Scherler et al., 2011; Benn et al., 2012; Bolch et al., 2012). Debris cover emerges as a critical parameter in describing heterogeneous responses, as it controls the glacier response pattern to changing climates on an individual glacier basis. Consequently, glacier area serves as a proxy for debris cover extent, with glacier area often credited for its correlation with the percentage of debris cover on mass balance (Supplementary Fig. 4).
Furthermore, numerous prior studies have highlighted debris cover as a constraining factor in elucidating heterogeneous responses, given its role as a protective shield shielding glaciers from the impacts of a warming climate (Rowan et al., 2015; Banerjee & Azam, 2016; Azam et al., 2018). Our current study further substantiates this notion by demonstrating that a greater extent of debris cover contributes to the preservation of glaciers in a steady-state condition within the Garhwal Himalayan region. Moreover, our research contributes to establishing a quantified relationship between debris cover and mass balance, enhancing our understanding of their interplay in glacier dynamics.
The study identifies glacier slope as a crucial parameter in understanding heterogeneous glacier responses. Our analysis reveals an inverse relationship between mass balance and slope, indicating that steeper slopes hinder steady-state or positive mass balance. This finding aligns with previous research by (Garg et al., 2017a) in the Central Himalayan zone, reinforcing our results.
Interestingly, our study presents a contradictory finding to Brun et al. (2019), who reported that glaciers with gentle slopes exhibit more thinning compared to those with steep slopes. The discrepancy may stem from variations in snowfall amounts. Glaciers with steeper slopes, when receiving ample snowfall, efficiently transfer more mass downhill to warmer areas, aiding in maintaining a steady state. However, when such glaciers experience insufficient snowfall, the rapid mass transfer to lower, warmer zones accelerates melting due to higher temperatures. This leads to a reduction in solid mass and compromises the glacier’s ability to maintain a steady state, particularly evident in glaciers with steep slopes experiencing insufficient snowfall.
In the present study, we observed the highest mass loss in glacier G6, reaching − 2.26 m.w.e.yr-1. This glacier features a mean slope of 21.25% and has minimal debris cover, extending to less than 2%. Similarly, glacier G14 exhibits the second-highest mass loss, with a magnitude of -1.74 m.w.e.yr-1, and shares a steep slope of 20.82% with minimal debris cover. The third-highest mass loss, totaling − 1.39 m.w.e.yr-1, was observed in glacier G3. Despite its gentler slope, glacier G3 exhibits a debris cover extent of only 2.8%.
Conversely, G17, G11, and G22 emerged as the most stable glaciers, experiencing minimal mass loss. G11 and G22 have gentle slopes below the sample glaciers’ average, while G17, despite having a mean slope of 16%, exhibits minimal mass loss due to a debris cover percentage exceeding 30%. The impact of higher debris cover predominates over the slope value in minimizing mass loss. Among the two glaciers with minimal mass loss (G11 and G22), both are debris-covered, with average debris cover extents of 10% and 22%, respectively.
The correlation analysis between individual glaciers, slope, and debris cover indicates that glaciers with steeper slopes tend to undergo more significant mass loss. Conversely, debris-covered glaciers show less mass loss to clean glaciers, consistent with the model’s predictions.
6 Conclusions
The current study evaluates the temporal dynamics of glacier presence in the Garhwal Himalayan region by analyzing changes in glacial area and retreat. Inferential statistical methods are employed on a dataset comprising 23 sample glaciers to comprehend the condition of the glaciers fully. Results indicate a consistent reduction in the total sample glacier area, declining at a rate of 1.12% between 2001 and 2021. Furthermore, the 95% confidence intervals for the mean area changes of different epochs, namely the first, second, and third, range from − 0.053 to -0.203, -0.084 to -0.309, and − 0.088 to -0.257%yr− 1, respectively. These intervals imply nearly identical rates of area change across the study period. Similarly, glacier retreat rates exhibit a homogeneous trend, ranging from 7.024 to 14.65 myr− 1, 7.87 to 17.03 myr− 1, and 8.956 to 14.98 myr− 1 for the first to third epochs, respectively, across the entire area of interest. Notably, changes in glacier width emerge as dominant factors influencing glacier area alterations, particularly for smaller glaciers. The study posits that the combination of increased temperatures and decreased precipitation over recent centuries contributes to deglaciation.
Furthermore, the study estimates the magnitude of mass balance in the study area, ranging between − 0.547 to -1.089 m.w.e.yr− 1, with heterogeneity explained by a multivariate regression model. Debris cover and glacier slope are identified as key determinants, with debris cover exhibiting a positive coefficient and glacier slope demonstrating an inverse relationship with mass balance. Specifically, a 10% increase in debris cover corresponds to approximately 0.36 m.w.e.yr− 1 of mass gain, while a similar increase in slope leads to a 0.86 m.w.e.yr− 1 mass loss. The study highlights that glacier area does not exert a significant influence on the heterogeneous response. Instead, a strong correlation emerges between glacier area and debris cover. Debris cover emerges as a pivotal parameter in characterizing heterogeneous responses, as it dictates the glacier response pattern to changing climates on an individual glacier basis. Consequently, glacier area effectively serves as a proxy for debris cover extent.
Moreover, the study suggests avenues for enhancing model accuracy, such as incorporating morphological parameters like glacier surface ice velocity, accumulation area ratio, aspect, and terminus types of the glacier, which were not considered in the current analysis.
Data availability
The dataset used in this study is presented in tabular form in the supplementary section of the.
manuscript. Moreover, upon request, the dataset is also available in shapefile format.
References
Abdi, H. (2007). The method of least squares. Encyclopedia of Measurement and Statistics, 1, 530–532.
Abdullah, T., Romshoo, S. A., & Rashid, I. (2020). The satellite observed glacier mass changes over the Upper Indus Basin during 2000–2012. Scientific Reports, 10(1), 1–9. https://doi.org/10.1038/s41598-020-71281-7.
Albert, T. H. (2002). Evaluation of remote sensing techniques for ice-area classification applied to the tropical Quelccaya Ice Cap, Peru. Polar Geography, 26(3), 210–226. https://doi.org/10.1080/789610193.
Ali, I., Shukla, A., & Romshoo, S. A. (2017). Assessing linkages between spatial facies changes and dimensional variations of glaciers in the upper Indus Basin, western Himalaya. Geomorphology, 284, 115–129. https://doi.org/10.1016/j.geomorph.2017.01.005.
Azam, M. F., Wagnon, P., Berthier, E., Vincent, C., Fujita, K., & Kargel, J. S. (2018). Review of the status and mass changes of Himalayan-Karakoram glaciers. Journal of Glaciology, 64(243), 61–74. https://doi.org/10.1017/jog.2017.86.
Azam, M. F., Kargel, J. S., Shea, J. M., Nepal, S., Haritashya, U. K., Srivastava, S., Maussion, F., Qazi, N., Chevallier, P., Dimri, A. P., Kulkarni, A. V., Cogley, J. G., & Bahuguna, I. (2021). Glaciohydrology of the Himalaya-Karakoram. Science. https://doi.org/10.1126/science.abf3668.
Bandyopadhyay, D., Singh, G., & Kulkarni, A. V. (2019). Spatial distribution of decadal ice-thickness change and glacier stored water loss in the Upper Ganga basin, India during 2000–2014. Scientific Reports, 9(1), 1–9. https://doi.org/10.1038/s41598-019-53055-y.
Banerjee, A., & Azam, M. F. (2016). Temperature reconstruction from glacier length fluctuations in the Himalaya. Annals of Glaciology, 57(71), 189–198. https://doi.org/10.3189/2016AoG71A047.
Basnett, S., Kulkarni, A. V., & Bolch, T. (2013). The influence of debris cover and glacial lakes on the recession of glaciers in Sikkim Himalaya, India. Journal of Glaciology, 59(218), 1035–1046. https://doi.org/10.3189/2013JoG12J184.
Benn, D., Bolch, T., Hands, K., Gulley, J., Luckman, A., Nicholson, L., Quincey, D., Thompson, S., Toumi, R., & Wiseman, S. (2012). Response of debris-covered glaciers in the Mount Everest region to recent warming, and implications for outburst flood hazards. Earth-Science Reviews, 114(1–2), 156–174. https://doi.org/10.1016/j.earscirev.2012.03.008.
Bhambri, R., Bolch, T., Chaujar, R. K., & Kulshreshtha, S. C. (2011). Glacier changes in the Garhwal Himalaya, India, from 1968 to 2006 based on remote sensing. Journal of Glaciology, 57(203), 543–556. https://doi.org/10.3189/002214311796905604.
Bhambri, R., Bolch, T., & Chaujar, R. K. (2012). Frontal recession of Gangotri Glacier, Garhwal Himalayas, from 1965 to 2006, measured through high-resolution remote sensing data. Current Science, 102(3), 489–494. https://doi.org/10.5167/uzh-59630.
Bhambri, R., Schmidt, S., Chand, P., Nüsser, M., Haritashya, U., Sain, K., Tiwari, S. K., & Yadav, J. S. (2023). Heterogeneity in glacier thinning and slowdown of ice movement in the Garhwal Himalaya, India. Science of the Total Environment, 875, 162625. https://doi.org/10.1016/j.scitotenv.2023.162625.
Bhattacharya, A., Bolch, T., Mukherjee, K., Pieczonka, T., Kropáček, J. A. N., & Buchroithner, M. F. (2016). Overall recession and mass budget of Gangotri Glacier, Garhwal Himalayas, from 1965 to 2015 using remote sensing data. Journal of Glaciology, 62(236), 1115–1133. https://doi.org/10.1017/jog.2016.96.
Bhattacharya, A., Bolch, T., Mukherjee, K., King, O., Menounos, B., Kapitsa, V., Neckel, N., Yang, W., & Yao, T. (2021). High Mountain Asian glacier response to climate revealed by multi-temporal satellite observations since the 1960s. Nature Communications, 12(1), 1–13. https://doi.org/10.1038/s41467-021-24180-y.
Bhattacharya, A., Mukherjee, K., King, O., Karmakar, S., Remya, S. N., Kulkarni, A. V., & Bolch, T. (2023). Influence of climate and non-climatic attributes on declining glacier mass budget and surging in Alaknanda Basin and its surroundings. Global and Planetary Change, 230, 104260.
Bolch, T., Kulkarni, A., Kääb, A., Huggel, C., Paul, F., Cogley, J. G., Frey, H., Kargel, J. S., Fujita, K., Scheel, M., Bajracharya, S., & Stoffel, M. (2012). The State and Fate of Himalayan glaciers. Science. https://doi.org/10.1126/science.1215828.
Bookhagen, B., & Burbank, D. W. (2010). Toward a complete himalayan hydrological budget: Spatiotemporal distribution of snowmelt and rainfall and their impact on river discharge. Journal of Geophysical Research: Earth Surface, 115(F3). https://doi.org/10.1029/2009JF001426.
Brahmbhatt, R. M., Bahuguna, I. M., Rathore, B. P., Kulkarni, A. V., Shah, R. D., Rajawat, A. S., & Kargel, J. S. (2017). Significance of glacio-morphological factors in glacier retreat: A case study of part of Chenab basin, Himalaya. Journal of Mountain Science, 14, 128–141. https://doi.org/10.1007/s11629-015-3548-0.
Brun, F., Berthier, E., Wagnon, P., Kääb, A., & Treichler, D. (2017). A spatially resolved estimate of High Mountain Asia glacier mass balances from 2000 to 2016. Nature Geoscience, 10(9), 668–673. https://doi.org/10.1038/ngeo2999.
Brun, F., Wagnon, P., Berthier, E., Jomelli, V., Maharjan, S. B., Shrestha, F., & Kraaijenbrink, P. D. A. (2019). Heterogeneous influence of glacier morphology on the mass balance variability in High Mountain Asia. Journal of Geophysical Research: Earth Surface, 124(6), 1331–1345.
Cauv Cauvy-Fraunié, S., & Dangles, O. (2019). A global synthesis of biodiversity responses to glacier retreat. Nature Ecology & Evolution, 3(12), 1675–1685. https://doi.org/10.1038/s41559-019-1042-8.
Cleophas, T. J., Zwinderman, A. H., Cleophas, T. J., & Zwinderman, A. H. (2016). Non-parametric tests for three or more samples (Friedman and Kruskal-Wallis). Clinical data analysis on a pocket calculator: understanding the scientific methods of statistical reasoning and hypothesis testing, 193–197.https://doi.org/10.1007/978-3-319-27104-0_34.
De Kok, R. J., Kraaijenbrink, P. D., Tuinenburg, O. A., Bonekamp, P. N., & Immerzeel, W. W. (2020). Towards understanding the pattern of glacier mass balances in High Mountain Asia using regional climatic modelling. The Cryosphere, 14(9), 3215–3234. https://doi.org/10.5194/tc-14-3215-2020.
Dobhal, D. P., Mehta, M., & Srivastava, D. (2013). Influence of debris cover on terminus retreat and mass changes of Chorabari Glacier, Garhwal region, Central Himalaya, India. Journal of Glaciology, 59(217), 961–971. https://doi.org/10.3189/2013JoG12J180.
Duval, C. Z., R. D., & Duvall, R. (1993). Bootstrapping: A nonparametric approach to statistical inference (No. 95). sage.
Endo, T., Watanabe, T., & Yamamoto, A. (2015). Confidence interval estimation by bootstrap method for uncertainty quantification using random sampling method. Journal of Nuclear Science and Technology, 52(7–8), 993–999. https://doi.org/10.1080/00223131.2015.1034216.
Frey, H., Machguth, H., Huss, M., Huggel, C., Bajracharya, S., Bolch, T., & Stoffel, M. (2014). Estimating the volume of glaciers in the himalayan–Karakoram region using different methods. The Cryosphere, 8(6), 2313–2333. https://doi.org/10.5194/tc-8-2313-2014.
Friedman, M. (1937). The use of ranks to avoid the assumption of normality implicit in the analysis of variance. Journal of the American Statistical Association, 32(200), 675–701. https://doi.org/10.1080/01621459.1937.10503522.
Garg, P. K., Shukla, A., & Jasrotia, A. S. (2017a). Influence of topography on glacier changes in the Central Himalaya, India. Global and Planetary Change, 155, 196–212. https://doi.org/10.1016/j.gloplacha.2017.07.007.
Garg, P. K., Shukla, A., Tiwari, R. K., & Jasrotia, A. S. (2017b). Assessing the status of glaciers in part of the Chandra basin, Himachal Himalaya: A multiparametric approach. Geomorphology, 284, 99–114. https://doi.org/10.1016/j.geomorph.2016.10.022.
Garg, P. K., Shukla, A., & Jasrotia, A. S. (2019). On the strongly imbalanced state of glaciers in the Sikkim, eastern Himalaya, India. Science of the Total Environment, 691, 16–35. https://doi.org/10.1016/j.scitotenv.2019.07.086.
Garg, P. K., Prajapati, M., Shukla, A., Guha, S., & Ali, I. (2024). Annual velocities of the ablation zone of Panchi Nala Glacier, western Himalaya: Trends and controlling factors. Polar Science, 101068.
Guha, S., & Tiwari, R. K. (2022). Analysis of differential glacier behaviour in Sikkim Himalayas in view of changing climate. Geocarto International, 37(27), 16020–16042. https://doi.org/10.1080/10106049.2022.2105403.
Guha, S., & Tiwari, R. K. (2023). Analyzing geomorphological and topographical controls for the heterogeneous glacier mass balance in the Sikkim Himalayas. Journal of Mountain Science, 20(7), 1854–1864. https://doi.org/10.1007/s11629-022-7829-0.
Guha, S., Tiwari, R. K., & Pratap, A. (2024). Divergent temporal glacier responses in the Chandra-Bhaga and Suru-Zanskar basins of the Indian Western Himalaya. Remote Sensing Applications: Society and Environment, 101179.
Gusain, H. S., Kala, M., Ganju, A., Mishra, V. D., & Snehmani (2015). Observations of snow–meteorological parameters in Gangotri glacier region. Current Science, 109(11), 2116–2120. https://www.jstor.org/stable/24906712.
Hanshaw, M. N., & Bookhagen, B. (2014). Glacial areas, lake areas, and snow lines from 1975 to 2012: Status of the Cordillera Vilcanota, including the Quelccaya Ice Cap, northern central Andes, Peru. The Cryosphere, 8(2), 359–376. https://doi.org/10.5194/tc-8-359-2014.
Harris, I., Osborn, T. J., Jones, P., & Lister, D. (2020). Version 4 of the CRU TS monthly high-resolution gridded multivariate climate dataset. Scientific data, 7(1), 109. https://doi.org/10.1038/s41597-020-0453-3.
Haukoos, J. S., & Lewis, R. J. (2005). Advanced statistics: Bootstrapping confidence intervals for statistics with difficult distributions. Academic Emergency Medicine, 12(4), 360–365. https://doi.org/10.1197/j.aem.2004.11.018.
Hugonnet, R., McNabb, R., Berthier, E., Menounos, B., Nuth, C., Girod, L., & Kääb, A. (2021). Accelerated global glacier mass loss in the early twenty-first century. Nature, 592(7856), 726–731. https://doi.org/10.1038/s41586-021-03436-z.
Huss, M. (2013). Density assumptions for converting geodetic glacier volume change to mass change. TheCryosphere, 7(3), 877–887.
Immerzeel, W. W., Van Beek, L. P., & Bierkens, M. F. (2010). Climate change will affect the Asian water towers. Science, 328(5984), 1382–1385. https://doi.org/10.1126/science.1183188.
IPCC. (2014). Climate Change 2014: Impacts, adaptation, and vulnerability. Part B: Regional aspects. Cambridge University Press.
IPCC. Ipcc Special Report on The Ocean and Cryosphere in A Changing Climate (Eds Pörtner, H. O. Et Al.) (IPCC, 2019).
IPCC (Intergovernmental Panel on Climate Change). (2001). Third Assessment Report. Working Group I. Cambridge. Cambridge University Press.
James, G., Witten, D., Hastie, T., & Tibshirani, R. (2013). An introduction to statistical learning (Vol. 112, p. 18). New York: springer. https://doi.org/10.1007/978-1-0716-1418-1.
Kaushik, S., Dharpure, J. K., Joshi, P. K., Ramanathan, A. L., & Singh, T. (2020). Climate change drives glacier retreat in Bhaga basin located in Himachal Pradesh, India. Geocarto International, 35(11), 1179–1198. https://doi.org/10.1080/10106049.2018.1557260.
King, O., Dehecq, A., Quincey, D., & Carrivick, J. (2018). Contrasting geometric and dynamic evolution of lake and land-terminating glaciers in the Central Himalaya. Global and Planetary Change, 167, 46–60. https://doi.org/10.1016/j.gloplacha.2018.05.006.
Kriegel, D., Mayer, C., Hagg, W., Vorogushyn, S., Duethmann, D., Gafurov, A., & Farinotti, D. (2013). Changes in glacierisation, climate and runoff in the second half of the 20th century in the Naryn basin, Central Asia. Global and Planetary Change, 110, 51–61. https://doi.org/10.1016/j.gloplacha.2013.05.014.
Kumar, V., Shukla, T., Mehta, M., Dobhal, D. P., Bisht, M. P. S., & Nautiyal, S. (2021). Glacier changes and associated climate drivers for the last three decades, Nanda Devi region, Central Himalaya, India. Quaternary International, 575, 213–226. https://doi.org/10.1016/j.quaint.2020.06.017.
Lee, S., & Lee, D. K. (2018). What is the proper way to apply the multiple comparison test? Korean Journal of Anesthesiology, 71(5), 353–360. https://doi.org/10.4097/kja.d.18.00242.
Lin, H., Li, G., Cuo, L., Hooper, A., & Ye, Q. (2017). A decreasing glacier mass balance gradient from the edge of the Upper Tarim Basin to the Karakoram during 2000–2014. Scientific Reports, 7(1), 6712. https://doi.org/10.1038/s41598-017-07133-8.
Marshall, G., & Jonker, L. (2011). An introduction to inferential statistics: A review and practical guide. Radiography, 17(1), e1–e6. https://doi.org/10.1016/j.radi.2009.12.006.
McCrum-Gardner, E. (2008). Which is the correct statistical test to use? British Journal of Oral and Maxillofacial Surgery, 46(1), 38–41. https://doi.org/10.1016/j.bjoms.2007.09.002.
Mir, R. A., & Majeed, Z. (2018). Frontal recession of Parkachik Glacier between 1971–2015, Zanskar Himalaya using remote sensing and field data. Geocarto International, 33(2), 163–177. https://doi.org/10.1080/10106049.2016.1232439.
Napierala, M. A. (2012). What is the Bonferroni correction? AAOS Now, 40. https://link.gale.com/apps/doc/A288979427/HRCA?u=anon~6eb9a78d&sid=googleScholar&xid=373b65d4
#x200B;Noguchi, K., Gel, Y. R., Brunner, E., & Konietschke, F. (2012). nparLD: An R Software Package for the Nonparametric Analysis of Longitudinal Data in Factorial experiments. Journal of Statistical Software, 50(12). https://doi.org/10.18637/jss.v050.i12.
Nuimura, T., Fujita, K., Yamaguchi, S., & Sharma, R. R. (2012). Elevation changes of glaciers revealed by multitemporal digital elevation models calibrated by GPS survey in the Khumbu region, Nepal Himalaya, 1992–2008. Journal of Glaciology, 58(210), 648–656. https://doi.org/10.3189/2012JoG11J061.
Nuth, C., & Kääb, A. (2011). Co-registration and bias corrections of satellite elevation data sets for quantifying glacier thickness change. The Cryosphere, 5(1), 271–290. https://doi.org/10.5194/tc-5-271-2011.
Pandey, A. C., Ghosh, S., & Nathawat, M. S. (2011). Evaluating patterns of temporal glacier changes in Greater himalayan range, Jammu & Kashmir, India. Geocarto International, 26(4), 321–338. https://doi.org/10.1080/10106049.2011.554611.
Pellicciotti, F., Stephan, C., Miles, E., Herreid, S., Immerzeel, W. W., & Bolch, T. (2015). Mass-balance changes of the debris-covered glaciers in the Langtang Himal, Nepal, from 1974 to 1999. Journal of Glaciology, 61(226), 373–386. https://doi.org/10.3189/2015JoG13J237.
Pellitero, R., Rea, B. R., Spagnolo, M., Bakke, J., Hughes, P., Ivy-Ochs, S., & Ribolini, A. (2015). A GIS tool for automatic calculation of glacier equilibrium-line altitudes. Computers & Geosciences, 82, 55–62. https://doi.org/10.1016/j.cageo.2015.05.005.
Pieczonka, T., Bolch, T., Junfeng, W., & Shiyin, L. (2013). Heterogeneous mass loss of glaciers in the Aksu-Tarim Catchment (Central Tien Shan) revealed by 1976 KH-9 Hexagon and 2009 SPOT-5 stereo imagery. Remote Sensing of Environment, 130, 233–244. https://doi.org/10.1016/j.rse.2012.11.020.
Pratap, B., Dobhal, D. P., Mehta, M., & Bhambri, R. (2015). Influence of debris cover and altitude on glacier surface melting: A case study on Dokriani Glacier, Central Himalaya, India. Annals of Glaciology, 56(70), 9–16. https://doi.org/10.3189/2015AoG70A971.
Ramsankaran, R. A. A. J., Pandit, A., & Parla, A. (2019). Decadal estimates of surface mass balance for glaciers in Chandra Basin, Western Himalayas, India—A geodetic approach. Climate Change Signals and Response: A Strategic Knowledge Compendium for India, 109–125. https://doi.org/10.1126/science.1072497.
Romshoo, S. A., Abdullah, T., Rashid, I., & Bahuguna, I. M. (2022). Explaining the differential response of glaciers across different mountain ranges in the north-western Himalaya, India. Cold Regions Science and Technology, 196, 103515. https://doi.org/10.1016/j.coldregions.2022.103515.
Rowan, A. V., Egholm, D. L., Quincey, D. J., & Glasser, N. F. (2015). Modelling the feedbacks between mass balance, ice flow and debris transport to predict the response to climate change of debris-covered glaciers in the Himalaya. Earth and Planetary Science Letters, 430, 427–438. https://doi.org/10.1016/j.epsl.2015.09.004.
Sahu, R., & Gupta, R. D. (2020). Glacier mapping and change analysis in Chandra basin, Western Himalaya, India during 1971–2016. International Journal of Remote Sensing, 41(18), 6914–6945. https://doi.org/10.1080/01431161.2020.1752412.
Sanders, K., Sheard, J., Becker, B. A., Eckerdal, A., Hamouda, S., & Simon (2019, July). Inferential statistics in computing education research: A methodological review. In Proceedings of the 2019 ACM conference on international computing education research (pp. 177–185). https://doi.org/10.1145/3291279.3339408.
Scherler, D., Bookhagen, B., & Strecker, M. R. (2011). Spatially variable response of himalayan glaciers to climate change affected by debris cover. Nature Geoscience, 4(3), 156–159. https://doi.org/10.1038/ngeo1068.
Shean, D. E., Bhushan, S., Montesano, P., Rounce, D. R., Arendt, A., & Osmanoglu, B. (2020). A systematic, regional assessment of high mountain Asia glacier mass balance. Frontiers in Earth Science, 7, 363. https://doi.org/10.3389/feart.2019.00363.
Shukla, A., & Qadir, J. (2016). Differential response of glaciers with varying debris cover extent: Evidence from changing glacier parameters. International Journal of Remote Sensing, 37(11), 2453–2479. https://doi.org/10.1080/01431161.2016.1176272.
Stoffel, M., & Huggel, C. (2012). Effects of climate change on mass movements in mountain environments. Progress in Physical Geography, 36(3), 421–439. https://doi.org/10.1177/0309133312441010.
Tibshirani, R. J., & Efron, B. (1993). An introduction to the bootstrap. Monographs on Statistics and Applied Probability, 57(1). https://doi.org/10.1201/9780429246593.
Tiwari, R. K., Garg, P. K., Saini, V., & Shukla, A. (2016). Comparisons of different methods for debris covered glacier classification, in: Khanbilvardi, R., Ganju, A., Rajawat, A.S., Chen, J.M. (Eds.),. p. 98771K. https://doi.org/10.1117/12.2227115.
Yan, L., & Roy, D. P. (2021). Improving Landsat Multispectral scanner (MSS) geolocation by least-squares-adjustment based time-series co-registration. Remote Sensing of Environment, 252, 112181. https://doi.org/10.1016/j.rse.2020.112181.
Zhou, Y., Li, Z., Li, J. I. A., Zhao, R., & Ding, X. (2019). Geodetic glacier mass balance (1975–1999) in the central Pamir using the SRTM DEM and KH-9 imagery. Journal of Glaciology, 65(250), 309–320. https://doi.org/10.1017/jog.2019.8.
Zhu, J., Wen, C., Zhu, J., Zhang, H., & Wang, X. (2020). A polynomial algorithm for best-subset selection problem. Proceedings of the National Academy of Sciences, 117(52), 33117–33123.
Zimmerman, D. W., & Zumbo, B. D. (1993). Relative power of the Wilcoxon test, the Friedman test, and repeated-measures ANOVA on ranks. The Journal of Experimental Education, 62(1), 75–86. https://doi.org/10.1080/00220973.1993.9943832.
Acknowledgements
S.G and R.K.T express gratitude to the authorities at IIT Ropar for their support and provision of facilities for conducting this study. We extend our appreciation to USGS for granting access to Landsat data, the SRTM Data portal for providing SRTM Data, Earthdata for facilitating access to Aster data, and C.T.U. for supplying meteorological data at no cost. S.G would also like to convey sincere thanks to P.K Garg and Soumyajit Roy for their invaluable support throughout the duration of this study.
Author information
Authors and Affiliations
Contributions
S.G identified the research gap and delineated the objectives of the current study. Furthermore, S.G formulated the methodology, and both S.G and R.K.T collaborated on extracting parameters from satellite imagery. S.G performed all statistical analyses under the supervision of R.K.T and G.Z. The manuscript was collectively prepared by S.G, R.K.T, and G.Z.
Corresponding author
Additional information
Publisher’s Note
Springer Nature remains neutral with regard to jurisdictional claims in published maps and institutional affiliations.
Rights and permissions
Springer Nature or its licensor (e.g. a society or other partner) holds exclusive rights to this article under a publishing agreement with the author(s) or other rightsholder(s); author self-archiving of the accepted manuscript version of this article is solely governed by the terms of such publishing agreement and applicable law.
About this article

Cite this article
Guha, S., Tiwari, R.K. & Zhang, G. A Multifaceted Look at Garhwal Himalayan Glaciers: Quantifying Area Change, Retreat, and Mass Balance, and Its Controlling Parameters. Environ Dev Sustain (2024). https://doi.org/10.1007/s10668-024-04917-7
Received:
Accepted:
Published:
DOI: https://doi.org/10.1007/s10668-024-04917-7