
Abstract
Graph is a fundamental data structure that captures relationships between different data entities. In practice, graphs are widely used for modeling complicated data in different application domains such as social networks, protein networks, transportation networks, bibliographical networks, knowledge bases and many more. Currently, graphs with millions and billions of nodes and edges have become very common. In principle, graph analytics is an important big data discovery technique. Therefore, with the increasing abundance of large graphs, designing scalable systems for processing and analyzing large scale graphs has become one of the most timely problems facing the big data research community. In general, scalable processing of big graphs is a challenging task due to their size and the inherent irregular structure of graph computations. Thus, in recent years, we have witnessed an unprecedented interest in building big graph processing systems that attempted to tackle these challenges. In this article, we provide a comprehensive survey over the state-of-the-art of large scale graph processing platforms. In addition, we present an extensive experimental study of five popular systems in this domain, namely, GraphChi, Apache Giraph, GPS, GraphLab and GraphX. In particular, we report and analyze the performance characteristics of these systems using five common graph processing algorithms and seven large graph datasets. Finally, we identify a set of the current open research challenges and discuss some promising directions for future research in the domain of large scale graph processing.
1 Introduction
Recently, people, devices, processes and other entities have been more connected than at any other point in history. In general, the complex relationships, interactions and interdependencies between objects are naturally modeled as graphs. Therefore, graphs have been used to represent data sets in a wide range of application domains, such as social science, astronomy, computational biology, telecommunications, semantic web, protein networks, and many more [3, 32, 35]. In a social graph, for example, nodes correspond to people while friendship relationships between them are represented as edges. In practice, graph analytics is an important and effective big data discovery tool [36]. For example, it enables identifying influential persons in a social network, inspecting fraud operations in a complex interaction network and recognizing product affinities by analyzing community buying patterns [33].
Nowadays, graphs with millions and billions of nodes and edges have become very common. For example, in 2012, Facebook has reported that its social network graph contains more than a billion usersFootnote 1 (nodes) and more than 140 billion friendship relationships (edges). The enormous growth in graph sizes requires huge amounts of computational power to analyze. In practice, scalable processing of large scale graphs is a challenging task due to their size in addition to their inherent irregular structure and the iterative nature of graph processing and computation algorithms.
The popular MapReduce framework [10] and its open source realization, Hadoop,Footnote 2 together with its associated ecosystem (e.g., Pig,Footnote 3 Hive Footnote 4) represent the pervasive technology for big data processing [37]. In principle, the MapReduce framework provides a simple but powerful programming model that enables developers to easily build scalable parallel algorithms to process massive amounts of data on clusters of commodity machines. However, the MapReduce programming model has its own limitations [37]. For example, it does not provide any direct support for iterative data analysis (or equivalently, recursive) tasks. Instead, users need to design iterative jobs by manually chaining multiple MapReduce tasks and orchestrating their execution using a driver program.
In general, graph processing algorithms are iterative and need to traverse the graph in some way [34]. In practice, graph algorithms can be written as a series of chained MapReduce invocations that requires passing the entire state of the graph from one stage to the next. However, this approach is ill-suited for graph processing and leads to inefficient performance due to the additional communication and associated serialization overhead in addition to the need of coordinating the steps of a chained MapReduce. Several approaches have proposed Hadoop extensions (e.g., HaLoop [5], Twister [12], iMapReduce [47]) to optimize the iterative support of the MapReduce framework and other approaches have attempted to implement graph processing operations on top of the MapReduce framework (e.g. Surfer [8], PEGASUS [25]). However, these approaches remain inefficient for the graph processing case because the efficiency of graph computations depends heavily on inter-processor bandwidth as graph structures are sent over the network after each iteration. While most of the data might be unchanged from iteration to iteration, the data must be reloaded and reprocessed at each iteration, resulting in the unnecessary wastage of I/O, network bandwidth, and processor resources. In addition, the termination condition might involve the detection of when a fix point is reached. The condition itself might require an extra MapReduce task on each iteration, again increasing the resource usage in terms of scheduling extra tasks, reading extra data from disk, and moving data across the network.
To solve this inherent performance problem of the MapReduce framework, several specialized platforms which are designed to serve the unique processing requirements of large-scale graph processing have recently emerged. These systems provide programmatic abstractions for performing iterative parallel analysis of large graphs on clustered systems. In particular, in 2010, Google has pioneered this area by introducing the Pregel [30] system as a scalable platform for implementing graph algorithms. Since then, we have been witnessing the development of a large number of scalable graph processing platforms. For example, the Pregel system has been cloned by many open source projects such as Apache Giraph.Footnote 5 and Apache Hama Footnote 6 It has also been further optimized by other systems such as Pregelix [6], Mizan [26] and GPS [38]. In addition, a family of related systems [15, 27, 28] has been initiated by the GraphLab system [28] as an open-source project at Carnegie Mellon University and now is supported by GraphLab Inc.Footnote 7 Furthermore, some other systems have also been introduced such as GraphX [16], Trinity [40], GRACE [45] and Signal/Collect [42].
In practice, experimental evaluation and comparison of various systems which are tackling the same problem is a crucial aspect especially within the applied domains of computer science. In this article, we provide a comprehensive survey of the current state-of-the-art of large scale graph processing platforms and an extensive experimental study of five popular systems in this domain. Specifically, we make the following contributions:
-
We present a comprehensive survey of the state-of-the-art of scalable graph processing platforms. Figure 1 illustrates our classification for the graph processing platforms which we will use in our survey.
-
We present the detailed results of examining the performance characteristics of five scalable graph processing platforms, namely, GraphChi, Apache Giraph, GPS, GraphLab and GraphX using five common graph processing algorithms and seven large graph datasets.
-
For ensuring repeatability as one of the main targets of this work, we provide access to the test datasets and the implementations of the used algorithms in our experiments.Footnote 8
The reminder of this paper is organized as follows. Section 2 provides an overview of the graph processing platforms which have been implemented on top of the MapReduce framework. Sections 3 and 4 cover the Pregel-based family of systems and the GraphLab-based family of systems respectively. Other systems are presented and discussed in Sect. 5. Section 6 describes the details of our experimental setup in terms of the testing environment, datasets and the tested graph algorithms. The detailed results of our experiments are presented in Sect. 7. Discussion of open research challenges and future research directions are presented in Sect. 8. We discuss the related work in Section before 9 we conclude the paper in Sect. 10.

Classification of graph processing platforms
2 Hadoop-based systems
In principle, general-purpose distributed data processing frameworks such as MapReduce [10] are well suited for analyzing unstructured and tabular data. However, such frameworks are not efficient for directly implementing iterative graph algorithms which often require multiple stages of complex joins [37]. In addition, the general-purpose join and aggregation mechanisms defined in such distributed frameworks are not designed to leverage the common patterns and structure in iterative graph algorithms. Therefore, such obliviousness of the graph structure leads to huge network traffic and missed opportunities to fully leverage important graph-aware optimization. Several approaches have attempted to deal with such limitations by implementing graph processing operations on top of the MapReduce/Hadoop framework. For example, the Surfer system [8] has been presented as a large scale graph processing engine which is designed to provide two basic primitives for programmers: MapReduce and propagation. In this engine, MapReduce processes different key-value pairs in parallel, and propagation is an iterative computational pattern that transfers information along the edges from a vertex to its neighbors in the graph. In particular, to use the graph propagation feature in the Surfer system, the user needs to define two functions: transfer and combine. The transfer function is responsible for exporting the information from a vertex to its neighbors, while the combine function is responsible for aggregating the received information at each vertex. In addition, the Surfer system adopts a graph partitioning strategy that attempts to divide the large graph into many partitions of similar sizes so that each machine can hold a number of graph partitions and manage the propagation process locally before exchanging messages and communicating with other machines. As a result, the propagation process can exploit the locality of graph partitions for minimizing the network traffic.
GBASE Footnote 9 is another MapReduce-based system that uses a graph storage method, called block compression, which first partitions the input graph into a number of blocks [22]. According to the partition results, GBASE reshuffles the nodes so that the nodes belonging to the same partition are placed near to each other after which it compresses all non-empty block through a standard compression mechanism such as GZip.Footnote 10 Finally, it stores the compressed blocks together with some meta information into the graph storage. GBASE supports different types of graph queries including neighborhood, induced subgraph, egonet, K-core and cross-edges. To achieve this goal, GBASE applies a grid selection strategy to minimize disk accesses and answer queries by applying a MapReduce-based algorithm that supports incidence matrix based queries. Finally, PEGASUS Footnote 11 is a large scale graph mining library that has been implemented on top of the Hadoop framework and supports performing typical graph mining tasks such as computing the diameter of the graph, computing the radius of each node and finding the connected components via using Generalized Iterative Matrix-Vector multiplication (GIM-V) which represents a generalization of normal matrix-vector multiplication [24, 25]. The library has been utilized for implementing a MapReduce-based algorithm for discovering patterns on near-cliques and triangles on large scale graphs [23].
3 Pregel-based systems
Bulk Synchronous Parallel (BSP) is a parallel programming model that uses a message passing interface (MPI) to address the scalability challenge of parallelizing jobs across multiple nodes [44]. In principle, BSP is a vertex-centric programming model where the computation on vertices are represented as a sequence of supersteps with synchronization between the nodes participating at superstep barriers (Fig. 2) and each vertex can be active or inactive at each iteration (superstep). Such a programming model can be seen as a graph extension of the actors programming model [9] where each vertex represents an actor and edges represent the communication channel between actors. In such model, users can focus on specifying the computation on the graph nodes and the communication among them without worrying about the specifics of the underlying organization or resource allocation of the graph data. The Pregel system [30], introduced by Google and implemented in C/C++, is recognized as the first BSP implementations that provides a native API specifically for programming graph algorithms using a ”think like a vertex” computing paradigm. To avoid communication overheads, Pregel preserves data locality by ensuring computation is performed on locally stored data. In particular, Pregel distributes the graph vertices to the different machines of the cluster where each vertex and its associated set of neighbors are assigned to the same node. Graph processing algorithms are then represented as supersteps where each step defines what each participating vertex has to compute and edges between vertices represent communication channels for transmitting computation results from one vertex to another. In particular, at each superstep, a vertex can execute a user-defined function, send or receive messages to its neighbours (or any other vertex with a known ID), and change its state from active to inactive. Each superstep ends with a synchronization barrier (Fig. 2), which ensures that messages sent from one superstep are correctly delivered to the subsequent step. In each superstep, a vertex may vote to halt (inactive status) if it does not receive any message and it can also be re-activated once it receives a message at any subsequent superstep. The whole graph processing operation terminates when all vertices are inactive and no more messages are in transit between the vertices of the graph. In Pregel, the input graph is loaded once at the beginning of the program and all computations are executed in-memory. Pregel uses a master/workers model where the master node is responsible for coordinating synchronization at the superstep barriers while each worker independently invokes and executes the compute() function on the vertices of its assigned portion of the graph and maintains the message queue to receive messages from the vertices of other workers.

BSP programming model
The introduction of Google’s Pregel has triggered much interest in the field of large-scale graph data processing and inspired the development of several Pregel-based systems which have been attempting to exploit different optimization opportunities. For example, Apache Giraph is an open source project that clones the ideas and implementation of Pregel specification in Java on top of the infrastructure of the Hadoop framework. In principle, the relationship between the Pregel system and Giraph project is similar to the relationship between the MapReduce framework and the Hadoop project. Giraph has been initially implemented by Yahoo!. Later, Facebook built its Graph Search services using Giraph. Giraph runs graph processing jobs as map-only jobs on Hadoop and uses HDFS for data input and output. Giraph also uses Apache ZooKeeper Footnote 12 for coordination, checkpointing, and failure recovery schemes. Apache Hama is another BSP-based implementation project which is designed to run on top of the Hadoop infrastructure, like Giraph. However, it focuses on general BSP computations and not only for graph processing. For example, it includes algorithms for matrix inversion and linear algebra.
GPS Footnote 13 is another open source Java implementation of Google’s Pregel which comes from Stanford InfoLab [38]. GPS extends the Pregel API to allow certain global computation tasks to be specified and run by a master worker. In particular, it provides an additional function, master.compute(), that provides access to all of the global aggregated values, and store the global values which are transparent to the vertices. The global aggregated values can be updated before they are broadcast to the workers. GPS also offers the Large Adjacency List Partitioning (LALP) mechanism as an optional performance optimization for algorithms that send the same message to all of its neighbours. In particular, LALP works by partitioning the adjacency lists of high-degree vertices across different workers. For each partition of the adjacency list of a high-degree vertex, a mirror of the vertex is created in the worker that keeps the partition. When a high-degree vertex broadcasts a message to its neighbors, at most one message is sent to its mirror at each machine. Then, the message is forwarded to all its neighbors in the partition of the adjacency list of the high-degree vertex. This mechanism works well for algorithms like PageRank, weakly connected components (WCC), and single source shortest path (SSSP) with unit edge weights but does not work well for some other algorithms like distributed minimal spanning tree construction (DMST). Furthermore, GPS applies a dynamic repartitioning strategy based on the graph processing workload in order to balance the workload among all workers and reduce the number of exchanged messages over the network. In particular, GPS exchanges vertices between workers based on the amount of data sent by each vertex. Similar to GPS, Mizan is an open-source project developed in C++ by KAUST, in collaboration with IBM Research [26]. Mizan’s dynamic repartitioning strategy is based on monitoring the runtime characteristics of the graph vertices (e.g., their execution time, and incoming and outgoing messages) and uses this information, at the end of every superstep, to construct a migration plan with the aims of minimizing the variations across workers by identifying which vertices to migrate and where to migrate them to. Pregel+ Footnote 14 is another Pregel-based project implemented in C/C++ with the aim of reducing the number of exchanged messages between the worker nodes using a mirroring mechanism. In particular, Pregel+ selects the vertices for mirroring based on a cost model that analyzes the tradeoff between mirroring and message combining.
Pregelix Footnote 15 is a large-scale graph processing platform that applies set-oriented, iterative dataflow approach to implement the BSP-based Pregel programming model [6]. In particular, Pregelix treats the messages and vertex states in the graph computation as relational tuples with a well-defined schema and uses relational database-style query evaluation techniques to execute the graph computation. For example, Pregelix treats message exchange as a join operation followed by a group-by operation that embeds functions which capture the semantics of the graph computation program. Therefore, Pregelix generates a set of alternative physical evaluation strategies for each graph computation program and uses a cost model to select the target execution plan among them. The execution engine of Pregelix is Hyracks [4], a general-purpose shared-nothing dataflow engine. Given a graph processing job, Pregelix first loads the input graph dataset (the initial Vertex relation) from a distributed file system, i.e., HDFS, into a Hyracks cluster and partitions it using a user-defined partitioning function across the worker machines. Pregelix leverages B-tree index structures from the Hyracks storage library to store partitions of Vertex on worker machines. During the supersteps, at each worker node, one (or more) local indexes are used to store one (or more) partitions of the Vertex relation. After the eventual completion of the overall graph computation, the partitioned Vertex relation is scanned and dumped back to HDFS. Giraph++ [43] has proposed a think like a graph programming paradigm that opens the partition structure to the users so that it can be utilized within a partition in order to bypass the heavy message passing or scheduling facilities. In particular, the graph-centric model can make use of the off-the-shelf sequential graph algorithms in distributed computation, allows asynchronous computation to accelerate convergence rates, and naturally support existing partition-aware parallel/distributed algorithms.
4 GraphLab family
GraphLab [28] is an open-source large scale graph processing project, implemented in C++, which started at CMU and is currently supported by GraphLab Inc. Unlike Pregel, GraphLab relies on the shared memory abstraction and the GAS (Gather, Apply, Scatter) processing model which is similar to but also fundamentally different from the BSP model that is employed by Pregel. The GraphLab abstraction consists of three main parts: the data graph, the update function, and the sync operation. The data graph represents a user-modifiable program state that both stores the mutable user-defined data and encodes the sparse computational dependencies. The update function represents the user computation and operates on the data graph by transforming data in small overlapping contexts called scopes. In the GAS model, a vertex collects information about its neighbourhood in the Gather phase, performs the computations in the Apply phase, and updates its adjacent vertices and edges in the Scatter phase. As a result, in GraphLab, graph vertices can directly pull their neighbours’ data (via Gather) without the need to explicitly receive messages from those neighbours. In contrast, in the BSP model of Pregel, a vertex can learn its neighbours’ values only via the messages that its neighbours push to it. GraphLab offers two execution modes: synchronous and asynchronous. Like BSP, the synchronous mode uses the notion of communication barriers while the asynchronous mode does not support the notion of communication barriers or supersteps. It uses distributed locking to avoid conflicts and to maintain serializability. In particular, GraphLab automatically enforces serializability by preventing adjacent vertex programs from running concurrently by using a fine-grained locking protocol that requires sequentially grabbing locks on all neighbouring vertices.
To avoid the imbalanced workload caused by high degree vertices in power-law graphs, another member of the GraphLab family of systems, PowerGraph [15], has been introduced to tackle this challenge. In particular, PowerGraph introduced a partitioning scheme that cuts the vertex set in a way such that the edges of a high-degree vertex are handled by multiple workers. Therefore, as a tradeoff, vertices are replicated across workers, and communication among workers are required to guarantee that the vertex value on each replica remains consistent. PowerGraph eliminates the degree dependence of the vertex-program by directly exploiting the GAS decomposition to factor vertex-programs over edges. Therefore, it is able to retain the think-like-a-vertex programming style while distributing the computation of a single vertex-program over the entire cluster. In principle, PowerGraph attempts to merge the best features from both Pregel and GraphLab. From GraphLab, PowerGraph inherits the data-graph and shared-memory view of computation eliminating the need for users to specify the communication of information. From Pregel, PowerGraph borrows the commutative, associative gather concept. PowerGraph supports both the highly-parallel bulk-synchronous Pregel model of computation as well as the computationally efficient asynchronous GraphLab model of computation.
Another member of the GraphLab family of systems is GraphChi [27]. Unlike the other distributed members of the family, GraphChi,Footnote 16 implemented in C++, is a centralized system that can process massive graphs from secondary storage in a single machine. In particular, GraphChi relies on a Parallel Sliding Windows (PSW) mechanism for processing very large graphs from disk. PSW is designed to require only a very small number of non-sequential accesses to the disk, and thus it can perform well on both SSDs and traditional hard drives. PSW partitions the input graph into subgraphs, called shards. In each shard, edges are sorted by the source IDs and loaded into memory sequentially. In addition, GraphChi supports a selective scheduling mechanism that attempts to converge faster on some parts of the graph especially on those where the change on values is significant. The main advantage of systems like GraphChi is that it avoids the challenge of finding efficient graph cuts that are balanced and can minimize the communication between the workers, which is a hard challenge. It also avoids other challenges of distributed systems such as cluster management and fault tolerance.
5 Other systems
In addition to the families of Hadoop-, Pregel- and GraphLab-based systems, some other systems have been introduced. For example, Trinity Footnote 17 is a memory-based distributed system which focuses on optimizing memory and communication cost under the assumption that the whole graph is partitioned across a memory cloud [40]. Trinity is designed to support fast graph exploration as well as efficient parallel graph computations. In particular, Trinity organizes the memory of multiple machines into a globally addressable, distributed memory address space (a memory cloud) to support large graphs. In addition, Trinity leverages graph access patterns in both online and offline computation to optimize memory and communication for best performance. A Trinity system consists of slaves, proxies, and clients. A Trinity slave stores graph data and performs computation on the data. Specifically, each slave stores a portion of the data and processes messages received from other slaves, proxies, or clients. A Trinity proxy only handles messages but does not own any data. It usually serves as a middle tier between slaves and clients. A Trinity client is responsible for enabling users to interact with the Trinity cluster. It is a user interface tier between the Trinity system and end-users. The memory cloud is essentially a distributed key-value store which is supported by a memory storage module and a message passing framework. Trinity supports a language called TSL (Trinity specification language) that bridges the graph model and the data storage. Due to the diversity of graphs and the diversity of graph applications, it is usually hard to support efficient general purpose graph computation using a fixed graph schema. Therefore, instead of using a fixed graph schema with fixed computation models, Trinity let users define the graph schema, communication protocols, and computation paradigms through TSL.
Signal/Collect Footnote 18 is a vertex-centric programming model where graph algorithms are decomposed into two operations on a vertex: (1) signaling along edges to inform neighbours about changes in vertex state and (2) collecting the received signals to update the vertex state [42]. In the Signal/Collect programming model, all computations are executed on a compute graph, where the vertices are the computational units that interact by the means of signals that flow along the edges. Vertices collect the signals and perform some computation on them and then signal their neighbors in the compute graph. Signal/Collect supports both synchronous and asynchronous scheduling of the signal and collect operations. It can also both parallelise computations on multiple processor cores, as well as distribute computations over a commodity cluster. Internally, the system uses the Akka Footnote 19 distributed actor framework for message passing. The scheduling of operations and message passing is done within workers. A vertex stores its outgoing edges, but neither the vertex nor its outgoing edges have access to the target vertices of the edges. In order to efficiently support parallel and distributed executions, modifications to target vertices from the model are translated into messages that are passed via a message bus. Every worker and the coordinator have one pluggable message bus each that takes care of sending signals and translating graph modifications to messages. At the execution time, the graph is partitioned by using a hash function on the vertex ids. In addition, in order to balance the partitions, Signal/Collect employs the optimizations introduced by GPS [38] (see Sect. 3). The default storage implementation of Signal/Collect keeps the vertices in memory for fast read and write access. In principle, graph loading can be done sequentially from a coordinator actor or also in parallel, where multiple workers load parts of the graph at the same time. In addition, specific partitions can be assigned to be loaded by particular workers so that each worker can load its own partition which increases the locality of the loading process.
Spark Footnote 20 is a MapReduce-like general data-parallel computation engine which was developed initially at UC Berkeley, in Scala, and is currently released as an Apache project [46]. Spark’s programming model consists of: (1) an in-memory data abstraction called resilient distributed datasets (RDDs) and (2) a set of deterministic parallel operations on RDDs that can be invoked using data primitives, such as map, filter, join, and groupBy. RDDs can either be created from data residing in external storage, such as a distributed file system, or can be derived from existing RDDs by applying one of Spark’s data primitives. RDDs are partitioned across a cluster of machines and each data primitive on RDDs executes in parallel across these machines. A Spark program is a directed acyclic graph of Spark’s primitives, which are applied on a set of initial and derived RDDs. Unlike MapReduce, programmers can perform iterative computations very easily on Spark by using Scala’s loop constructs, such as for and while. In addition, Spark supports interactive computations through the Spark interpreter. GraphX [16] is a distributed graph engine built on top of Spark. GraphX extends Sparks Resilient Distributed Dataset (RDD) abstraction to introduce the Resilient Distributed Graph (RDG), which associates records with vertices and edges in a graph and provides a collection of expressive computational primitives. The GraphX RDG leverages advances in distributed graph representation and exploits the graph structure to minimize communication and storage overhead. While the basic GraphX RDG interface naturally expresses graph transformations, filtering operations, and queries, it does not directly provide an API for recursive graph-parallel algorithms. Instead, the GraphX interface is designed to enable the construction of new graph-parallel APIs. In addition, unlike other graph processing systems, the GraphX API enables the composition of graphs with unstructured and tabular data and allows the same physical data to be viewed both as a graph and as collections without data movement or duplication. GraphX relies on a flexible vertex-cut partitioning to encode graphs as horizontally partitioned collections. By leveraging logical partitioning and lineage, GraphX achieves low-cost fault tolerance. In addition, by exploiting immutability, GraphX reuses indices across graph and collection views and over multiple iterations, reducing memory overhead and improving system performance.
TurboGraph Footnote 21 is a disk-based graph engine which is designed to process billion-scale graphs very efficiently by using modern hardware on a single PC [19]. Therefore, similar to GraphChi, TurboGraph belongs to the centralized category of systems. In particular, TurboGraph is a parallel graph engine that exploits the full parallelism of multicore and FlashSSD IO in addition to the full overlap of CPU processing and I/O processing. By exploiting multi-core CPUs, the system can process multiple CPU jobs at the same time, while by exploiting the FlashSSDs, the system can process multiple I/O requests in parallel by using the underlying multiple flash memory packages. In addition, the system applies a parallel execution model, called pin-and-slide, which implements the column view of the matrix-vector multiplication. By interpreting the matrix-vector multiplication in the column view, the system can restrict the computation to just a subset of the vertices, utilizing two types of thread pools, the execution thread pool and the asynchronous I/O callback thread pool along with a buffer manager. Specifically, given a set of vertices, the systems starts by identifying the corresponding pages for the vertices and then pin those pages in the buffer pool. By exploiting the buffer manager of the storage engine, some pages that were read before can exist in the buffer pool, and the system can guarantee that those pages pinned are to be resident in memory until they are explicitly unpinned. The system then issues parallel asynchronous I/Os to the FlashSSD for pages which are not in the buffer pool. As soon as the I/O request for each page is completed, a callback thread processes the CPU processing of the page. As soon as either an execution thread or a callback thread finishes the processing of a page, it unpins the page, and an execution thread issues an asynchronous I/O request to the FlashSSD. With this mechanism, the system can slide the processing window one page at a time for all pages corresponding to the input vertices. and can fully utilize both CPU and FlashSSD I/O parallelism and fully overlap CPU processing and I/O processing. The GRACE system,Footnote 22 implemented in C++, is another centralized system that has been introduced as a general parallel graph processing framework that provides an iterative synchronous programming model for developers. GRACE follows batch-style graph programming frameworks to insulate users from low level details by providing a high level representation for graph data and letting users specify an application as a set of individual vertex update procedures. The programming model captures data dependencies using messages passed between neighboring vertices like the BSP model. GRACE combines synchronous programming with asynchronous execution for large-scale graph processing by separating application logic from execution policies.
Figure 3 provides a timeline representation of the scalable graph processing systems. It is notable that there has been increasing interest from both industry and academia (especially starting from 2010) on developing and tuning graph-processing algorithms and platforms. Hence, users has started to face the daunting challenge of selecting an appropriate platform for their specific application and requirements. In practice, having a limited understanding of the performance characteristics of the graph-processing platforms can lead to significant time- and effort-loss, and may eventually even limit the growth of the entire domain community. In the following, we report about our experimental evaluation and analysis of the performance characteristics for five popular systems in this domain.

Timeline representation of large scale graph processing platform. Glow rectangles denote Hadoop-based systems, dashed-lined rectangles denote Pregel-based family of system, grey-filled rectangles denote GraphLab-based family of systems and white-filled solid-lined rectangles denote other systems
6 Experimental setup
6.1 Systems and datasets
In our experimental evaluation, we analyze and compare the performance characteristics of five popular systems which the research and industrial community are currently using and building upon, namely, Apache Giraph, GPS, GraphLab, GraphChi and GraphX. The first two systems belong to the Pregel-based family of systems where Giraph represents the popular open source clone implementation for Pregel while GPS is a growing project that has a rapidly increasing user base and one of the popular optimization of the Giraph systems. GraphLab and GraphChi represent the Graphlab-based family of systems where Graphlab is a distributed member while GraphChi is a centralized member of the family. Finally, GraphX has been selected as emerging competitor to these systems which is based on a the rapidly growing SPARK system. It should be also noted that we have excluded the Hadoop-based family of systems from our experiments as they have not shown any usage popularity in the domain of large scale processing of systems. In addition, several studies have shown that the performance inadequacy of Hadoop-based algorithms graph processing [30]. It should be also noted that all selected systems are distributed systems except GraphChi which has been selected as a representative of centralized scalable graph processing systems.
In our experiments for evaluating the performance characteristics of the selected scalable graph processing systems, we have been using the following datasets:
-
Amazon dataset Footnote 23: This dataset consists of reviews from the popular Amazon E-commerce website. The data span a period of 18 years (Jun 1995–Mar 2013), including about 35 million reviews which include product and user information, ratings, and a plain text review. The dataset include 34,686,770 reviews, 6,643,669 users and 2,441,053 products.
-
Friendster dataset Footnote 24: the dataset represents an on-line social gaming network where users can form friendship edge each other.
-
Citation dataset Footnote 25: the U.S. patent dataset spans 37 years (1963–1999), and includes all the patents granted during that period, totaling 3,923,922 patents. The citation graph includes all citations made by patents granted between 1975 and 1999, totaling 16,522,438 citations.
-
Wikitalk dataset Footnote 26: Wikipedia is a well-known open encyclopedia which has been established collaboratively by volunteers across the world. In this encyclopedia, each registered user has a talk page where she and other users can edit in order to communicate and discuss updates to various articles on Wikipedia. The dataset used a complete dump of the Wikipedia page edit history (January 2008) and created a network that contains all the users and discussion from the inception of Wikipedia till January 2008.
-
LUBM dataset Footnote 27: This datasets offers an ontology for academic information (e.g., universities) which is augmented with a data generator that can generate synthetic datasets with different sizes via controlling the number of universities. For the sake of conducting scalability experiment, we used the LUBM data generator to generate three datasets with sizes of 30 K, 40 K and 50 K universities resulting in 700 GB, 950 GB and 1.2 TB of data, respectively.
Table 1 describes the details of the different datasets used in our experiments.
6.2 Workload setup
In order to vary our tests for the different performance characteristics of the evaluated systems, we built a workload that consists of the following three main graph computation and processing algorithms:
-
PageRank: A graph computation that assigns a value to each vertex in the graph according to the number of its incoming/outgoing edges [31].
-
Shortest Path: A graph processing operation to find the path between two vertices in a graph such that the sum of the weights (i.e., number of edges) of its constituent edges is minimized. In our workload, we generated ten instances of this operation. Five instances are used to find the shortest connecting paths between two user nodes and five instances are used to find the shortest connecting paths between two product nodes.
-
Pattern Matching: A graph processing operation to find the existence(s) of a pattern graph (e.g. path, star) in the large graph. We have also generated ten instances of this operation in our workload with different patterns based on the user or product information.
-
Triangle Count: A graph computation that counts the number of triangles in the graph. In other words, it computes the intersection of each vertex’s neighbor list with the neighbor list of each of its neighbors, for all vertices in the graph.
-
Connected Component: A graph computation that identifies the subgraphs in which any two vertices are connected to each other by paths, and which is connected to no additional vertices in the supergraph. In particular, connected components can be considered as a special graph reachability operation that labels all vertices in a connected component with the same label.
The evaluation workload has been implemented using the native API of the evaluated systems. Our implementation of the PageRank and Shortest Path tasks have followed the implementation presented in the original Pregel Paper [30]. For the implementation of the Pattern Matching task, we have followed the approach presented by Fard et al. [13]. Finally, for the implementation of the Triangle Count and Connected Component, we have followed the approach presented by Ediger and Bader [11]. We have released our implementations for the different algorithms using the different evaluated systems on (https://github.com/GraphExperiments/). The algorithms of Giraph and GPS are implemented in Java. The algorithms of GraphLab and GraphChi are implemented in C++. The algorithms of GraphX are implemented in Scala. Table 2 illustrates the version of the tools, Hadoop and Java environments that have been used for the implementation and execution of our experiments.
6.3 Testing environment
We have employed Amazon AWS cloud services for conducting our experiment. Our experiments on the distributed graph processing have utilized a computing cluster that consists of 15 m3.2xLarge Ubuntu 14.04 EC2 instances.Footnote 28 In addition, we have used a single Ubuntu 14.0 c4.8xlarge EC2 instance for evaluating the centralized GraphChi system. For all distributed graph processing systems, the Java heap memory has been set to 4 GB. All of the experiments have been running on EC2 instances in the Amazon Sydney region in order to reduce the effect of potential differences of hardware specifications in different regions. Furthermore, in our evaluation, we were concerned about the variability of performance in EC2 instances [39]. Therefore, each test has been executed 5 times where the longest and shortest execution times for each test were dropped and the average of the remaining three execution times were taken as the results.
EBS volumes have been used as the storage medium for the EC2 instances. Since the maximum capacity of an EBS volume is 1TB and the size of some of the datasets which have been used in our experiments is larger than or nearly equal to 1TB, we have employed RAID0 configuration in order to enable the VMs to utilise more storage and avoid failure due to the low disk space condition. We have employed the Amazon AWS Cloud watch serviceFootnote 29 for monitoring the cluster. AWS Cloud watch was activated for all the instances during the experiments and we have analysed the AWS cloud watch information for CPU Usage, Network traffic, I/O usage and memory usage. AWS Cloud watch does not support memory usage by default. Therefore, we used a scriptFootnote 30 provided by Amazon support in order to enable the instances to report their memory usage to AWS Cloud watch.
6.4 Performance metrics
In Giraph and GraphLab, the execution of graph algorithms goes through three main steps: reading the input graph flow through the execution engine, getting the graph processed, and writing the result as output graphs or values. Therefore, in order to measure and compare the performance characteristics of the two evaluated systems, we used the following metrics:
-
Reading Time: represents the required time for reading the input graph data from the underlying storage layer, partitioning them and loading them into the memory of the different nodes of the computing cluster.
-
Processing Time: represents the required time for executing the graph operation or computation. In particular, this time includes local vertex computation, barrier synchronization, and communication.
-
Writing Time: represents the required time for writing the result to the underlying storage.
-
Total Execution Time: represents the total time for executing the graph operation or computation. In particular, it is the total sum of the reading time, processing time and the writing time.
-
CPU Utilization: represents the average per-node CPU utilization across all nodes of the computing cluster.
-
RAM Usage: represents the average per-node main memory usage across all nodes of the computing cluster.
-
Network Traffic: represents the average per-node usage of network bandwidth for message and data communication across all nodes of the computing clutser.
7 Experimental results
7.1 Execution times
Figures 4, 5, 6, 7 and 8 illustrate the performance comparison between our evaluated systems using our experimental graph datasets (Table 1) and the five tasks of our workload: PageRank (Fig. 4), Shortest Path (Fig. 5), Pattern Matching (Fig. 6), Connected Component (Fig. 7) and Triangle Count (Fig. 8) algorithms. As discussed earlier, the execution of graph algorithms in the evaluated systems goes through three main steps: reading the input, processing the graph and writing the results. As shown in Figs. 4, 5, 6, 7 and 8 , in our experiments, in addition to measuring the total execution time for each task, we have measured the execution times for each of the processing phases in order to characterize the weight for each of these phases with regard to the total execution times. Some key remarks about the results of our experiments are given as follows:
-
The weight of the writing phase is nearly negligible for all systems in all tasks and over all datasets. In particular, the execution time of the writing phase is not consuming any significant time in comparison to the other two phases: reading and processing. For most of the cases, the processing phases is the most time consuming phase with respect to the total execution time. In very few cases of our experiments, the execution time for the reading phase has exceeded the execution time of the processing phase. In particular, in the Pattern Matching task (Fig. 6), for the Friendster (Fig. 6d), LUBM-40K (Fig. 6f) and LUBM-50K (Fig. 6g) datasets, the execution time of the reading phase has exceeded the execution time for the processing phase in all distributed systems (GraphX, Giraph, GPS, GraphLab) while in the LUBM-30K (Fig. 6e) dataset, this case happened only for the Giraph, GPS and GraphLab systems.
Fig. 4 
The execution times metrics for the PrageRank algorithm for all systems using the different datasets
Fig. 5 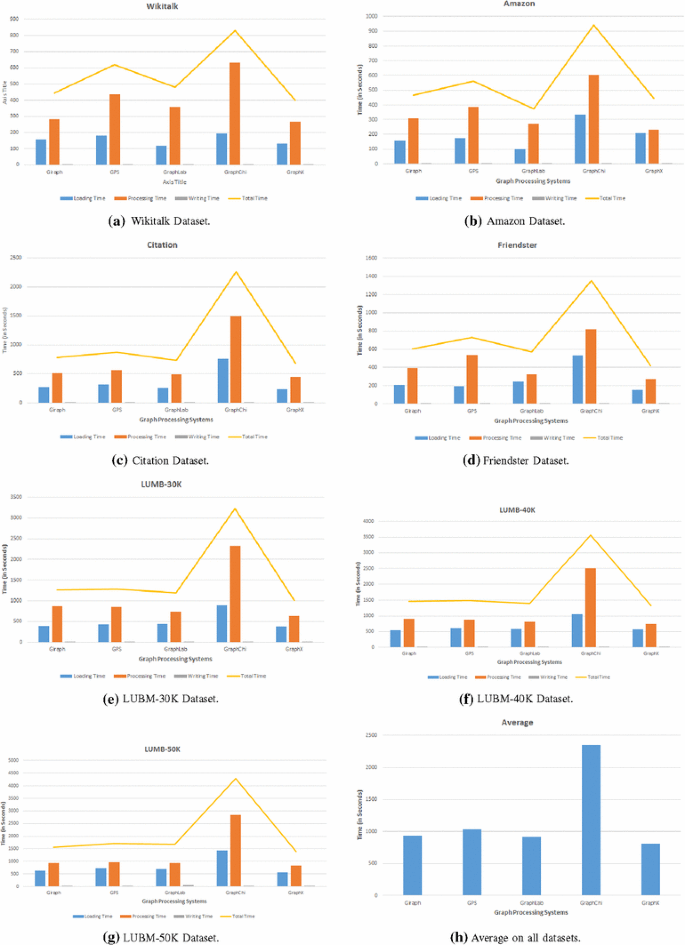
The execution times metrics for the Shortest Path algorithm for all systems using the different datasets
Fig. 6 
The execution times metrics for the Pattern Matching algorithm for all systems using the different datasets
Fig. 7 
The execution times metrics for the Connected Component algorithm for all systems using the different datasets
Fig. 8 
The execution times metrics for the Triangle Count algorithm for all systems using the different datasets
-
As expected, the evaluated centralized system, GraphChi, has shown slower performance in comparison to the rest of the evaluated distributed large scale graph processing systems. For example, the total execution times of the GraphX system has shown to be, on average, about two times faster than GraphChi on the PageRank (Fig. 4h), Triangle Count (Fig. 8h) and Connected Components (Fig. 7h) tasks and about three times faster on the Shortest Path (Fig. 5h) and Pattern Matching (Fig. 6h) tasks.
-
Among the distributed graph processing systems, on average (Figs. 4h, 5h, 6h, 7h, 8h) GraphX, has shown to be the most efficient in terms of the total execution time for all graph processing tasks. On average, the Giraph and GraphLab systems have shown very comparable performance in all tasks while the GPS systems has been slightly slower than them.
-
For the PageRank task (Fig. 4), the GraphX system has shown to be the most efficient for processing all datasets while the GraphChi system has shown to be the slowest on processing all datasets. The GraphLab system has shown to be slightly outperforming the Giraph and GPS systems on processing the Amazon (Fig. 4b), Friendster (Fig. 4d) and LUBM-50K (Fig. 4g) datasets while the Giraph system has shown to be slightly outperforming the GraphLab and GPS systems on processing the Wikitalk (Fig. 4a), Citation (Fig. 4c), LUBM-30K (Fig. 4e) and LUBM-40K (Fig. 4f) datasets.
-
For the Shortest Path task (Fig. 5), the GraphX system has also shown to be the most efficient for processing all datasets while the GraphChi system has also shown to be the slowest on processing all datasets. The GraphLab system has shown to be slightly outperforming the Giraph and GPS systems on processing the Amazon (Fig. 5b), Citation (Fig. 5c), Friendster (Fig. 5d), LUBM-30K (Fig. 5e) and LUBM-40K (Fig. 5f) datasets while the Giraph system has shown to be slightly outperforming the GraphLab and GPS systems on processing the Wikitalk (Fig. 5a) and LUBM-50K (Fig. 5g) datasets.
-
For the Pattern Matching task (Fig. 6), similar to the previous tasks, the GraphX system has shown to be the most efficient for processing all datasets while the GraphChi system has shown to be the slowest on processing all datasets. The GraphLab system has shown to be slightly outperforming the Giraph and GPS systems on processing the Wikitalk (Fig. 6a), Citation (Fig. 6c), LUBM-30K (Fig. 6e) and datasets while the Giraph system has shown to be slightly outperforming the GraphLab and GPS systems on processing the Amazon (Fig. 6b), Friendster (Fig. 6d), LUBM-40K (Fig. 6f) and LUBM-50K (Fig. 6g) datasets.
-
For the Connected Component task (Fig. 7), The GraphLab system has been outperforming the Giraph and GPS systems on processing all datasets except for the Wikitalk dataset (Fig. 7a) where the Giraph system has shown better performance. Similarly, for the Triangle Count task (Fig. 8), The GraphLab system has been outperforming the Giraph and GPS systems on processing all datasets except for the Friendster dataset (Fig. 8d) where the Giraph system has shown better performance.


7.2 RAM usage, network traffic and CPU utilization
Figure 9 illustrates the comparison between our evaluated systems in terms of the main memory usage metric using our experimental graph datasets and the five tasks of our workload: PageRank (Fig. 9a), Shortest Path (Fig. 9b), Pattern Matching (Fig. 9c), Connected Component (Fig. 9d) and Triangle Count (Fig. 9e) algorithms. On average (Fig. 9f), the GraphX system has shown the lowest average RAM usage slightly outperforming the Giraph, GraphLab and GPS while the GraphChi system, as expected as a centralized system, has shown the highest average RAM usage. In principle, the consumption of the RAM usage has been varying from one experiment to another. For example, for the Page Rank task (Fig. 9a), the RAM usage for the GraphX system has been higher than the Giraph and GPS systems for processing the Amazon, Friendster, Citation, LUBM-30K, LUBM-40K and LUBM-50K datasets while it has been lower for processing the Wikitalk dataset. For example, for the Shortest Path task (Fig. 9b), GraphX system has been lower than the Giraph and GPS systems for processing all datasets. For the Pattern Matching task (Fig. 9c), GraphX system has been higher than the Giraph and GPS systems for processing all datasets except the LUBM-50K dataset. Given that each node of cluster has 30 GB of main memory, we believe that the evaluated systems could have better utilized the available main memory for improving their total execution times. On average, the average utilization of the available memory does not exceed 30 %.

The Main Memory Usage metric for all systems using the different algorithms and different datasets
Figure 10 illustrates the comparison between our evaluated systems in terms of the network traffic metric using our experimental graph datasets and the five tasks of our workload: PageRank (Fig. 10a), Shortest Path (Fig. 10b), Pattern Matching (Fig. 10c), Connected Component (Fig. 10d) and Triangle Count (Fig. 10e) algorithms. In this experiment, we have excluded the GraphChi systems as it is a centralized system that involves no data communication between the nodes. On average (Fig. 10f), the GraphX system has shown the lowest netwrok traffic slightly outperforming the Giraph and GraphLab systems while the GPS system has shown the highest network traffic. The comparison between our evaluated systems in terms of the network traffic metric using our experimental graph datasets is illustrated in Fig. 11 for the five tasks of our workload: PageRank (Fig. 11a), Shortest Path (Fig. 11b), Pattern Matching (Fig. 11c), Connected Component (Fig. 11d) and Triangle Count (Fig. 11e) algorithms. On average (Fig. 11f), GraphLab system has shown the lowest CPU utilization slightly lower the Giraph and GraphX systems while the GraphChi system has shown the highest CPU utilization.

The Network Traffic metric for all systems using the different algorithms and different datasets

The CPU Utilization metric for all systems using the different algorithms and different datasets
7.3 Lessons and experience
During our experiments, we have faced a number of challenges that provided us with some lessons and experience which we will discuss in this section. For example, one of the challenges is configuring the Java heap memory size. In principle, there are some formulas for setting the Java heap memory. However, these formulas are not 100 % accurate. In practice, insufficient Java heap memory can negatively affect the performance as CPU will be busy with garbage collection most of the time. On the other hand, over allocation of heap memory prevents the system from using the memory for other tasks. Several pre-experiment tests have been conducted in order to find adequate configuration for the Java heap size.
In principle, installing and setting up the GraphX, GraphChi and GraphLab systems is a fairly straightforward process. For example, the GraphLab system provides scripts to build a cluster on Amazon Cloud service which makes building of a cluster for this purpose on AWS a straightforward task. We needed to build and compile the evaluated systems before we are able to use them. We have faced some issues with compiling the GraphLab and GraphChi systems due to their dependency on several tools. We haves searched several forums and also did many trial and errors processes to compile them. On the other hand, compiling the Apache Giraph with different Hadoop versions and the GraphX system has been relatively straightforward.
In practice, an important feature that facilitates conducting the experiments and debugging process is the logging support and the provided outputs of the experimental systems. Apache Giraph employs the Hadoop logging mechanism and generates useful information for each superstep which enabled us to track the different sections of the experiments more accurately. In addition, there are many available monitoring tools (e.g., AmbariFootnote 31) for the Hadoop framework which can be used for this purpose. Even though other systems also include their own logging solutions, we realized that the Apache Giraph’s logging infrastructure is more adequate than other systems, especially GraphLab and GraphChi.
Regarding the provided API of the various systems, we found that implementing complicated algorithm and reader/writer (i.e., the part of the implementation which is responsible for reading a dataset, loading a graph into the system and writing the output to the disk) with the GraphX and Apache Giraph systems is not complicated mainly due to the nature of Java language (the API language of GraphX is Scala and its syntax is close to Java). In addition, they enable you to run the program locally which makes the debugging procedure quicker. However, we have found that it is a bit more complicated to run the programs with the GPS and GraphLab systems locally.
Finally, both of the Apache Giraph and GPS systems are designed based on the Hadoop framework infrastructure and they are similar to each other in many aspects, for example, the node and edge loaders. Since the performance of Hadoop is affected by its configuration and it has a number of different parameters (e.g., number of mappers, number of reducers, maximum memory for mapper and reducers). Thus, achieving a high performance is not a straightforward process and optimally configuring these metrics needs its own research [21]. In addition, an appropriate configuration for these parameters does not only depend on the size and the type of cluster (i.e, configuration of VMs in a cluster) but also depends on the format, size of dataset and the type of algorithms. These are additional important parameters that needs to be considered for adequately configuring the systems.
8 Open challenges
In this section, based on our survey and experimental study, we shed the lights on some of the research challenges which, we believe, need to be addressed in order to ensure that the vision of designing and implementing successful and scalable graph processing platform can be achieved and can significantly contribute to the goal of conducting efficient and effective graph analytics in different application domains. For example, in the early days of the Hadoop framework, the lack of declarative languages to express the large scale data processing tasks has limited its practicality and the wide acceptance and the usage of the framework [37]. Therefore, several systems (e.g., Pig, Hive, Tenzing [7], HadoopDB [1]) have been introduced to the Hadoop stack to fill this gap and provide higher-level languages for expressing large scale data analysis tasks on Hadoop. In practice, these languages have seen wide adoption in the industry and research communities. Currently the systems/stacks of large scale graph processing platforms are suffering from the same challenge. Therefore, we believe that it is beyond doubt that high level language abstractions that ease the user’s job for expressing their graph processing jobs and enable the underlying systems/stack to perform automatic optimization are crucially required and represent an important research direction to enrich this domain.
In practice, one of the possible scenarios is that users need to execute a computation that combines graph analytics with other analytics techniques. Currently, most of the large scale graph processing platforms have the limitation that they are not able to connect their graph processing capabilities with the vast ecosystem of other analytics systems. Teradata Aster 6.0 [41] have started to tackle this challenge by extending its analytics capabilities with a multi-engine processing architecture which supports bulk synchronous parallel execution, and a specialized graph engine that enables iterative analysis of graph structures. In particular, it allows that graph analytics functions written to the vertex-oriented API as exposed by the graph engine to be invoked from the context of an SQL query and composed with existing SQL-MR functions [14]. However, we believe that further development and research by the different graph processing platforms is still required to tackle this important challenge.
In general, parallelizing graph algorithms with efficient performance is a very challenging and tricky task. In principle, the computation cost is typically driven by the structure of node-edge relations of the underlying graph. Thus, the degree of parallelism is often affected by the number of computation per graph’s node and the communication overhead especially when many edges spawn different graph chunks. In addition, given the common lack of structure of the computation, it becomes very challenging to find the right graph partitioning strategy that can maximize the locality of processing and achieve good load balancing especially with the wide spectrum of graph characteristics of different application domain. Therefore, we believe that it is crucially required to develop adaptive techniques that attempts to automatically optimize the degree of parallelism and partitioning mechanism depending on the characteristics of the underlying graph and with a minimal involvement from the end user.
With the emergence of big graph processing platforms, several studies have attempted to assess the different performance characteristics of these systems using different algorithms, datasets, computing resources and metrics (see Sect. 9). In principle, benchmarks need to play an effective role in empowering users to make better decisions regarding choosing the adequate platforms that suit their application’s requirements. However, in general, designing a good benchmark is a challenging task due to the many aspects that should be considered which can influence the adoption and the usage scenarios of the benchmark. Unfortunately, most of the reported benchmarking studies have been self-designed and there is a clear lack of standard benchmarks that can be employed in this domain. This is a clear gap that we suggest to attract more attention from the research community in order to guide and improve the significance of the outcomes of such evaluation and benchmarking studies.
9 Related work
With the growing number of large scale graph processing systems, users started to face the daunting challenge of selecting an appropriate platform for their specific application and requirements. Guo et al. [18] have identified three dimensions of diversity that complicate the process of gaining knowledge and deeper understanding for the performance of graph-processing platforms: dataset, algorithm, and platform diversity. Dataset diversity is the result of the wide set of application domains for graph data. Algorithm diversity is an outcome of the different goals of processing graphs (e.g. PageRank, subgraph matching, centrality, betweens). Platform diversity is the result of the wide spectrum of systems which are influenced by the wide diversity of infrastructure (compute and storage systems). This has led to platforms which are Hadoop-based, Pregel-based, GraphLab-based and many other systems.
To alleviate this challenge and with the crucial need to understand and analyze the performance characteristics of existing big graph processing systems, several recent studies have been conducted that attempt to achieve this goal. For example, in our previous work, Barnawi et al. [3] have conducted a study to evaluate the performance characteristics of two popular systems, namely, Giraph and GraphLab. The experiments of this study have used three scaling sizes of the Amazon datasetFootnote 32 which consists of reviews from the popular Amazon E-commerce website. The benchmarking workload of the study included three graph computation and processing algorithms: PageRank, shortest path and pattern matching. All the experiments of this study have been conducted on the Amazon EC2 platform. In particular, we used a cluster of 6 large instances for the shortest path and PageRank algorithms. For the pattern matching algorithm, they used a cluster of 7 x-large instances. The study used four metrics to measure and compare the performance characteristics of the two evaluated systems: reading time which represents the required time for reading the input graph data from the underlying storage layer, partitioning them and loading them into the memory of the different nodes of the computing cluster, processing time which represents the required time for executing the graph operation or computation, writing time which represents the required time for writing the result to the underlying storage and total execution time which represents the total time for executing the graph operation or computation. The results from this study show that the performance of the two systems is very comparable for all algorithms or metrics and there is no clear winner. The study also show that the performance of both systems has been found to scale well with the size of the input graph. However, neither system uses the available memory sizes on the computing clusters efficiently. The results also show that the performance of the underlying storage system can clearly affect the performance of the reading phase and consequently the total execution time of the graph processing task. For example, the performance of Giraph system using HDFS as its storage system, significantly outperforms HBase storage system. However, the processing phase of the graph algorithms is considered as the dominant phase in consuming the total execution time. In this work, we have extended our experimental evaluation to include three more systems, six more datasets, two more graph algorithms and three more metrics. Such variety in the different experimental settings have helped us to reveal more insights and build a more comprehensive picture about the evaluated systems.
Han et al. [20] have conducted another study Giraph, GPS, Mizan, and GraphLab using four different algorithms: PageRank, single source shortest path, weakly connected components, and distributed minimum spanning tree on up to 128 Amazon EC2 machines. The experiments used datasets which are obtained from SNAPFootnote 33 (Stanford Network Analysis Project) and LAWFootnote 34 (Laboratory for Web Algorithms). The study has considered different metrics for comparison: total time which represents the total running time from start to finish and includes both of the setup time, the time taken to load and partition the input graph as well as write the output, and computation time, which includes local vertex computation, barrier synchronization, and communication. In addition, the study has considered the memory usage and total network usage metrics for its benchmarcking. The results of this study show that Giraph and GraphLab’s synchronous mode have good all-around performance while GPS excels at memory efficiency. The results also show that the synchronous mode of Giraph, GPS, and GraphLab outperforms that of Mizan in all experiments. The results also identified that GPS’s LALP and dynamic migration optimizations provide little performance benefit, and that GraphLab’s asynchronous mode has poor scalability and performance due to communication overheads. The study has also identified several potential areas for improvement. For example, for Giraph, the authors suggest using better workload balancing to reduce maximum memory usage, and a need for adjacency list data structures that are both mutation and memory efficient. For GPS, the study suggests exploiting data locality to improve the scalability of setup times, and avoiding message polling to minimize superstep overheads. For Mizan, adding system and message processing optimizations to improve performance and scalability. Finally, for GraphLab, the study suggested reducing communication overheads for its asynchronous mode.
Another benchmarking study has been conducted by Lu et al. [29] to evaluate the performance characteristics of Giraph, GraphLab/ PowerGraph, GPS, Pregel+, and GraphChi. The study has used large graphs with different characteristics, including skewed (e.g., power-law) degree distribution, small diameter (e.g., small-world), large diameter, (relatively) high average degree, and random graphs. The study has also used several evaluation algorithms including PageRank, diameter estimation, single source shortest paths (SSSP) and Graph Coloring. The experiments of the study were running on a cluster of 15 machines, each with 48 GB of main memory. The results of the study has shown that there is no single system that has superior performance in all cases but GPS and Pregel+ have better overall performance than GraphLab and Giraph. The authors explain that Pregel+ has better performance because of the combination of mirroring and message combining techniques while GPS also benefits significantly from its LALP technique. They also mentioned that Giraph generally has poorer performance because it does not employ any specific technique for handling skewed workload and mainly relies on the combiner for message reduction.
Finally, Guo al. [17] have conducted a benchmarking study which considered a set of various systems which are more focussed on general purpose distributed processing platforms. In particular, the study has considered the following systems: Hadoop, YARN Footnote 35 which represents the next generation of Hadoop that separates resource management and job management, Stratosphere Footnote 36 which is an open-source platform for large-scale data processing [2], Giraph, GraphLab and Neo4j Footnote 37 which represents one of the popular open-source graph databases. The study has focused on four benchmarking metrics: raw processing power, resource utilization, scalability and overhead. The study has used seven different datasets and five algorithms including general statistics algorithm, breadth-first search, connected component, community detection and graph evolution. Similar to the other studies, the results of this study have shown that there is no overall clear winner among the evaluated systems. However, the results have shown that Hadoop is the worst performer in all cases. The results have also shown that multi-iteration algorithms suffer from additional performance penalties in Hadoop and YARN. The results also have shown that data ingestion takes much longer for Neo4j than for HDFS. In addition, the data ingestion time of HDFS increases nearly linearly with the graph size and the percentage of overhead time in execution time is diverse across the platforms, algorithms, and graphs. We believe that all of these studies have just scratched the surface on the process of evaluating and benchmarking big graph processing systems. More comprehensive studies which track the diversity challenge of dataset, algorithm, metric, and platform are still required in order to have a deeper and more solid understanding of the large scale graph processing and analytics domain. There is still a big room for improvement in this direction.
We believe that the current study is more comprehensive than [17, 20, 29] in terms of attempting to cover the spectrum of popular family of systems in the large scale graph processing domain. In addition, it is richer in terms of the used experimental datasets and benchmarking tasks. However, we believe that there is still room for more benchmarking and experimental studies for covering other systems with other datasets and benchmarking tasks.
10 Conclusion
Recently, the usage of large scale graph processing platforms have rapidly grown in both of academia and industry for several purposes and application domains. This is expected to continue in the future as more and more problems require the use of big graphs and thus also the ability to handle them effectively. To this end, we presented a thorough survey of the state-of-the-art of the emerging platforms in this domain. We have also conducted an extensive experimental study for the performance characteristics, using several metrics, of five popular systems in this domain using various datasets and benchmarking tasks. The results of our experiments have shown some interesting characteristics about the performance of the evaluated systems. In addition, our analysis for the detailed results has provided a set of useful insights. Finally, we identified and presented a set of the current open research challenges and also presented some of the promising directions for future research in the domain of large scale graph processing. In general, we believe that there are still many opportunities for new innovations and optimizations in the domain of large scale graph processing. Hence, we consider this article as an important step on helping researchers to understand the domain and guiding them towards the right direction for improving the state-of-the-art.
Change history
28 February 2018
The original version of this article unfortunately contained a mistake in the acknowledgement statement.
Notes
Please refer to a table with specification of EC2 instances on http://aws.amazon.com/ec2/instance-types/.
References
Abouzeid, A., Bajda-Pawlikowski, K., Abadi, D.J., Rasin, A., Silberschatz, A.: HadoopDB: an architectural hybrid of MapReduce and DBMS technologies for analytical workloads. PVLDB 2(1), 922–933 (2009)
Alexandrov, A., Bergmann, R., Ewen, S., Freytag, J., Hueske, F., Heise, A., Kao, O., Leich, M., Leser, U., Markl, V., Naumann, F., Peters, M., Rheinländer, A., Sax, M.J., Schelter, S., Höger, M., Tzoumas, K., Warneke, D.: The stratosphere platform for big data analytics. VLDB J. 23(6), 939–964 (2014)
Barnawi, A., Batarfi, O., Elshawi, R., Fayoumi, A., Nouri, R., Sakr, S.: On characterizing the performance of distributed graph computation platforms. In: Proceedings of the TPC Technology Conference, TPCTC. Springer, Berlin (2014)
Borkar, V.R., Carey, M.J., Grover, R., Onose, N., Vernica, R.: Hyracks: a flexible and extensible foundation for data-intensive computing. In: Proceedings of the international conference on Data Engineering, ICDE, pp. 1151–1162. IEEE (2011)
Bu, Y., Howe, B., Balazinska, M., Ernst, M.D.: The HaLoop approach to large-scale iterative data analysis. VLDB J. 21(2), 169–190 (2012)
Bu, Y., Borkar, V.R., Jia, J., Carey, M.J., Condie, T.: Pregelix: Big(ger) graph analytics on a dataflow engine. PVLDB 8(2), 161–172 (2014)
Chattopadhyay, B., Lin, L., Liu, W., Mittal, S., Aragonda, P., Lychagina, V., Kwon, Y., Wong, M.: Tenzing a SQL implementation on the MapReduce framework. PVLDB 4(12), 1318–1327 (2011)
Chen, R., Weng, X., He, B., Yang, M.: Large graph processing in the cloud. In: Proceedings of the SIGMOD, pp. 1123–1126. ACM (2010)
Clinger, W.D.: Foundations of Actor Semantics. Technical Report, Cambridge, MA (1981)
Dean, J., Ghemawa, S.: MapReduce: simplified data processing on large clusters. OSDI 1, 137–150 (2004)
Ediger, D., Bader, D.A.: Investigating graph algorithms in the BSP model on the cray XMT. In: Proceedings of the IPDPS workshops (2013)
Ekanayake, J., Li, H., Zhang, B., Gunarathne, T., Bae, S.-H., Qiu, J., Fox, G.: Twister: a runtime for iterative MapReduce. In: Proceedings of the High Performance Distributed Computing, HPDC, pp. 810–818. ACM (2010)
Fard, A., Nisar, M.U., Ramaswamy, L., Miller, J.A., Saltz, M.: A distributed vertex-centric approach for pattern matching in massive graphs. In: Proceedings of the BigData conference, pp. 403–411 (2013)
Friedman, E., Pawlowski, P.M., Cieslewicz, J.: SQL/MapReduce: a practical approach to self-describing, polymorphic, and parallelizable user-defined functions. PVLDB 2(2), 1402–1413 (2009)
Gonzalez, J.E., Low, Y., Gu, H., Bickson, D., Guestrin, C.: PowerGraph: distributed graph-parallel computation on natural graphs. In: Proceedings of the Operating Systems Design and Implementation, OSDI, pp. 17–30 (2012)
Gonzalez, J.E., Xin, R.S., Dave, A., Crankshaw, D., Franklin, M.J., Stoica, I.: GraphX: graph processing in a distributed dataflow framework. In: Proceedings of the OSDI, pp. 599–613 (2014)
Guo, Y., Biczak, M., Varbanescu, A.L., Iosup, A., Martella, C., Willke, T.L.: How well do graph-processing platforms perform? An empirical performance evaluation and analysis. In: Proceedings of the International Parallel and Distributed Processing Symposiumm, IPDPS, pp. 395–404 (2014)
Guo, Y., Varbanescu, A.L., Iosup, A., Martella, C., Willke, T.L.: Benchmarking graph-processing platforms: a vision. In: Proceedings of the International Conference on Performance Engineering, ICPE, pp. 289–292 (2014)
Han, W., Lee, S., Park, K., Lee, J., Kim, M., Kim, J., Yu, H.: TurboGraph: a fast parallel graph engine handling billion-scale graphs in a single PC. In: Proceedings of the KDD, pp. 77–85 (2013)
Han, M., Daudjee, K., Ammar, K., Özsu, M.T., Wang, X., Jin, T.: An experimental comparison of Pregel-like graph processing systems. PVLDB 7(12), 1047–1058 (2014)
Herodotou, H., Lim, H., Luo, G., Borisov, N., Dong, L., Cetin, F.B., Babu, S.: Starfish: a Self-tuning system for big data analytics. In: Proceedings of the Conference on Innovative Data Systems Research, CIDR, pp. 261–272 (2011)
Kang, U., Tsourakakis, C.E., Faloutsos, C.: PEGASUS: a peta-scale graph mining system. In: Proceedings of the International Conference on Data Mining, ICDM, pp. 229–238 (2009)
Kang, U., Meeder, B., Faloutsos, C.: Spectral analysis for billion-scale graphs: discoveries and implementation. In: Proceedings of the PAKDD, pp. 13–25 (2011)
Kang, U., Tsourakakis, C.E., Faloutsos, C.: PEGASUS: mining peta-scale graphs. Knowl. Inf. Syst. 27(2), 303–325 (2011)
Kang, U., Tong, H., Sun, J., Lin, C.-Y., Faloutsos, C.: GBASE: a scalable and general graph management system. In: Proceedings of the international conference on Knowledge Discovery and Data Mining, KDD, pp. 1091–1099 (2011)
Khayyat, Z., Awara, K., Alonazi, A., Jamjoom, H., Williams, D., Kalnis, P.: Mizan: a system for dynamic load balancing in large-scale graph processing. In: Proceedings of the European Conference on Computer Systems, EuroSys, pp. 169–182. ACM (2013)
Kyrola, A., Blelloch, G.E., Guestrin, C.: GraphChi: large-scale graph computation on just a PC. In: Proceedings of the OSDI, pp. 31–46 (2012)
Low, Y., Gonzalez, J., Kyrola, A., Bickson, D., Guestrin, C., Hellerstein, J.M.: Distributed GraphLab: a framework for machine learning in the cloud. PVLDB 5(8), 716–727 (2012)
Lu, Y., Cheng, J., Yan, D., Wu, H.: Largescale distributed graph computing systems: an experimental evaluation. PVLD 8(3), 281–292 (2014)
Malewicz, G., Austern, M.H., Bik, A.J.C., Dehnert, J.C., Horn, I., Leiser, N., Czajkowski, G.: Pregel: a system for large-scale graph processing. In: Proceedings of the SIGMOD conference, pp. 135–146 (2010)
Page, L., Brin, S., Motwani, R., Winograd, T.: The PageRank citation ranking: bringing order to the web. Technical Report 1999–66, Stanford InfoLab, November 1999. Previous number = SIDL-WP-1999-0120
Sakr, S.: GraphREL: a decomposition-based and selectivity-aware relational framework for processing sub-graph queries. In: Proceedings of the DASFAA, pp. 123–137 (2009)
Sakr, S., Al-Naymat, G.: Efficient relational techniques for processing graph queries. J. Comput. Sci. Technol. 25(6), 1237–1255 (2010)
Sakr, S., Al-Naymat, G.: Graph indexing and querying: a review. IJWIS 6(2), 101–120 (2010)
Sakr, S., Pardede, E. (ed.): Graph Data Management: Techniques and Applications. IGI Global, Hershey (2011)
Sakr, S., Elnikety, S., He, Y.: G-SPARQL: a hybrid engine for querying large attributed graphs. In: Proceedings of the Conference on Information and Knowledge Management, CIKM (2012)
Sakr, S., Liu, A., Fayoumi, A.G.: The family of mapreduce and large-scale data processing systems. ACM Comput. Surv. 46(1), 11 (2013)
Salihoglu, S., Widom, J.: GPS: a graph processing system. In: Proceedings of the SSDBM, p. 22. ACM (2013)
Schad, J., Dittrich, J., Quiané-Ruiz, J.-A.: Runtime measurements in the cloud: observing, analyzing, and reducing variance. PVLDB 3(1), 460–471 (2010)
Shao, B., Wang, H., Li, Y.: Trinity: a distributed graph engine on a memory cloud. In: Proceedings of the International Conference on Management of Data, SIGMOD, pp. 505–516 (2013)
Simmen, D.E., Schnaitter, K., Davis, J., He, Y., Lohariwala, S., Mysore, A., Shenoi, V., Tan, M., Xiao, Y.: Large-scale graph analytics in aster 6: bringing context to big data discovery. PVLDB 7(13), 1405–1416 (2014)
Stutz, P., Bernstein, A., Cohen, W.W.: Signal/collect: graph algorithms for the (semantic) web. Int. Semant. Web Conf. 1, 764–780 (2010)
Tian, Y., Balmin, A., Corsten, S.A., Tatikonda, S., McPherson, J.: From “think like a vertex” to “think like a graph”. PVLDB 7(3), 193–204 (2013)
Valiant, L.G.: A bridging model for parallel computation. Commun. ACM 33(8), 103–111 (1990)
Wang, G., Xie, W., Demers, A., Gehrke, J.: Asynchronous large-scale graph processing made easy. In CIDR (2013)
Zaharia, M., Chowdhury, M., Franklin, M.J., Shenker, S., Stoica, I.: Spark: cluster computing with working sets. In: Proceedings of the HotCloud (2010)
Zhang, Y., Gao, Q., Gao, L., Wang, C.: iMapReduce: a distributed computing framework for iterative computation. J. Grid Comput. 10(1), 47–68 (2012)
Acknowledgments
This work was supported by King Abdulaziz City for Science and Technology (KACST) Project 11-INF1990-03.
Author information
Authors and Affiliations
Corresponding author
Additional information
A correction to this article is available online at https://doi.org/10.1007/s10586-018-2132-0.
Rights and permissions
About this article

Cite this article
Batarfi, O., Shawi, R.E., Fayoumi, A.G. et al. Large scale graph processing systems: survey and an experimental evaluation. Cluster Comput 18, 1189–1213 (2015). https://doi.org/10.1007/s10586-015-0472-6
Received:
Revised:
Accepted:
Published:
Issue Date:
DOI: https://doi.org/10.1007/s10586-015-0472-6