
Abstract
On August 7th, 2020, a magnitude Mw = 5.0 earthquake shook 5 km north of Mila city center, northeast of Algeria, causing substantial damage directly to structures, and indirectly from induced impacts of landslides and rock falls, ultimately disrupt to everyday civilian life. Given the recent significant seismic occurrences in the region, a detailed and comprehensive examination and assessment of post-earthquake damage is critical to Algeria. This is primarily because masonry, concrete, and colonial-era structures are sensitive to horizontal motions caused by seismic waves, and because masonry and concrete structures constitute a substantial portion of today’s Algeria's build environment. We present a post-earthquake investigation of the Mila earthquake, starting from the earthquake source, and a catalogue of buildings type, damage categorization, and failure patterns of residential structures in Mila's historic old town, where colonial-era brick buildings prevail. We find that structures that represent notable architectural achievements were severely damaged as a result of the earthquake. Data acquired during the immediate post-earthquake analysis was also evaluated and discussed. The graphical representations of the damages are detailed and complemented by photos. This seismic event has shown the fragility of Algeria's building stock, which must be addressed properly in future years. This study reports on an overall estimate of residential buildings in Mila's lower city, as well as an evaluation of the seismic vulnerability of three neighborhood towns (El-Kherba, Grareme-Gouga, and Azzeba). A generic database for graphical surveys and geometric research was developed and implemented making it possible to evaluate the shear strength on-site. The broad observations, collated data, and consequences were then loaded into the 3Muri structural verification program. Nonlinear static analysis was conducted to analyze probable failure paths and compare the real damage to the software results.
1 Introduction
A seismic event is a rare natural occurrence that may induce enormous costs and consequences for structures, the environment, human life, and society. On August 7, 2020, at 06:15:37 UTC, an earthquake of a moderate magnitude Mw = 5.0 (Boulahia, 2022) and intensity VI on the European Macroseismic scale EMS-98 struck the Mila metropolitan region (Eurocode 8 2004a, b). It was followed at 08:12:43 UTC by the strongest aftershock earthquake, with a magnitude Mw = 4.8 (Boulahia, 2022), and intensity of V. The primary earthquake destroyed a substantial number of structures in three areas (El-Kherba, Grareme-Gouga, and Azzeba), including both residential and public buildings. The vast majority of structures built following Algeria's earthquake code (RPA, Règulement Para-sismique Algerien 2003) were either undamaged or only minimally impacted by other correlated hazards, like landslides. However, most of the city (upper and lower areas) was severely affected since structures were constructed without earthquake design concerns and on unstable soils, besides, an important part of the construction was built without official approval. The destruction of buildings is considerable; over 1040 structures were affected, many of which were seriously destroyed (Fig. 1). At the end of the year, another moderate earthquake (Mw = 5.2) struck Northeast Algeria, with Skikda as the epicenter, about 60 km from Mila. The seismic event triggered minor secondary impacts to already damaged constructions.

Illustration of typical structure damage following the Mila earthquake
Seismic vulnerability assessment for past earthquake in Northeast Algeria has been relatively newly initiated, starting on 1992 by Farsi and Belazougui (1992). The current work consists of regional and local studies, mainly based on seismic vulnerability assessments by (Bechtoula and Ousalem 2005; Laouami et al. 2006; Harbi et al. 2007a, 2007b; Belazougui 2008; Hellel et al. 2010; Meslem et al. 2012; Mehani et al. 2013; Boukri et al. 2013; Remki and Benouar 2014; Hamidatou et al. 2017; Chimouni et al. 2018; Allali et al. 2018; Hichem et al. 2019; Akkouche 2019; Amari et al. 2020). We know that the first major hazard that threatens the Mila region is landslide, in this case several studies have assessed landslides’ risk as well as earthquake-triggered landslides’ risk in the region (Marmi et al. 2008; Atmania et al. 2010; Guemache et al. 2010; Semmane et al. 2012; Merghadi et al. 2018; Benfedda et al. 2021; Tebbouche et al. 2022; Smail et al. 2022; Bounemeur et al. 2022; Medhat et al. 2022).
Algeria has a vast number of modern constructions made of reinforced concrete (RC), masonry, and colonial 19th and 20th-century style buildings. Assuming that most of the ostensibly "strategic" projects of cultural and historical value are constructed of masonry, this suggests that old masonry constructions must be evaluated and repaired according to the highest standards (Atalić et al. 2019; Ortega et al. 2019; Rodríguez et al. 2019; Stepinac et al. 2020; ARES 2021). Pushover analysis, also known as nonlinear static evaluation, is crucial and is suggested as a reference technique in Eurocode 8–3 for such cases. Even though the engineering community has made significant advances in comprehending seismic occurrences and their consequences, there are still many unknowns and uncertainties. Earthquake engineering requires a better description of seismic motions and new robust tools for analyzing buildings and assessing seismic hazards and risks. In the previous several decades, structural standards have been carefully researched, developed, and improved to the point that they now allow for designing new types of structures while preventing major damage to human life. It is also necessary to have the ability to evaluate the response of structures to earthquake ground shaking. The seismic risk of existing masonry constructions is difficult to assess and necessitates specialized technical knowledge (Lourenco and Karanikoloudis 2019). Post-earthquake condition evaluation may be described as the process of determining the safety and usability of a structure following a seismic event. Many factors influence structural seismic performance, including the number of floors, roof shape, age of construction, building materials, the geometry of the structure, stiffness, strength, ductility properties, soil conditions, and seismic event characteristics. Information from multiple disciplines, such as tectonics, geophysics, seismology, geology, and civil engineering including geotechnical and structural engineering, mathematics, or applied statistics, is required.
Afterward the earthquake, the first to respond to a catastrophe were civil engineers who led and coordinated the entire organization of building assessment and construction damage analysis. Several similar post-earthquake assessment procedures are used internationally (Yavari et al. 2010; Marshall et al. 2013; Didier et al. 2017). In the first week after Mila earthquake, a large number of constructions were examined, with a rapid post-earthquake assessment. The most endangered buildings in the city’s center were the ones under cultural heritage protection. The aim of a rapid assessment of structures is to determine the degree of damage to buildings concerning the protection of life and property, that is, to determine if the structures are usable, temporarily unusable or unusable. Emerging technological advances allow the usage of artificial intelligence in the post-earthquake assessment process in the form of machine learning methods for more efficient and precise results (Bialas et al. 2016; Zhang et al. 2018; Kim et al. 2020; Natio et al. 2020; Stepinac and Gasparuvic 2020).
Mila is a rural area separated into three zones: Zone A, Zone B, and Zone C (Fig. 2). Mila's most ancient architectural districts are found in Zone A, which is defined by packed blocks of structure masonry, brick, or a mix of materials. The majority of structures are made out of solid longitudinal and transverse walls, brick ceiling vaults, or timber ceiling beams with reinforced concrete roofs. Some schools, commercial structures, residential and government structures, cultural institutions, and monuments are located in Zone A, and are either components of a historical city structure or stand as lone landmark buildings. The earthquake-caused landslides severely damaged 10% of the structures in Zone A. Zone B is made up of a wide range of urban designs and includes a high number of structures. The landslide zone triggered by the seismic event is Zone C, and some buildings in this area have been significantly damaged. The seismic event occurred throughout the COVID-19 pandemic lockdown and caused a critical interruption to the social restrictions adapted at that time. The research focuses on the post-earthquake investigation, damage categorization, and failure patterns of masonry residential projects in the Mila region. We present primary data acquired by onsite inspections and provide an updated and broader insight to the seismic hazard of the Mila region. We also run 3D modelling to better understand the response of building in similar conditions.

Protected areas A, B, and C, as well as the region of the analysis within the Mila (yellow dashed line)
In fact, the main shock triggered many large landslides, of which, the traces are traceable and the impact on individual houses is significant. The most important one was observed in the El Kherba region (Zone C in Fig. 2), a catastrophic one which caused damage to residential structures. A substantial number of structures and infrastructures in the landslide's neighbourhood has been severely damaged. According to this study in post-earthquake categorization, about 10% of structures were damaged in zone A, 15% in zone B, and 61% in zone C. Exhibiting the important effect of the major earthquake-triggered landslide in zone C.
According to Benfedda et al. (2021), six landslide zones have been identified using InSAR analysis of two Sentinel-1A images, taken before and after the August 7 event main shock. The landslides were located along a 22 km long and 6.5 km wide corridor oriented NE-SW. Furthermore, Medhat et al. (2022) detected tow landslide zone in far-separated regions, Kherba city and Grarem Gouga city using the 2D decomposition MT-InSAR approach to detect the deformation velocity before the landslide activity, retrieving displacement velocity rates up to ~ 50 mm/year. Two regions were located at 12 km apart, indicating slow motion rather than fast movement along the damaged area. In addition, Halla et al. (2022under publication) three large landslides have been observed within 13 km radius. The three landslides are located South, Southwest and Southeast. The most important one is that of the El-Kherba district: the Western extension of Mila city. The second landslide is located just near the epicenter within a radius of 5 km, East of Grrarem-Gouga village. The last landslide is the least important. It is located in the Azzeba village, situated Southeast of Mila city.
A thorough and more thorough post-earthquake damage assessment is required in light of the recent devastating earthquakes in Algeria. This is particularly crucial for Algeria since the bulk of the country's buildings are made of masonry, which makes them extremely sensitive to earthquake-induced horizontal movements. An exhaustive assessment of a residential structure in Mila's lower town is given in this paper. Geometric surveys and visual inspections were both part of a comprehensive program that was developed and executed. This earthquake brought to light Mila's vulnerable building stock, which has to be mitigated as effectively as possible going forward. To minimize earthquake losses, determining the characteristics of susceptibility and evaluating the seismic performance of existing structures are crucial (Endo et al. 2017; Casapulla et al. 2018; Ortega et al. 2018; Valente and Milani 2019; Hichem et al. 2019; Grillanda et al. 2020).
2 Historical seismicity and the seismic sequence in Mila
2.1 Seismicity in Algeria's Northeast
Many seismic events have shaken Algeria's Northeast in the past. The strongest earthquakes were the tsunamigenic earthquakes that struck the city of Jijel (previously Djidjelli) on 21 and 22 August 1856, with an intensity of X on the EMS scale, and affected Djidjelli and the nearby region (Harbi et al. 2011). According to ancient sources, the earthquake generated a tsunami and caused extensive damage in the city, with more than 30 people killed and many collapsed structures. Figure 3 is a map of major earthquakes in northern Algeria with their surface magnitudes Ms. Only a few significant earthquakes have happened in Algeria's northeastern region in more than a century. As a result, public awareness and readiness were at an all-time low. Though authorities and scientists have warned for years about the repercussions of a catastrophic earthquake and about the importance of planning for a swift response after an earthquake (vulnerability assessment, rescue and care of people, damage assessments, etc.…), preparedness actions have been limited (Atalić et al. 2019; Stepinac et al. 2020).

Mila is located in the NW of the Constantine basin, which, with its tectonic configuration, is the key cause of earthquakes in the zone (Durand 1969; Raoult 1974; Vila 1980; Coiffait 1992). The 1985 Constantine earthquake (Ms = 6.0, Ousadou et al. 2012), the worst seismic event registered in the area, triggered substantial damage in the city and was felt in the Mila area. According to historical records, the earthquake produced extensive damage to constructions (108 structures were damaged) and caused two fatalities and injured 10 inhabitants (Bounif et al. 1987). The 1985 earthquake was a watershed moment in Northeast Algeria’s development and city planning. However, since strong seismic events occur across relatively extended time periods, the lessons of the past are easily forgotten. Even though 50 percent of the North Algerian region is vulnerable to severe seismic shaking, and 70% of the population lives in this region, the public’s risk awareness is low.
2.2 The seismic sequence in Mila on July–August 2020
In the period including July and August 2020, the Mila region witnessed a seismic sequence that was marked mainly by the appearance of three important shocks. Recently, Benfedda et al. (2021) studied the main events of the July–August 2020 Mila seismic sequence, including, respectively, the events on July 17 at 08:12 UTC (Mw 4.6), August 7 at 06:15 UTC (Mw 4.8) and at 11:13 UTC (Mw 4.4). More recently, Boulahia (2022) examined the first shock of July 17, 2020 at 08:12 UTC of Mw 4.8, located 1 km North of Sidi Merouane (near Grarem-Gouga area), a second shock on the August 7, 2020, at 06:15:37 UTC, where he stated a Mw magnitude of 5.0, and a third shock at 11:13:27 UTC of a Mw 4.5 (Boulahia 2022). The main shock (the second one) had an intensity of VI according to the EMS-98 scale, it also triggered a spectacular landslide in the El Kherba region. This landslide caused significant damage to individual buildings (Fig. 4).

Preliminary Earthquake Intensity Map (left) from the earthquake of August 7, 2020, at 6:15:37 (UTC) compared with predicted peak ground accelerations (right) for a return period of 475 years (Hamidatou et al. 2021), the red square indicates the Mila region
Benfedda et al. (2021) performed a waveform inversion of the accelerograms to calculate the seismic moment, moment magnitude, and focal mechanisms of the three main seismic events:
-
The July 17th, 2020, Mo = 1.019E + 16 Nm, Mw = 4.6, h = 5 km.
-
The August 7th main shock, Mo = 1.794E + 16 Nm, Mw = 4.8, h = 8 km.
-
The August 7th aftershock, Mo = 4.653E + 15 Nm, Mw = 4.4, h = 12 km.
They determined focal mechanisms generated a pure strike-slip solution for the three events with nodal plans oriented NE-SW and NE-SW and a pressure axis oriented N-S.
In addition Boulahia (2022) used an Empirical Green’s Function (EGF) method to derive the Relative Source Time Functions (RSTF’s) and high-resolution relocation to active structures and analyzed the spatiotemporal behavior and mechanics of the sequence. They managed to separate the initial seismic cloud into two densely concentrated spatial clusters of strongly correlated events, and were able to detect components of directivity toward the southeast for the shock (Mw 4.8) and directivity toward the northeast for the mainshock (Mw 5.0).
-
The July 17th, 2020, Mo = 2.14 × 10¹⁶ N.m, Mw = 4.8.
-
The August 7th main shock, Mo = 3.14 × 10¹⁶ N.m, Mw = 5.0.
-
The August 7th aftershock, Mo = 0.67 × 10¹⁶ Nm, Mw = 4.5.
They relocate over 981 events from the sequence, with structures matching moment tensor solutions and focal mechanisms indicating predominantly right- and left-lateral strike-slip ruptures. The results reveal orthogonal conjugate structures—one trending ~ N65W and dipping 80°SW, and one trending ~ N28E, 70°NW-dipping fault plane. The earthquakes evolved in two phases, with a spatiotemporal migration of epicenters from the NW–SE fault plane to the NE-SW fault at a rate consistent with pore fluid diffusion (Boulahia 2022).
Furthermore, Benfedda et al. (2021) recorded the peak ground accelerations (PGAs) of the three major events in Mila by the local network. The Beni-Haroun station recorded the maximum accelerations for all events. The Beni-Haroun huge dam reservoir is just a few meters away from the BHAR station, which is situated in a free field and on hard rock on the NW side. The high values of ground motion of these relatively small earthquakes are explained by the near field and shallow depth of the seismic events. Hard rock often records such high acceleration values quite near to the hypocenters (Laouami and Slimani 2018).
The earthquake's epicenter was located at latitude 6.28 N and longitude 36.54E. The epicenter was located around 13 km Southwest of Mila center, in the Hamala area, at a depth of 7 km. The strongest aftershock occurred at 8:12:43 UTC, with an Mw magnitude of 4.8 (Boulahia 2022) and EMS-98 intensity V. The epicenter of this aftershock was about 10 km Southwest of Mila's center, at a depth of 10 km. On the same day, five aftershocks with Mw magnitudes larger than 3.0 and EMS-98 intensity V were observed. Following that, the city of Mila and its surroundings have been hit by a series of mild and medium aftershock earthquakes (Fig. 5).

Earthquakes with a magnitude more than 2.0 (Mw) occurred in Mila between August 7 and October 30, 2020
Even though the seismic event was of moderate magnitude, it caused a large amount of measurable damage. Seismic risk assessment in urban areas and building vulnerability are usually misread, therefore the majority of community media (and a section of the technical community) have consistently reported on the disparity between the magnitude of the earthquake and the degree of damage. Assuming that a thorough and complete seismic risk assessment for the city of Mila has not been conducted, such reporting is not unusual. Given that the PGA for the historic core of Mila, which was the subject of prior studies, was about 0.19 g, and that most of the structures are quite vulnerable, widespread damage should have been predicted (Hamidatou and Sbrtai 2016, 2017; Hamidatou et al. 2019; 2021). The primary earthquake destroyed a substantial number of old urban structures, including residential buildings, administrative offices, colleges, and public institutions.
3 Procedure for immediate response and post-earthquake evaluation
The seismic event in Mila occurred during the strong restrictions imposed following the first wave of the COVID-19 pandemic, which imposed extra constraints on rescuer and researcher operations. Immediately following the earthquake, a multidisciplinary post-seismic disaster management team visited the Mila City Crisis Management Agency to examine the damaged state of the constructions and the possibility of their continued use in a timely manner. The Civil Protection Center was activated, and researchers, specialists, and experts from research centers and universities, as well as the CRAAG, were hired to organize work related to field condition assessment, installation of the seismic network and Global Positioning Systems (GPS), geological and geophysical field missions, rapid engineering assessment training, and the organization and development of an information system for dealing with disasters. All activities were conducted in partnership with the Ministry of the Interior's Civil Protection Directorate and the City of Mila's Civil Protection Authority.
Based on Italian results, a prototype technique for post-earthquake damage and useability study was proposed (Baggio et al. 2007) and EMS-98 (EMS 1998), because knowledge of seismic occurrences in northern Algeria is low, vigilance for such events and immediate actions was also poor. Until now, data on the number of structures, floor layouts, cross-sections, building materials, or function at the time of the earthquake were not available. The post-earthquake damage analysis includes a quick visual evaluation of each structural system, an indication of the degree of damage, and the categorization of the structure into each of six sections:
-
CN1 (dark red color): Not feasible due to external hazards—The construction is dangerous due to the likelihood of major portions of a nearby structure collapsing. It is advised not to remain in such facilities given the considerable number of aftershocks.
-
CN2 (red color): Unusable owing to damage—The structure is dangerous due to substantial structural damage, collapse, and failure. The structure has reached the limit of its loadbearing capability and ductility and cannot be utilized in any way. That does not always mean that the building must be destroyed.
-
PCN1 (dark yellow color): Possibly unusable—Full assessment required—The structure has a fair extent of the damage but no risk of collapse. The loadbearing capacity has been partly reduced. A shorter visit to the structure is conceivable, and a structural engineer should provide suggestions for future repair work.
-
PCN2 (yellow color): Temporarily unusable- Emergency rehabilitation measures required—The structure has some damage with no probability of collapse, but cannot be utilized owing to the possibility of failure of some structural components. The structural engineer is aware of emergency response methods and must give instructions to users. The structure, or a portion of it, is inoperable until the safeguards are put in place. Provisional usability may apply to elements of the structure (components) only.
-
CU1 (dark green color): Usable without limitations—There is no damage or only minor damage that does not jeopardize the structure's load-bearing ability and usage.
-
CU2 (green color): Consider Protective Measures.—Except for some elements where there is an immediate risk to a portion of the structure, the structure can be used. The building evaluator can grant authorization for sthe risk to be removed and advise the occupants to impose temporary residential limitations on specific portions of the structure. The structure can be used freely after the risk has been removed.
After Day 1, Class CU2 was used in the procedure because non-structural components of the structures were damaged and may endanger passers-by and members of the public. It was essential to eliminate these components as quickly and efficiently as possible. The structure was safe to use once the non-structural damaged components were removed.
The building typologies, structural damage, and failure patterns caused by the earthquake or landslide in the Mila city center area are depicted and discussed in the following sections. The brick structures that make up a considerable proportion of the city center and the surrounding area are given special attention. This study focuses on the typical damage and disaster to residential structures. Significant advancement has recently been achieved in understanding the seismic behavior of masonry buildings and analysis during seismic occurrences (Binda et al. 2000; Ortega et al. 2017; Vlachakis et al. 2020). It is hoped that the current data will positively contribute to further development in this field.
4 Typology of constructions in Mila
Mila's buildings typically consist of roughly 91,000 residential constructions and 5,000 non-residential constructions, according to the Algeria Population and Housing Census 2008, provided by the National Office of Statistics of Algeria. More than 20% of the construction stock is over 40 years old. The use of traditional materials and building techniques, like masonry and timber, is a defining feature of such older Mila structures. Most of the people in Mila province, particularly in the cities, work and reside in colonial constructions, especially in Mila's city core.
Throughout the city's and the surrounding areas’ history, numerous types of structures have been constructed depending on the advancement of construction technology, understanding of soil qualities, and urban planning, including urban protection measures and the demand for building areas. Knowing when a set of buildings were built provides a reasonable estimate of their seismic strength following the 1985 Constantine earthquake. Most of the structures in Mila's old city center are concrete and masonry constructions with timber floors and roofs. A single-story typical height varied from 2.5 to 3.7 m.
They followed RPA norms from 1996 to 2003, and after 2003, they followed RPA regulations (RPA 2003). As a result, many structures were built without any proper lateral force resisting system before any seismic regulations were implemented. In terms of floor systems, timber in older houses and reinforced concrete in later constructions are the most common options. Timber floors are more flexible than rigid concrete slabs. Because the connections between walls and floors are typically weak, this makes walls more susceptible to potential out-of-plane failure mechanisms.
New structures with four or more stories have been built in the city throughout the previous two decades. They were designed to withstand earthquakes. A mix of historic individual structures and new apartment towers distinguishes the urban area. Most single-family houses in Mila's immediate vicinity are one- or two-story brick structures. Contained masonry with reinforced concrete floor constructions is more recent than unreinforced stone masonry constructions with wood or reinforced concrete floors. About 17 percent of dwelling units in Mila were built before the first seismic code was enacted (1982), Fifteen percent of housing units were designed following the first seismic code (1962–1996), and 29% were built using the enhanced seismic code (Table 1). The RPA 2003 code was used to design housing units built after 2003.
Mila's historical city compound is a conservation area under the Act on Culture and Heritage Conservation and Maintenance. Zone A and Zone B are the two zones that make up the region (Fig. 6). The oldest and most architecturally key areas of Mila are in Zone A, which is the subject of this study. Both locations, however, have architectural and historic landmarks and are characterized by densely packed blocks of constructions using stone brick or a mix of materials. Many schools, businesses, residential and government structures, social organizations, and mosques are in Zone A and are conserved as part of a historical city structure or as separate historical sites, although they are not the subject of this research. Zone B contains the remaining parts of Mila's historic urban complex. It contains a wide range of urban forms as well as a considerable number of historically significant structures.

Heritage-protected zones in Mila (Zone A, Zone B, and Zone C). The yellow dashed line indicates the study's observation area
Once most of the buildings are constructed as part of bigger blocks, their sides are frequently the width of a leaf. The same building strategy was utilized even when the structures were built inside the blocks, i.e., as freestanding units, and these freestanding structures were severely damaged.
The inadequate connections between walls and floors are also observed, and since the floor structure is primarily wooden, the structures lack the so-called box-type behaviour. Timber flooring prevails despite the presence of multiple composite wooden concrete compound buildings. Because group of unreinforced masonry (URM) buildings are prone to damage from seismic excitations (Palazai et al. 2022), the damage was observed in a large number of structures following the Mila earthquake. The typical roof structure is a king or queen post truss; however, there are many distinct types of integrated timber roof constructions (Fig. 7). Due to rehabilitation work, a concrete slab beneath the roof systems can be found in a limited number of structures. Even though tie rods have been used for many years over the world, they were not widely used in Mila. Timber-reinforced masonry was used in very few examples in the ancient city core. After 1980, numerous new concrete constructions were put within the old downtown's existing building blocks, a trend that still exists today. These structures were either unaffected by the earthquake or suffered only minor non-structural damage. Newer buildings, on the other hand, tended to have more stories and less interstory height than older buildings, which clearly influenced the seismic response of neighboring structures (Fig. 8).

Typical residential structure (schematic representation)

Insertion of new concrete constructions "within" existing blocks during the building process and at the end
The lack of maintenance was identified as a key factor in the condition of structures following the earthquake. Because many structures were poorly or never maintained, the masonry strength deteriorated with time, the connection between the masonry and the walls was degraded, and the seismic performance of such buildings worsened. Water infiltration damaged the characteristics of both masonry and wood elements in numerous cases.
5 Case study: Sidi Ghanem Mosque
We studied the Sidi Ghanem Mosque, a building located in historical Mila city (Figs. 9 and 10). The Sidi Ghanem Mosque is the oldest mosque in Africa. Mila was once a Roman settlement. The Umayyad Arab forces arrived in 675 CE, about 59 AH. Under the direction of Abu al-Muhajir Dinar, they seized the city. That same year, it appears, the order was made to clear a site adjacent to a Christian Basilica and to build a mosque. The basilica had an abundance of building materials, stones, and columns that could be reused. The mosque, on the other hand, did not mirror the familiar Roman basilica or the Roman city street architecture, but it had an important meaning. Its 62 m-high minaret, for example, was constructed with 365 steps, representing the number of days in the year. The mosque of Abu al-Muhajir in Mila does not have a marked orientation. Here's a blueprint for the structure. It began as a mosque, but was later turned into a workshop and, finally, a hospital.

North façade view of the Sidi Ghanem Mosque

South façade view of the Sidi Ghanem Mosque
The Roman basilica was demolished to make way for the mosque to be rebuilt. The main construction is made of reclaimed materials from the old town. The reuse of Roman columns and marquees allowed the mosque to have more robust construction. The other materials used were full-size bricks made on-site. There are visible elements of a second-story building that the French-built to house the soldiers.
The state of disrepair of the Sidi Ghanem Mosque was worsened by the Mila earthquake. The study of the monument’s restoration, which began in 2019, focused in its first phase on "the state of the sites and emergency measures," in light of which emergency work was undertaken.
According to the Algerian seismic hazard map (Hamidatou and Sbartai 2017; Hamidatou et al. 2019, 2021), for a return time of 475 years, the peak ground acceleration at the building site is 0.197 g. The building serves as an educational-cultural institution. Prior to the earthquake, the structure's state in terms of vertical loads was adequate and well maintained.
6 Residential building damage and common failure patterns
The earthquake severely damaged key architectural achievements and shattered Mila's historically identifiable city center. The vast majority of structures were constructed after the first mandated earthquake rules (i.e., during the 1980s) withstood the earthquake unscathed or with only minor damage. However, many structures in the historic district (Upper and Lower Town) were severely damaged. It is estimated that about 10% of the entire building stock was damaged in Zone A and more than 15% in Zone B—a total of 540 damaged buildings. However, in Zone C, 61% of the buildings were damaged, with a total of 743 building, i.e., more than the total of the damaged structures in Zones A and B gathered, exhibiting the substantial effect of the major earthquake-triggered landslide in zone C. (Table 2).
According to the previously mentioned post-earthquake categorization (red or N, yellow or PN, green or U), of 136 damaged structures in zone A, 97 were green-tagged, 35 were yellow-tagged, and 4 were red-tagged, whereas in zone B, of 404 damage structure, 342 were green-tagged, 55 were yellow-tagged, and 7 were red-tagged. However, in Zone C, among the 743 damaged buildings, 515 were green-tagged, 137 were yellow-tagged, and 91 were red-tagged. In Fig. 11, the residential structures with usability tags are depicted on a map of the historical city center, whereas Fig. 12 depicts a typical building block. In this block, 17 buildings were green-tagged (13 percent of all damaged buildings), 20 (17 percent) were yellow-tagged, and 3 (4 percent) were red-tagged.

A detail of Mila city's building usability rating

Post-earthquake damage assessment for one typical block of buildings
The historic downtown is made up of blocks of aggregated buildings, a damage map for each one has been prepared (Fig. 13). The goal was to gather information on the risk of individual blocks as well as a prospective seismic vulnerability assessment for certain sections of Mila. Although it was assumed that blocks further away from the epicenter would be less damaged, the map in Fig. 13 reveals a significant spread and random outcomes.

Average damage index for each block of buildings
According to our post-earthquake assessment analysis, each individual building in the block was assigned a number on the map. CU1 buildings were assigned an index of 0.5, CU2 buildings were assigned an index of 1, PCN1 and PCN2 buildings were assigned an index of 3, and CN1 and CN2 buildings were assigned an index of 5.
Ni: Number of structures in each calculation mesh assigned to a damage category.
Based on the information received; these figures are enough for a basic indicator of damage or average index can be computed for the entire block. For the block depicted in Fig. 12, the damage index is computed as a weighted average depending on the number of individual structures, as \(\left[ {{12} \times 0,{5}\left( {{\text{CU1}}} \right) + {25} \times {1}\left( {{\text{CU2}}} \right) + {4}0 \times {3}\left( {{\text{PCN1}} + {\text{PCN2}}} \right) + {9} \times {5}\left( {{\text{CN1 }} + {\text{ CN2}}} \right)} \right]/{86} = {196}/{86} = {2},{28}\).
It should be emphasized that the damage information should be viewed with caution because the criteria of various engineers were often subjective and deviated from the evaluation guidelines.
The choice to consider PN1 and PN2 designations, as well as N1 and N2 with the same damage index is also justified. Although the results may not provide an entirely accurate image of the damage in the city, they do provide a reasonable indication of which areas are most vulnerable to earthquakes. The immediate post-earthquake evaluation revealed unique structural damage typologies. Non-structural components such as chimneys and ornamental elements on facades were found to be losing their structural resistance and stability on every structure in the city center. These factors resulted in further damage to the building exterior or structural damage to nearby structures, as well as water intrusion inside the premises. Secondly, the loss of structural strength and stability of structural components jeopardized the structural integrity of entire structures. Gable walls, masonry columns, portions of walls between or under windows, vaults, ceilings, and stairs are the most frequently encountered damaged elements. Some of these features also harmed roof systems, which frequently became unstable because of the collapse of individual load-bearing walls underneath them.
Individual buildings, particularly those within the blocks of buildings, suffered significant damage and had uncertain structural resistance and stability. Table 3 shows the prevalence of observed masonry structure damages and load-deformation in Mila. The structural damage observed is discussed in the following section with graphical interpretations and images of the affected buildings. There are examples of in-plane, out-of-plane, and mixed damage or failure mechanisms.
6.1 Structural damage
Masonry is a well-known heterogeneous, composite material with low tensile strength and significant self-weight, making it difficult to sustain earthquake-induced stresses. Learning from past occurrences can help us design better new structures and make post-earthquake evaluations easier. The Mila earthquake caused damage to clay brick masonry constructions similar to those observed in Japan and Italy (Penna et al. 2014; Binda et al. 2000; De Luca et al. 2018) and Turkey after recent earthquakes (Karimzadeh et al. 2018; 2020). Most of the residential structures in Mila's old town were constructed with URM. To prevent masonry failure, proper detailing and strengthening should be employed. However, this was not always the case in older structures. Even though “zero mechanism” was frequently mentioned in many post-earthquake evaluations in African nations (i.e., the disintegration of the material) (Indirli et al. 2013), due to the construction type, i.e., solid brick structure, this mechanism was not detected during the Mila earthquake. The partial collapse or overturning of gable walls was one of the most typical failure types in Mila's residential structures. Gable walls are often just 9 cm thick. In addition to the attic gable walls, the parapet walls were frequently damaged, but to a lesser extent. The preceding part depicted the roof type, and it was observed that the connections between the timber framework and the walls were frequently insufficient or non-existent. Roof rafters and ridge beams frequently collide with gable walls, causing substantial damage and failure due to their weight and magnified accelerations at the gable's height. The same thing happens with the mezzanine wood structure (which rests on the longitudinal walls) and sidewalls—the wall and horizontal parts are not or are very poorly attached. Figure 14 depicts damage examples from the most prevalent gable wall collapses.

In-plane and out-of plane damage
Many buildings have an architectural design that includes protrusions for entrances or other floor plan irregularities. Cracks frequently emerge at the junction of orthogonal load-bearing walls in these areas; torsion ensues, which can compromise the building's overall stability. Because building entrances with stairs are widespread in these locations, the staircases and related load-bearing walls are frequently damaged. Figure 15 depicts one example.

Plan irregularities caused damage to the connecting components
6.2 Non-structural damages
The Mila earthquake caused the most damage to non-structural elements. Partition walls are typically composed of 9 cm-thick masonry but can be as thin as 3.7 cm without plaster. The degree of damage to partition walls ranges from minor plaster damage to severe collapse and failure (Fig. 16). Non-structural walls are sometimes built on the shorter side of the brick (shiner) and are likely to be destroyed after an earthquake. Although damage to partition walls may not result in a permanent reduction in structural strength and stability, it can nonetheless represent a risk to the building's performance and peoples’ safety. Many buildings in Mila have such walls that are exceedingly high and long. This makes them comparatively thin, and their collapse can endanger people. The massive damage to partition walls reflects a major economic loss as well. Certain institutions with huge floor areas have partition walls that have sustained so much damage that cost–benefit assessments have shown that repairing them is not profitable. The building approach was to stack partition walls on top of one other, transferring no load to the slab. If the first-floor wall is destroyed or lost, the weight of the second floor (and higher levels) will be transmitted to the first-floor slab.

Damage to partition walls
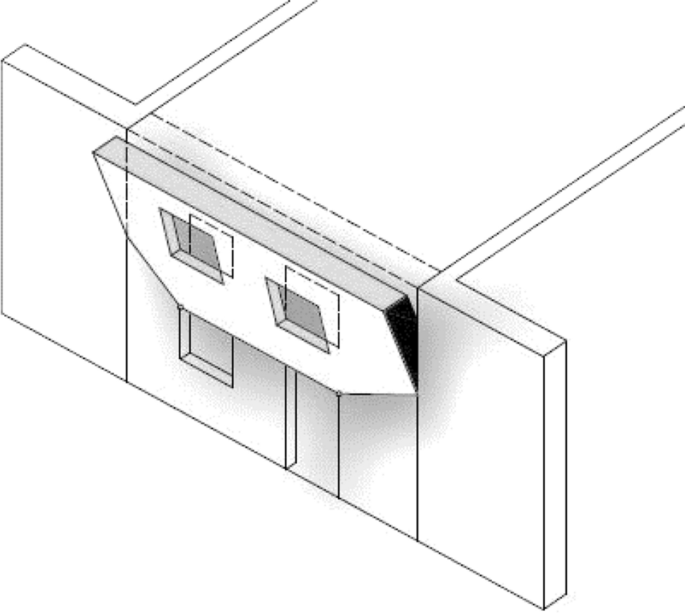
Conversion of non-residential spaces to residential spaces is a common adjustment to building spaces (such as basements, attics, or service rooms). Partition walls were frequently eliminated during such renovations, undesired intrusions in load-bearing walls are also common. It is often assumed that if a steel beam is installed on top of the opening to replace the load-bearing wall, nothing will happen to the structure. Elements of the roof structure are frequently removed when transforming an attic into a living area since they interfere with the intended usage (Fig. 17). Roof structures have been extensively modified during the conversion of attics to residential use. Timber tie components were frequently cut to install a door (Fig. 17), creating significant alterations to the roof structure's basic structural system.

An example of an attic conversion for residential use
Stairs in residential structures are often positioned in the center of the floor layout, with various residential units on either side. Stairs are not necessarily non-structural features, but in the case of brick structures in Mila, they are not critical for seismic force resistance. Stairs can be monolithic at times, although they are usually fixed to the walls on one side and supported by steel profiles on the other. Many stairs lack a supporting beam and are not monolithic, as seen in Fig. 18 (right). Staircase walls are often thicker and part of a rigid core. The most typical staircase damage is the separation of individual stairs, the falling of plaster (sometimes as thick as 3 cm), and the separation of the stairs from the walls (Fig. 18).

Typical stairwell damage
Many staircases were built cantilevered into the wall, resulting in substantial step separations during the earthquake. Finally, in older structures, elevator shafts served as partition walls and were frequently damaged (Fig. 19).

Typical elevator shaft damage
7 Methodology
7.1 Assessment procedure
A quick, preliminary assessment of the continued useability including all structures affected in the earthquake is the first step in a thorough post-seismic building evaluation (Stepinac et al. 2017; Uroš et al. 2020). The information thus collected may also be used to evaluate old infrastructure and build a modeling and simulation model. The following studies employed similar technologies (Dall’Asta et al. 2019; Betti et al. 2021). When required, detailed assessment and available Non-Destructive Testing (NDT) assessment methods are preferred (Stepinac et al. 2020). With consideration of the safety of civil engineers in the field, a quick initial survey is carried out as quickly and efficiently as possible following the earthquake. In Algeria, this type of evaluation entailed a quick visual inspection of each load-bearing structural component and an assessment of the level of damage, and the assignment of the building into one of six potential categories (Fig. 20):
-
CU1 Unrestricted use possible (Dark Green label),
-
CU2 Useful with suggestions (Green label),
-
PCN1 Unusable for the time being, a thorough examination is essential (Dark Yellow label),
-
PCN2 temporarily ineffective (Yellow label),
-
CN1 Due to extraneous influences, it is no longer usable (Dark Red label), and
-
CN2 Due to damage, it is no longer useable (Red label).

Six categories, each with a unique label
7.2 Detailed assessment results
On August 8, 2020, within the first 24 h after the earthquake, a rapid evaluation of the case study building was conducted. Following a quick thorough observation of load-bearing structural components, the building was deemed temporally uninhabitable (Dark Yellow label), with a suggestion for a further assessment (PCN1). The preliminary assessment's main findings are as follows:
-
On all levels, there is apparent damage in the form of cracks in the wall coverings, arches (Fig. 21a), vaults, and ceilings (Fig. 21b);
-
Plaster separation and localized damage;
-
Structural components (walls, columns, and arches) have minor damage;

First floor cracks: wall, lintel (a), and ceiling (b)
In the eastern part of the structure, diagonal cracks are apparent on load-bearing walls.
The second floor and attic had slight damage, but the eastern (Fig. 22a, b) and central staircase wings received the most serious damage (Fig. 23a, b). The structure should be used with caution in areas where there is a risk of plaster collapsing, according to the instructions. Furthermore, while the eastern and western stairs can be used with a limited number of people, the central staircase cannot be used until a comprehensive assessment has been conducted.

Exterior a and internal b cracks on the eastern stairwell

Exterior a and internal b diagonal cracks on the central staircase
The buildings under consideration are in the range of peak ground acceleration of 0.199 g, according to current structural engineering standards shown by RPA (2003), and governmental codes—which means the expected earthquake intensity is X on the EMS-98 scale for a return period of 475 years. Furthermore, a seismic hazard map for the Mila region was developed according to RPA 2003 criteria based on the latest findings from research conducted by CRAAG in collaboration with the University of Skikda (Hamidatou et al. 2017). The soil in the immediate area of the evaluated structure falls into the category of soil type C, according to the specified seismic hazard study (2017–2019).
The damage observations are depicted on the building’s floor plans (Figs. 24 and 25). The building was evaluated from the air using an unmanned aerial vehicle, and no damage to the primary load-bearing structure or the roof structure was found. Also examined were decorative crosses, figurines, and reliefs. The 3D model of the building was created using photogrammetric photographs for digital preservation reasons.

Damage pattern and shear strength-testing locations on the building's ground floor

Damage pattern and shear strength-testing locations on the first level of the structure
After a detailed assessment of the structure, the following damages were discovered: cracks in wall hangings, vaults, and ceiling, and separation and local degradation of plaster on the bottom floor. Due to lateral motions during the earthquake, cracks in the barrel vaults are frequently parallel to the supporting joints. The cracks are caused by tensile strains that run perpendicular to the supporting joint. If such fissures develop deeply enough, they can induce hinge formation and, as a result, loss of stability. However, the defects found in the studied structure are superficial and mostly concentrated in the plaster. Minor local damage occurred to the structural elements (walls, columns, and arches). Diagonal fractures on load-bearing walls may be seen in the center core of the structure, where the main stairway is located, and in the eastern part of the building. These fissures can also be noticed on the building's north side. All the floors show visible damage, such as cracks and crumbling plaster on the walls. Minor local damage to the first-floor walls, as well as cracks on the partition walls and ceiling connectors, may be seen.
The east wing's ground and first floors were severely damaged. The cracks that developed spread along the entire wall of the wing's south front. It is unfavorable that the fissures are connected and proceed to the transversely interconnected walls and lintels. The little contribution of a torsional reaction of the structure, where the boundary elements are the most strained and collapse might induce such fractures. In addition, that component of the structure is connected to the adjacent structure. Although this can have a favorable impact in general, in the case of the east wing walls, such a boundary condition might produce extra forces. The walls may fail if they are not well connected to the diaphragms. The wall is not in danger of collapsing because there has been no out-of-plane displacement, but it should be strengthened as soon as possible to prevent further damage. Except for the main staircase, the entire structure is available for use. Depending on the probable future, a static and dynamic analysis of the structure's current condition must be done. Irrespective of how much the entire structure would be repaired, the primary staircase, as well as every other wall with cracks along their length, need to be renovated and repaired. Prior to that, preliminary research on the masonry's characteristics and other essential data for the design and analysis must be performed.
7.3 Numerical modeling
The 3Muri software is used to generate a 3D numerical model of the evaluated building. Because of its computational efficiency and excellent accuracy, the macro-element technique is used (Mouyiannou et al. 2014).
Its simulation adaptability (including properties of the different elements, realistic floor stiffnesses, strengthening, and many other features) makes it extremely helpful in a location where the great bulk of building stock is brick. This research was based on relevant case analyses in the 3Muri program (Lamego et al. 2017; Malcata et al. 2020).
The equivalent-frame technique, which employs non-linear beam elements, is used by the macro-element approach. The three categories of macro-elements are piers, spandrels, and stiff nodes (or non-linear beam elements). The piers and spandrels, which are connected by rigid nodes, are the focal points of all deformation. Figure 26 depicts an analogous frame model constructed from these aforementioned macro-elements.

3Muri 3D model and a 3D comparable framework
Non-linear static pushover analysis (Fajfar and Fischinger 1998; Cerovecki et al. 2018) verifies the limit load ratio employed in numerical solution and provides more comprehensive information on relevant components, failure causes, and the building's overall performance. The pushover study is conducted with constant dynamic loading and monotonically increasing lateral stiffness. Two alternative horizontal load distributions along the building's elevation are investigated in the pushover research. The horizontal load is proportionate to the mass of the building in the first distribution, which also has a high degree of similarity. The horizontal loads are transferred according to the structure's mode pattern in the second distribution first vibration mode form as established by elastic analysis (Figs. 27 and 28). Such horizontal forces are imposed in the model at the position of the masses, i.e., at each floor level in the center of the masses. Furthermore, incidental irregularity is carefully considered to account for uncertainty in the determination of the building’s center of mass. For both the x (longitudinal) and y (transversal) directions, 3% of the structure's height perpendicular to the seismic load direction is considered on each side.

Pushover in the y-direction with a mode shape associated with a period of T = 0.26 s

Pushover mode shape in the x-direction, associated with a period T = 0.13 s
In a 3D model, floors are considered as horizontally stiff diaphragms, which is realistic due to the true in-plane rigidity of the horizontal floor elements. In software, rigid diaphragms' in-plane rigidity is limitless, and the mass of the real slab is considered. The roof is removed from the load-bearing structure in the seismic analysis since it has no substantial effect on the structure's reaction and does not contribute to the building's overall resistance. Although it did not meet the criteria, its significance to the model in the form of force was not disregarded.
The numerical model's average values of material parameters (Table 4) are based on an analysis of relevant literature (Ghiassi et al. 2019; EC06 2021) as well as on-site testing. Knowledge level 2 (normal knowledge) can be characterized in terms of experimental in situ testing and extensive study of the structure. The confidence factor was set at 1.2 based on the attained knowledge level.
According to the study in (EC06 2021), the building is characterized as normal in height but irregular in floor design, necessitating 3D modeling. The structure is designated as a torsional stiff system. First, static analysis is carried out according to EC06 (2021) followed by dynamic analysis.
Because seismic resilience is crucial given the consequences of a catastrophe, the pedagogical facility is designated as having relevance class II. As a result, the significance factor is I = 1.2. For two limit states, three PGA values are employed.
The capacity curve represented the ratio of shear force at the structure's base to control node displacement resulting from the seismic analysis. The control node was chosen to be close to the center of mass and is positioned on the building's top story. Figure 29 displays the capacity curves generated from all investigations. Figures 30 and 31 show bi-linearized pushover curves in the x and y axes, respectively. The y-axis shows total base shear in kN, while the x-axis shows control node displacement in mm.

Pushover curves for the x (blue) and y (red) axes
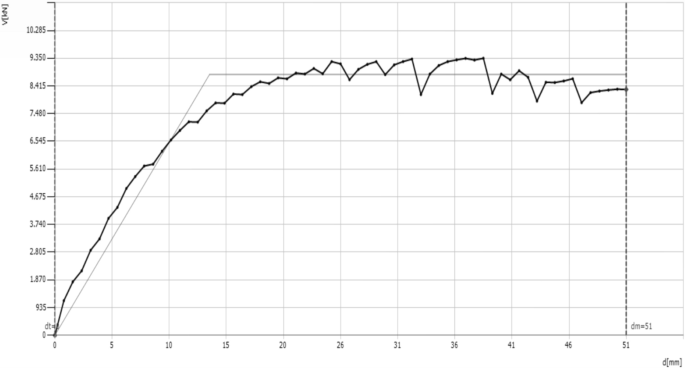
The most relevant pushover curve for the x-direction
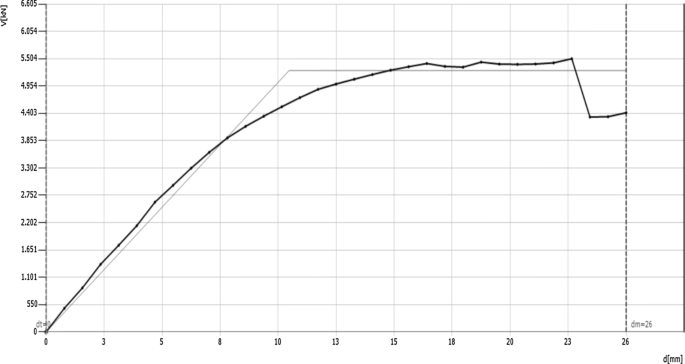
The most relevant pushover curve for the y-direction
Figures 32 and 33 show the damaged condition until the last stage of the pushover curves in the x and y-axis, with yellow indicating shear damage and red indicating bending damage.

Damage at maximum displacement capacity for x-direction pushover. Yellow: shear damage, red: bending damage

Damage at maximum displacement capacity for y-direction pushover. Yellow: shear damage, red: bending damage
The structure's capacity is assessed after the structure's response, and inspections are carried out in line with the fundamental standards pertaining to the status of extensive damage, as defined by limit states. Table 5 shows the parameters for similar SDOF systems from Figs. 32 and 33. These characteristics are determined through bilinearization by employing the associated energy concept that is used to calculate target movement.
The ratio α of the building's limit capacity acceleration to the reference peak ground acceleration on type A ground is also presented in Table 6. For all limit states, the parameter is provided. An issue emerges with historic masonry structures, which are frequently unable to be strengthened to the extent required to meet today's seismic-resistant construction requirements.
A study of the walls out-of-plane bending must then be performed. This explains the earthquake activity that occurs perpendicular to the walls. The investigation is carried out for the limited situation that is on the verge of collapsing. Acceleration for a 475-year return period is used. If a wall's MRd/MEd ratio is greater than or equal to 1.0, it is considered to have passed the out-of-plane bending test. In Fig. 34, the walls that failed the examination are shown in red.

Out-of-plane bending findings. Red: bending damage
In the global study, the 3Muri software also does not take the out-of-plane loss of stability into account. It is believed that appropriate connections are created across walls and diaphragms. Out-of-plane local processes are thus avoided, allowing the global in-plane response of the structure to be studied (Lagomarsino et al. 2013). Therefore, the resistance to consolidation is put to the test in a specific program unit; specific elements of a single wall are tested, as well as the interaction of parts of many distinct walls that can generate various local mechanisms when combined. A local mechanism is seen in Fig. 35, with the mechanical component.
Example of a local mechanism
Local mechanisms are arbitrarily established based on the geometry of the building, common failure mechanisms, and seismic damage. Local mechanisms commonly emerge because of faulty wall and wall-to-floor structural connections. The linear kinematic analysis method is applied. There are three phases to defining a local mechanism. To begin, a kinematic block is a stiff wall element that is sensitive to movement or tilting in relation to another block or the whole of the wall. The initial conditions are then found, and the load is finally calculated. Several of the local progressive collapse of the apparent building, as well as its resistance to the types of failure shown, are listed below (Fig. 36 and Table 7). The ratio of the response spectrum of mechanical activation to the response spectrum of earthquake excitation is represented by the α parameter.
The local mechanisms LM1 (east wing), LM2 (right wing), and LM3 (left wing) are represented in the diagram (central wing)
8 Discussion and conclusions
Based on case studies from recent seismic events in Japan and Italy, (Da Porto et al. 2013; Lucibello et al. 2013; Formisano 2017; Formisano and Marzo 2017; Boschi et al. 2018; Chieffo and Formisano 2019; Malcata et al. 2020), the structure under study was assessed to determine its earthquake resilience. The Mila, Algeria’s recent earthquake damaged the structure. The building was not built according to seismic design principles. However, the repair and retrofit improved the structure's condition. Transverse walls are added, and old timber beams are replaced with reinforced concrete flooring. Such stiff diaphragms provide a good connection between all walls and, as a result, improved the seismic behavior of the structure. Therefore, enhancing the rigidity of conventional timber flooring in ancient brick buildings is frequently one of the first seismic retrofitting procedures. On the other hand, a recent study shows that replacing traditional hardwood floors with rigid diaphragms, such as RC flooring, improves energy efficiency. Cracks on the edges of the two materials, or, in the worst-case scenario, disintegration, and collapse of the masonry walls, might be the consequence. This strategy, however, is effective for earthquakes of expected smaller magnitudes, such as those in Mila, and serves to reinforce the existing structure against horizontal actions.
We described the damage to Mila's historic downtown following the earthquake on August 7, 2020. Despite previous calls from the scientific and technical communities, the earthquake demonstrated and verified that awareness, vulnerability mitigation, and readiness are critical to preventing catastrophic seismic consequences and enabling timely action after an earthquake. Although of low magnitude, the Mila earthquake inflicted major damage and economic loss, as well as exposed many weaknesses in the built heritage that people, decision-makers, and the professional and scientific community will have to address for many years to come. The earthquake severely destroyed older masonry structures built before seismic standards were enforced.
The information obtained during the rapid post-earthquake assessment was analyzed and discussed. Damages are graphically shown and illustrated by images. This report examines preliminary data from the database that was enhanced by field engineers. Forms for rapid post-earthquake building evaluation were developed shortly after the 1980 earthquake, and similar forms were used after subsequent earthquakes such as the Tipaza and Zemmouri earthquakes. The findings of the rapid evaluations must be calibrated and reconciled with the extensive reviews provided by the new Act for the rehabilitation of Mila city. In the impacted region, 1044 structures have been identified as severely damaged and will be submitted to further inspections.
3 Muri and an analogous frame approach were used to analyze the existing unconfined masonry structure. Because of its multiple advantages, non-linear static (pushover) seismic analysis is used instead of linear seismic analysis. For the 100, 225, and 475-year return periods, limit state checks were performed. In terms of the structure's existing wall distribution, the results are consistent with the expected behavior. The construction becomes less stiff and has higher displacements in the y direction. Furthermore, the structure's capacity is reduced in the y-direction. There is also some irregularity between the centers of stiffness and mass, which causes torsion to have a minor but unfavorable influence on the overall behavior of the structure. The middle stairwell's walls, as well as the west side of the structure’s cross walls, are crucial elements. Out-of-plane bending failure of walls was also investigated. Using linear kinematics, the causes of failure mode were also examined. The actual damage was compared to the damage calculated using the 3Muri software's non-linear static seismic analysis. From the examination of the structure's behavior during an earthquake, it is evident that strengthening is necessary to improve the structure's seismic performance. An earthquake's damage must be repaired to avoid future damage and threat to the structure's overall strength and stability.
The main results of the investigated area of the city are that the damaged structures are typically older and were built before seismic regulations were implemented. The building materials have degraded over time. Furthermore, the structures are typically under-maintained and, in many cases, designed as seismically deficient. Local (rather than global) in-plane and out-of-plane mechanisms were the most typical failure modes. Significant damage has been found in secondary and/or ornamental building components. Buildings collapsing all at once were extremely infrequent. Aside from concerns with the existing susceptible building stock built prior to seismic regulations, the amount of damage was compounded owing to unlawful conversion of ground levels for commercial activity. There appears to be a widespread lack of understanding and perception of seismic danger in the population, as well as a lack of preventative information dissemination aimed at boosting awareness.
As a result of the several devastating earthquakes that have struck Algeria, the ability to 'build back better’ is much valued. This involves using sustainable resources and producing new ideas (Funari et al. 2020, 2021; Stepinac et al. 2020) should be implemented, and energy efficiency should be ensured (Milovanovic and Bagaric 2020; Valluzzi et al. 2021). Buildings made of masonry can be strengthened using a variety of techniques (Ortega et al. 2017; Kouris and Triantafillou 2018; Skejic et al. 2020). Due to their compatibility and reversibility, materials like FRP (Fiber-Reinforced Polymers) and TRM (Textile-Reinforced Mortars) can be used.
Data availability
All data generated or analyzed during this study are included in this article.
References
Akkouche K, Hannachi NE, Hamizi M et al. (2019) Knowledge-based system for damage assessment after earthquake: Algerian buildings case. Asian J Civ Eng 20:769–784. https://doi.org/10.1007/s42107-019-00143-z
Allali SA, Abed M, Mebarki A (2018) Post-earthquake assessment of buildings damage using fuzzy logic. Eng Struct 166:117–127. https://doi.org/10.1016/j.engstruct.2018.03.055
Amari K, Abdessemed F, Cheikh Zouaoui M, Uva G (2020) Seismic vulnerability of masonry lighthouses: a study of the bengut lighthouse, Dellys, Boumerdès, Algeria. Buildings 10:247. https://doi.org/10.3390/buildings10120247
ARES (2021) Project first Workshop. Available online: www.grad.hr/ares (Accessed on 15 Feb 2021)
Atalić J, Šavor Novak M, Uroš M (2019) Seismic risk for Croatia: overview of research activities and present assessments with guidelines for the future. Građevinar 71(10):923–947
Athmania D, Benaissa A, Hammadi A, Bouassida M (2010) Clay and marl formation susceptibility in Mila Province. Algeria Geotech Geol Eng 28(6):805–813. https://doi.org/10.1007/s10706-010-9341-5
Baggio C, Bernardini A, Colozza R, Corazza L, Bella M, Di Pasquale G, Dolce M, Goretti A, Martinelli A, Orsini G et al. (2007) Field manual for post-earthquake damage and safety assessment and short-term countermeasures (AeDES), JRC Sci, Thechnical Reports. 1–100
Bechtoula H, Ousalem H (2005) The 21 May 2003 Zemmouri (Algeria) earthquake: damages and disaster responses. J Adv Concr Technol 3(1):161–174
Belazougui M (2008) Boumerdes Algeria earthquake of May 21, 2003: damage analysis and behavior of beam-column reinforced concrete structures. In: proceedings of the 14th world conference on earthquake engineering, Beijing, Paper 14_01–1006
Benfedda A, Serkhane A, Bouhadad Y, Slimani A, Abbouda M, Bourenane H (2021) The main events of the July-August 2020 Mila (NE Algeria) seismic sequence and the triggered landslides. Arab J Geosci 14:1894. https://doi.org/10.1007/s12517-021-08301-x
Betti M, Bonora V, Galano L, Pellis E, Tucci G, Vignoli A (2021) An integrated geometric and material survey for the conservation of heritage masonry structures. Heritage 4:35
Bialas J, Oommen T, Rebbapragada U, Levin E (2016) Object-based classification of earthquake damage from high-resolution optical imagery using machine learning. J Appl Remote Sens 10(03):036025
Binda L, Saisi A, Tiraboschi C (2000) Investigation procedures for the diagnosis of historic masonries. Constr Build Mater 14(4):199–233. https://doi.org/10.1016/S0950-0618(00)00018-0
Boschi S, Borghini A, Pintucchi B, Bento R, Milani G (2018) Seismic vulnerability of historic masonry buildings: a case study in the center of Lucca. Procedia Struct Integr 11:169–176
Boukri M, Farsi MN, Mebarki A, Belazougui M (2013) Development of an integrated approach for Algerian building seismic damage assessment. Struct Eng Mech 47(4):471–493. https://doi.org/10.12989/SEM.2013.47.4.471
Boulahia O (2022) Identification, characterization and interaction of seismic sources: Implication on sequences of seismic events of the period 2010–2021 in the North-East of Algeria Doctoral thesis at Sétif University. http://dspace.univ-setif.dz:8888/jspui/handle/123456789/3956
Bounemeur N, Benzaid R, Kherrouba H et al. (2022) Landslides in Mila town (northeast Algeria): causes and consequences. Arab J Geosci 15:753. https://doi.org/10.1007/s12517-022-09959-7
Bounif MA, Haessler H, Meghraoui M (1987) The Constantine earthquake of October 27, 1985: surface ruptures and aftershock study. Earth Planet Sci Lett 85:451–460
Casapulla C, Argiento LU, Maione A (2018) Seismic safety assessment of a masonry building according to Italian Guidelines on cultural heritage: simplified mechanical-based approach and pushover analysis. Bull Earthq Eng 16:2809–2837
Cerovecki A, Kraus I, Moric D (2018) N2 building design method. Gradjevinar 70:509–518
Chieffo N, Formisano A (2019) Comparative seismic assessment methods for masonry building aggregates: a case study. Front Built Environ 5:123
Chimouni R, Harbi A, Boughacha MS, Hamidatou M, Kherchouche R, Sebaï A (2018) The 1790 Oran earthquake, a seismic event in times of conflict along the Algerian coast: a critical review from western and local source materials. Seismol Res Lett 89(6):2392–2403. https://doi.org/10.1785/0220180175
Coiffait PE (1992) A post-nappe basin in its structural framework: The example of the Constantine basin (North-East Algeria). Dessertation, University of Nancy
Da Porto F, Munari M, Prota A, Modena C (2013) Analysis and repair of clustered buildings: case study of a block in the historic city center of L’Aquila (Central Italy). Constr Build Mater 38:1221–1237
Dall’Asta A, Leoni G, Meschini A, Petrucci E, Zona A (2019) Integrated approach for seismic vulnerability analysis of historic massive defensive structures. J Cult Herit 35:86–98
De Luca FGED, Woods C, Galasso D, D’Ayala RC (2018) In filled building performance against the evidence of the 2016 EEFIT Central Italy post-earthquake reconnaissance mission: empirical fragilities and comparison with the FAST method. Bull Earthq Eng 16(7):2943–2969. https://doi.org/10.1007/s10518-017-0289-1
Didier M, Baumberger S, Tobler R, Esposito S, Ghosh S, Stojadinovic B (2017) Improving post-earthquake building safety evaluation using the 2015 Gorkha, Nepal, Earthquake rapid visual damage assessment data. Earthq Spectra 33:415–438
Durand DM (1969) Focus on the structure of the Northeast of the BERBERIE. Bull Serv Carte Geol Agerie NS 39:89–131
EMS (1998) Comision Sismologica Europea, Escala Macro Sísmica Europea EMS 98(15)
Endo Y, Pelà L, Roca P (2017) Review of different pushover analysis methods applied to masonry buildings and comparison with nonlinear dynamic analysis. J Earthq Eng 21:1234–1255
Eurocode 6 (2021) Design of masonry structures—Part 1–1: general rules for reinforced and unreinforced masonry structures. Available online: https://www.phd.eng.br/wp-content/uploads/2015/02/en.1996.1.1.2005.pdf
Eurocode 8 (2004a): Design of structures for earthquake resistance—Part 1: general rules, seismic actions and rules for buildings. EN 1998–1: European Committee for Standardization, Brussels. https://www.phd.eng.br/wp-content/uploads/2015/02/en.1998.1.2004a.pdf
Eurocode 8 (2004b) Design of structures for earthquake resistance—Part 3: assessment and retrofitting of buildings. Available online: https://www.phd.eng.br/wp-content/uploads/2014/07/en.1998.3.2005.pdf
Fajfar P, Fischinger M (1998) N2—a method for non-linear seismic analysis of regular buildings. In: proceedings of the 9th world conference in earthquake engineering, Tokyo-Kyoto, Japan, 2–9 August 1998, pp 111–116
Farsi MN, Belazougui M (1992) The Mont Chenoua (Algeria) earthquake of October 29th 1989; damage assessement and distribution", Proceedings of the 10th world conference on earthquake engineering, Madrid, Spain
Formisano A (2017) Theoretical and numerical seismic analysis of masonry building aggregates: case studies in San Pio Delle Camere (L’Aquila, Italy). J Earthq Eng 21:227–245
Formisano A, Marzo A (2017) Simplified and refined methods for seismic vulnerability assessment and retrofitting of an Italian cultural heritage masonry building. Comput Struct 180:13–26
Funari MF, Mehrotra A, Lourenço PB (2021) A tool for the rapid seismic assessment of historic masonry structures based on limit analysis optimisation and rocking dynamics. Appl Sci 11:942
Funari MF, Spadea S, Lonetti P, Fabbrocino F, Luciano R (2020) Visual programming for structural assessment of out-of-plane mechanisms in historic masonry structures. J Build Eng 31:101425
Ghiassi B, Vermelfoort AT, Lourenço PB (2019) Masonry Mechanical Properties. In: Numerical modeling of masonry and historical structures. Woodhead Publishing, pp 239–261
Grillanda N, Valente M, Milani G, Chiozzi A, Tralli A (2020) Advanced numerical strategies for seismic assessment of historical masonry aggregates. Eng Struct 212:110441
Guemache MA, Machane D, Beldjoudi H, Gharbi S, Djadia L, Benahmed S, Ymmel H (2010) On a damaging earthquake-induced landslide in the Algerian Alps: the March 20, 2006 Laâlam landslide (Babors chain, northeast Algeria), triggered by the Kherrata earthquake (Mw = 5 3). Nat Hazards 54(2):273–288. https://doi.org/10.1007/s11069-009-9467-z
Halla N, Hamidatou M, Hamai L, Atmane L, Yelles chaouche A (2022) Earthquake induced landslide in Milla region: the August 07, 2020 (El-Kherba, Grarem-Gouga and Azzeba) landslides Northeast Algeria, triggered by the Mila earthquake (Mw = 5). In process for publication, Naturals hazards journal
Hamidatou M, Mohammedi Y, Hallal N, Yelles-Chaouche A, Lebdioui S, Thallak I, Stromeyer D, Khemici O (2021) Reply to the comment on the paper “seismic hazard analysis of surface level, using topographic condition in Northeast of Algeria” by Mohamed Hamdache and José A. Pelàez. Pure Appl Geophys 178:305–312. https://doi.org/10.1007/s00024-020-02644-4
Hamidatou M, Mohammedi Y, Yelles-Chaouche A, Thallak I, Stromeyer D, Lebdioui S, Cotton F, Hallal N, Khemici O (2019) Seismic hazard analysis of surface level, using topographic condition in the Northeast of Algeria. Pure Appl Geophys 178(3):823–846. https://doi.org/10.1007/s00024-019-023104
Hamidatou M, Sbartai B (2016) Deterministic assessment of seismic risk in Constantine city, Northeast Algeria. Nat Hazards 86(2):441–464. https://doi.org/10.1007/s11069-016-2693-2
Hamidatou M, Sbartai B (2017) Probabilistic seismic hazard assessment in the Constantine region, Northeast of Algeria. Arab J Geosci 10(6):1–20. https://doi.org/10.1007/s12517017-2876-5
Harbi A, Maouche S, Ousadou F, Rouchiche Y, Yelles-Chaouche A, Merahi M, Heddar A, Nouar O, Kherroubi A, Beldjoudi H, Ayadi A, Benouar D (2007) Macroseismic study of the Zemmouri earthquake of 21 May 2003 (Mw 6.8, Algeria). Earthq Spectra 23(2):315–332
Harbi A, Maouche S, Vaccari F, Aoudia A, Oussadou F, Panza GF, Benouar D (2007b) Seismicity, seismic input and site effects in the Sahel-Algiers Region (North Algeria). Soil Dyn Earth Eng 27(5):427–447
Harbi A, Meghraoui M, Maouche S (2011) The Djidjelli (Algeria) earthquakes of 21 and 22 August 1856 (I0 VIII, IX) and related tsunami effects Revisited. J Seismol 15:105–129. https://doi.org/10.1007/s10950-010-9212-9
Hellel M, Chatelain JL, Guillier B, Machane D, Ben Salem R, Oubaiche E, Haddoum H (2010) Heavier damages without site effects and site effects with lighter damages: Boumerdes City (Algeria) after the May 2003 earthquake. Seismol Res Lett 81(1):37–43. https://doi.org/10.1785/gssrl.81.1.37
Hichem N, Ahmed M, Mohamed A (2019) Post-quake structural damage evaluation by neural networks: theory and calibration. Eur J Environ Civ Eng 23:710–727. https://doi.org/10.1080/19648189.2017.1304277
Indirli MS, Kouris LA, Formisano L, Borg RP, Mazzolani FM (2013) Seismic damage assessment of unreinforced masonry structures after the abruzzo 2009 earthquake: the case study of the historical centers of L’Aquila and castelvecchio subequo. Int J Architect Herit 7(5):536–578. https://doi.org/10.1080/15583058.2011.654050
Karimzadeh S, Askan A, Erberik MA, Yakut A (2018) Seismic damage assessment based on regional synthetic ground motion dataset: a case study for Erzincan, Turkey. Nat Hazards 92(3):1371–1397
Karimzadeh S, Kadas K, Askan A, Erberik MA, Yakut A (2020) Derivation of analytical fragility curves using SDOF models of masonry structures in Erzincan (Turkey). Earthq Struct 18(2):249–261
Kim T, Song J, Kwon OS (2020) Pre- and post-earthquake regional loss assessment using deep learning. Earthq Eng Struct Dyn 49:657–678
Kouris LAS, Triantafillou TC (2018) State-of-the-art on strengthening of masonry structures with textile reinforced mortar (TRM). Constr Build Mater 188:1221–1233
Lagomarsino S, Penna A, Galasco A, Cattari S (2013) TREMURI program: an equivalent frame model for the nonlinear seismic analysis of masonry buildings. Eng Struct 56:1787–1799
Lamego P, Lourenço PB, Sousa ML, Marques R (2017) Seismic vulnerability and risk analysis of the old building stock at urban scale: application to a neighbourhood in Lisbon. Bull Earthq Eng 15:2901–2937
Laouami N, Slimani A, Larbes S (2018) Ground motion prediction equations for Algeria and surrounding region using site classification based H/V spectral ratio. Bull Earthq Eng 16(7):2653–2684. https://doi.org/10.1007/s10518-018-0310-3
Laouami N, Slimani N, Bouhadad Y, Chatelain JL, Nour A (2006) Evidence for fault-related directionality and localized site effects from strong motion recordings of the 2003 Boumerdes (Algeria) earthquake: consequences on damage distribution and the Algerian Seismic Code. Soil Dyn Earth Eng 26:991–1003. https://doi.org/10.1016/j.soildyn.2006.03.006
Lourenco P, Karanikoloudis G (2019) Seismic behavior and assessment of masonry heritage structures. Needs in engineering judgement and education. RILEM Tech Lett 3:114–120
Lucibello G, Brandonisio G, Mele E, De Luca A (2013) Seismic damage and performance of Palazzo Centi after L’Aquila earthquake: a paradigmatic case study of effectiveness of mechanical steel ties. Eng Fail Anal 34:407–430
Malcata M, Ponte M, Tiberti S, Bento R, Milani G (2020) Failure analysis of a Portuguese cultural heritage masterpiece: Bonet building in Sintra. Eng Fail Anal 115:104636
Marmi R, Kacimi M, Boularak M (2008) Landslides in the Mila region (North-Eastern Algeria): impact on infrastructure. Revista De Geomorphologie 10:51–56
Marshall JD, Jaiswal K, Gould N, Turner F, Lizundia B, Barnes JC (2013) Post-earthquake building safety inspection: lessons from the canterbury, New Zealand, earthquakes. Earthq Spectra 29:1091–1107
Medhat NI, Yamamoto M-Y, Tolomei C, Harbi A, Maouche S (2022) Multi-temporal InSAR analysis to monitor landslides using the small baseline subset (SBAS) approach in the Mila Basin, Algeria, Terra Nova published by John Wiley & Sons Ltd. https://doi.org/10.1111/ter.12591
Mehani Y, Bechtoula H, Kibboua A, Naili M (2013) Assessment of seismic fragility curves for existing RC buildings in Algiers after the 2003 Boumerdes earthquake. Struct Eng Mech 46(6):791–808. https://doi.org/10.12989/SEM.2013.46.6.791
Merghadi A, Abderrahmane B, Tien Bui D (2018) Landslide susceptibility assessment at Mila Basin (Algeria): a comparative assessment of prediction capability of advanced machine learning methods. ISPRS Int J Geo Inf 7(7):268. https://doi.org/10.3390/ijgi7070268
Meslem A, Yamazaki F, Maruyama Y, Benouar D, Kibboua A, Mehani Y (2012) The effects of building characteristics and site conditions on the damage distribution in Boumerdès after the 2003 Algeria earthquake. Earthq Spectra 28(1):185–216. https://doi.org/10.1193/1.3675581
Milovanovic B, Bagaric M (2020) How to achieve nearly zero-energy buildings standard. Gradjevinar 72:703–720
Mouyiannou A, Rota M, Penna A, Magenes M (2014) Identification of suitable limit states from nonlinear dynamic analyses of masonry structures. J Earthq Eng 18:231–263
Naito S, Tomozawa H, Mori Y, Nagata T, Monma N, Nakamura H, Fujiwara H, Shoji G (2020) Building-damage detection method based on machine learning utilizing aerial photographs of the Kumamoto earthquake. Earthq Spectra 36:1166–1187
Ortega J, Vasconcelos G, Rodrigues H, Correia M (2018) Assessment of the influence of horizontal diaphragms on the seismic performance of vernacular buildings. Bull Earthq Eng 16:3871–3904
Ortega J, Vasconcelos G, Rodrigues H, Correia M, Ferreira TM, Vicente R (2019) Use of post-earthquake damage data to calibrate, validate and compare two seismic vulnerability assessment methods for vernacular architecture. Int J Disaster Risk Reduct 39:101242
Ortega J, Vasconcelos G, Rodrigues H, Correia M, Lourenço PB (2017) Traditional earthquake resistant techniques for vernacular architecture and local seismic cultures: a literature review. J Cult Herit 27:181–196. https://doi.org/10.1016/j.culher.02.015
Ousadou F, Dorbath L, Dorbath C, Bounif MA, Benhallou H (2012) The Constantine (Algeria) seismic sequence of 27 October 1985: a new rupture model from aftershock relocation, focal mechanisms, and stress tensors. J Seismol 17(2):207–222
Palazzi NC, Barrientos M, Sandoval C de la Llera JC (2022) Seismic Vulnerability Assessment of the Yungay's Historic Urban Center in Santiago, Chile. J Earthq Eng 1–28
Penna AP, Morandi M, Rota CF, Manzini F, Da Porto G (2014) Magenes, Performance of masonry buildings during the Emilia 2012 earthquake. Bull Earthq Eng 12(5):2255–2273. https://doi.org/10.1007/s10518-013-9496-6
Raoult JF (1974) Geology of the Center of the numidic chain (North Constantinois, Algeria). Thesis Paris Mem Soc Geol 121: 63
Remki M, Benouar D (2014) Damage potential and vulnerability functions of strategic buildings in the city of Algiers. KSCE J Civ Eng 18:1726–1734. https://doi.org/10.1007/s12205-014-0184-0
Rodríguez AS, Rodríguez BR, Rodríguez MS, Sánchez PA (2019) 9-Laser scanning and its applications to damage detection and monitoring in masonry structures. In: Ghiassi B, Lourenço PB (eds) Woodhead Publishing Series in Civil and Structural Engineering, Long-term Performance and Durability of Masonry Structures, Woodhead Publishing, pp 265–285
RPA (2003) Algerian Earthquake Rules 1999. Version 2003. National Center of Applied Research in Earthquake Engineering (CGS)
Semmane F, Abacha I, Yelles-Chaouche AK et al. (2012) The earthquake swarm of December 2007 in the Mila region of northeastern Algeria. Nat Hazards 64:1855–1871. https://doi.org/10.1007/s11069-012-0338-7
Skejic D, Lukacevic I, Curkovic I, Cudina I (2020) Application of steel in refurbishment of earthquake-prone buildings. Gradjevinar 72:955–966
Smail T, Abed M, Mebarki A, Lazecky M (2022) Earthquake-induced landslide monitoring and survey by means of InSAR. Nat Hazards Earth Syst Sci 22:1609–1625. https://doi.org/10.5194/nhess-22-1609-2022
Stepinac M, Gašparovic M (2020) A review of emerging technologies for an assessment of safety and seismic vulnerability and damage detection of existing masonry structures. Appl Sci 10:5060
Stepinac M, Kisicek T, Renic T, Hafner I, Bedon C (2020) Methods for the assessment of critical properties in existing masonry structures under seismic loads-The ARES project. Appl Sci 10(5):1576. https://doi.org/10.3390/app10051576
Stepinac M, Rajcic V, Barbalic J (2017) Inspection and condition assessment of existing timber structures. Gradjevinar 69:861–873
Tebbouche MY, Ait Benamar D, Hassan HM et al. (2022) Characterization of El Kherba landslide triggered by the August 07, 2020, Mw = 4.9 Mila earthquake (Algeria) ambient noise analysis. Environ Earth Sci 81:46. https://doi.org/10.1007/s12665-022-10172-8
Uroš M, Šavor Novak M, Atalc J, Sigmund Z, Banicek M, Demšic M, Hak S (2020) Post-earthquake damage assessment of buildings–procedure for conducting building inspections. Gradjevinar 72:1089–1115
Valente M, Milani G (2019) Damage assessment and collapse investigation of three historical masonry palaces under seismic actions. Eng Fail Anal 98:10–37
Valluzzi MR, Salvalaggio M, Croatto G, Dorigatti G, Turrini U (2021) Nested buildings: an innovative strategy for the integrated seismic and energy retrofit of existing masonry buildings with CLT panels. Sustainability 13:1188
Vila JM (1980) Geological map at 1/50.000. Dissertation, University of Paris VI
Vlachakis G, Vlachaki E, Lourenço PB (2020) Learning from failure: damage and failure of masonry structures, after the 2017 lesvos earthquake (Greece). Eng Fail Anal 117:104803. https://doi.org/10.1016/j.engfailanal
Yavari S, Chang SE, Elwood KJ (2010) Modeling post-earthquake functionality of regional health care facilities. Earthq Spectra 26:869–892
Zhang Y, Burton HV, Sun H, Shokrabadi M (2018) A machine-learning framework for assessing post-earthquake structural safety. Struct Saf 72:1–16
Funding
This paper did not receive any funding.
Author information
Authors and Affiliations
Corresponding author
Ethics declarations
Conflict of interest
The authors declare no conflict of interest. The funders had no role in the design of the study; in the collection, analyses, or interpretation of data; in the writing of the manuscript, or in the decision to publish the results.
Additional information
Publisher's Note
Springer Nature remains neutral with regard to jurisdictional claims in published maps and institutional affiliations.
Rights and permissions
Springer Nature or its licensor (e.g. a society or other partner) holds exclusive rights to this article under a publishing agreement with the author(s) or other rightsholder(s); author self-archiving of the accepted manuscript version of this article is solely governed by the terms of such publishing agreement and applicable law.
About this article

Cite this article
Mouloud, H., Chaker, A., Nassim, H. et al. Post-earthquake damage classification and assessment: case study of the residential buildings after the Mw = 5 earthquake in Mila city, Northeast Algeria on August 7, 2020. Bull Earthquake Eng 21, 849–891 (2023). https://doi.org/10.1007/s10518-022-01568-9
Received:
Accepted:
Published:
Issue Date:
DOI: https://doi.org/10.1007/s10518-022-01568-9