
Abstract
The aim of this study is to formulate an algorithm for the calculation of maximum inscribed circle (MIC) that can be placed within a polygon and to implement it by using free and open source software (FOSS) for GIS. MIC is used in a wide range of fields, ranging from cartography, planning, agriculture, forestry and geology to medicine, biology, astronomy, security, and engineering applications. Due to the complexity of the problem, there is no single and simple algorithm for the computation of MIC for arbitrary polygons. The algorithm developed in this study (MICGIS) for the computation of MIC can be applied to both convex and concave polygons represented in vector data format. MICGIS makes use of the Voronoi diagrams and geometrical properties by benefiting from the solutions proposed for the special cases of Apollonius’ Problem. Thanks to the employment of Voronoi diagrams and FOSS for GIS, MICGIS also works successfully for polygons with holes. For the implementation of MICGIS, FOSS libraries written in Java are used. What is evident from the various runs of the script produced on the base of MICGIS for a set of arbitrary polygons is that it is both faster and more accurate in finding MIC compared with the alternative algorithms and software.
1 Introduction
Maximum inscribed circle (MIC), also known as biggest inner circle (BIC) or largest inner circle (LIC), is used in a wide range of fields; however, its particular use changes from one field to the other depending upon the purpose of the scientists and experts in the respective field. In cartography, Shen et al. (2015) used MIC for georeferencing purposes. Based on MIC, Sun (2016) developed a map distortion symbolization approach, and Tauscher and Neumann (2016) developed a displacement method for maps showing dense sets of points of interest. Agafonkin (2016) suggests the use of centroid of MIC for placing labels on polygons in a map. In planning, Li et al. (2013) remark that MIC can be used in order to measure the compactness of two-dimensional shapes. Particularly, in landscape planning, Walz and Schumacher (2005) employed MIC in order to quantify the depth of the minimal undisturbed area in the open space. In urban planning and design, Brezina et al. (2017) utilized MIC in order to derive a representative width of sidewalk, and Cavic et al. (2017) used MIC in the analysis of open public space. In public administration, Butsch (2016) and Saxon (2020) used MIC in order to measure compactness of areas for districting purposes. In geography, MacEachren (1985) employed MIC again in order to measure the compactness, and Garcia-Castellanos and Lombardo (2007) used MIC in order to find the poles of inaccessibility. MICs can also be used in landscape, forestry and agriculture in order to delineate single trees in groups of trees that could not be separated (Weinacker et al. 2004; Aschoff and Spiecker 2004; Koch et al. 2006; Hadaś 2015). Li et al. (2017) also used MIC as a parameter in order to classify diospyros lotus seeds.
Compared with other fields, employment of MIC in geology has a long history. In geology, MIC was first used by Wadell (1932, 1933, 1935) in order to measure the roundness of rock and quartz particles. It is widely used in geology and improved in many studies in the subsequent years (e.g., Powers 1953; Zheng and Hryciw 2015). In biology, Tsygankov et al. (2014) used MIC in order to define and detect filopodia-like protrusions, and in medicine, Vogt et al. (2017) and Brune et al. (2018) utilized MIC in order to measure and classify pores of surgical meshes. Taghanaki et al. (2017) also employed MIC in order to localize the pectoral muscle located posterior to the breast. In astronomy, Alonso et al. (2018) suggest that MIC can be used in order to find large empty spaces in the universe, and in archeology (Davis et al. 2015) used MIC in order to analyze lithic artifacts. For the localization of jammers in the field of security applications, Cheng et al. (2012) developed an algorithm called Double Circle Localization partly based on MIC. MIC is actually used for various purposes in many engineering fields. For example, Jones (2014) used MICs in order to reveal ‘a nest of patterns to be cut from a roll of cloth and later sewn together to make the seats and headrests for a car.’ Gass et al. (1998), Sun and Che (2003), Petrík et al. (2009), Fanwu et al. (2011), and Liu et al. (2016) employed MIC in order to measure roundness error of mechanical parts.
In the calculation of MIC, one of the relevant issues is the preference for the type of the spatial data model (raster vs. vector) used in the implementation of the algorithm developed for MIC. In raster data model, the spatial information is represented by creating matrix of pixels in the form of an image. It is observed that in some software programs (such as ‘Max Inscribed Circles’ plugin developed by Burri and Guiet (2016) for ImageJ and CellGeo developed by Tsygankov et al. (2014) for MATLAB) MIC is calculated for images. In their code, Burri and Guiet (2016) are inspired by Birdal’s (2011) ‘Maximum Inscribed Circle using Distance Transform’ developed for MATLAB. As Birdal (2011) remarks, the reasonable way of solving MIC problem is actually ‘to make use of Voronoi Diagrams.’ In this respect, cvoronoi developed by Masset (2002) and ‘Maximum Inscribed Circle using Voronoi Diagram’ developed by Birdal (2013) for MATLAB make use of Voronoi diagrams and vector data in order to find MIC. Employment of vector data model in which spatial features are represented by using x and y coordinate pairs is widespread in many other software programs or extensions developed for finding MIC. For example, ET GeoWizards (2018) extension for ArcGIS Desktop (ESRI 2015) calculates MIC for vector data. Another tool calculating the center and radius of MIC in QGIS (2019) is Pole of Inaccessibility tool that is based on the ‘polylabel’ algorithm developed by Agafonkin (2016) for Mapbox. In addition to QGIS (2019) and ArcGIS Desktop (ESRI 2015), LayoutEditor (Thies 2018), SAGA (2018) and Flowmap (2013) have also similar functions or extensions for vector data.
Although, as evident from above, there are some software programs that can be used for finding MIC in a polygon, it is not possible to obtain neither the algorithm nor the source code of the proprietary software programs having functions or plugins to calculate MIC, albeit some proprietary software vendors may have good documentation providing information on the implemented algorithms. In the case of FOSS, while the source code can be downloaded, again, the algorithms developed for MIC calculation are not usually provided with a detailed description. Thus, there is a huge gap between the availability of the algorithms and their implementation as a software script. By tracing the background for, on the one hand, the theoretical discussions in relation to the delimitation of MIC, and on the other hand, the conceptual framework of the existing scripts for which some descriptions are available about the algorithms employed for MIC calculation, this study reveals that this gap can be extended to the conception of the problem addressed. As it is elaborated in a detailed context in the subsequent sections, existing algorithms used in the MIC approximation require a large set of input points for this task. The present study reveals that near perfect approximation of MIC can be realized by using a limited number of input points and employing the analytical/geometrical properties of the polygon, its edges and the vertices of Voronoi diagram inside the polygon in conjunction with their general spatial configuration.
Within the framework drawn above, the aim of this paper is to develop an efficient algorithm (MICGIS) for the calculation of MIC that can be placed within a polygon in vector data format and to implement it in OpenJUMP (2019), a FOSS for GIS, as a plugin. For this purpose, in the next section the main characteristics and components of MICGIS algorithm are presented by overviewing the previous studies having connection to the calculation of MIC. After elaboration of these characteristics and components together with elaboration of previous studies, in the third section, the results of the implementation of MICGIS script in OpenJUMP are compared with the other software modules or extensions having the capability of finding MIC. In this subsection, only those software programs having capability to handle vector data are included in the comparison process. The last section of the paper draws on some concluding remarks based on the performance and characteristics of MICGIS in comparison with available software alternatives.
2 Framework and formulation of MICGIS
In this study, it is assumed that MIC is located along the medial axis (also known as main skeleton) of polygon. The medial axis (MA) was first introduced by Blum (1967) for description of shapes and has attracted the interest of researches from different fields. As defined by Blum (1967, p. 368), MA is ‘the locus of the points equidistant from the pattern.’ Based on this definition, it is known that MA of a polygon can be constructed by using Voronoi diagrams (Lee 1982; Attali and Montanvert 1997; Ramamurthy and Farouki 1999; Amenta et al. 2001) or Delaunay triangulation (Reddy and Turkiyyah 1995; Attali and Montanvert 1997; Amenta et al. 2001; Karimipour and Ghandehari 2013). By definition, Voronoi edges are the locus of points equidistant to two objects and closer to these two objects than to any other object, and ‘Voronoi vertices are the locus of points equidistant to three or more objects and closer to these objects than to any other object’ (Boissonnat et al. 2006). Thus, if a Voronoi diagram is created for the points corresponding to the nodes of a polygon, those Voronoi edges inside the polygon provide us with an approximation of the MA of polygon. In the case of Delaunay triangulation, which is actually the dual structure of the Voronoi diagram, MA can be defined as the locus of centers of circumscribed circles of each triangle. As Siddiqi et al. (2002) remark, provided that the polygon boundary is sampled densely, both Voronoi diagram and Delaunay triangulation result in the accurate approximation of MA.
In addition to the use of Voronoi diagrams and Delaunay triangulation, there are, actually, various methods for the construction of MA such as thinning (Lam et al. 1992), distance transform (Borgefors 1993), mathematical morphology (Arcelli and Frucci 1992; Talbot and Vincent 1992), and partial differential equations (Siddiqi et al. 2002). Kimmel et al. (1995), Attali and Montanvert (1997), and Karimipour and Ghandehari (2013) classify the methods developed for the extraction of MA into three categories: (1) discrete methods working on image representation of the objects, (2) continuous methods using polygonal approximation of shape boundary, and (3) exact methods based on the skeletonization of smooth shapes. This classification is also relevant to the preferred data model elaborated in the introduction. Accordingly, it is clear that although the first group of methods makes use of raster data model, the last two groups of methods are based on the vector data model. In this respect, it is observed that while it is not possible to obtain neither the algorithm nor the source code of the proprietary software programs having a function for MIC, the methods employed for the extraction of MIC in the scripts available as a FOSS can easily be affiliated with the categories given above in relation to classification of the methods developed for the extraction of MA.
Accordingly, from the documentation available for some scripts, it is inferred that while ‘Maximum Inscribed Circle using Distance Transform’ developed by Birdal (2011) and ‘Max Inscribed Circles’ plugin developed by Burri and Guiet (2016) fall into the category of discrete methods working on image representation of the objects, cvoronoi developed by Masset (2002), ‘Maximum Inscribed Circle using Voronoi Diagram’ developed by Birdal (2011) and CellGeo developed by Tsygankov et al. (2014) seem to fall into the category of continuous methods using polygonal approximation of shape boundary. For some of the scripts, it is observed that the data model used in the implementation of the algorithm is not consistent with the preferred method of extraction of MIC. For example, although Birdal (2013) and Tsygankov et al. (2014) initially use image as the input, they process it in order to obtain a vector representation of the boundary of the object subject to analysis. Since in this study it is assumed that the input data will be available in vector format, those scripts working on raster images could not be included in the comparison of MICGIS with the alternative software programs.
SAGA’s ‘Largest Circles in Polygons’ tool and QGIS’s ‘Pole of Inaccessibility’ tool have also interesting aspects compared with the others. In SAGA, the algorithm is implemented as tool chain by making use of existing modules and algorithms in SAGA. Accordingly, firstly, polygons are converted into polylines, and then, polylines are converted into a raster grid based on the resolution (cell size) given by the user. In his algorithm, Birdal (2011) also first traces the outline of the object in binary image format. In SAGA, subsequently, a proximity grid showing Euclidean distance to the boundary cells is produced based on the raster grid, and it is clipped with the original polygon boundaries. This is actually the process of distance transform as employed by discrete methods in order to assign a number to each pixel showing the distance between the pixel concerned and the nearest boundary pixel of binary image. After eliminating those cells having a value of 0, in SAGA, the cells having local maximum values are converted into point features that are subsequently treated as the centers of the largest circles in the polygon concerned by using the distances calculated for those cells in the proximity grid. As it is seen, in this case, just contrary to Birdal (2013) and Tsygankov et al. (2014), in SAGA initially vector data is used as the input, but subsequently it is converted into raster data in order to find the largest circles.
In the case of QGIS’s ‘Pole of Inaccessibility’ tool, it is observed that again an iterative grid-based algorithm inspired by the one developed by Garcia-Castellanos and Lombardo (2007) is formulated by Agafonkin (2016). Accordingly, first initial square cells completely covering the polygon and having a size equal to minimum of width and height are created, and then the distance from the center of each cell to the polygon is calculated (if the point is outside the polygon, negative value is used). Subsequently, the cells are put into a priority queue ranked by the maximum potential distance defined as the sum of the distance from the center to the polygon and the cell radius that is equal to one-half the diagonal of the cell. Then, the distance from the centroid of the polygon is calculated and it is designated as the first candidate point. The cells from the priority queue are selected one by one, and if a cell’s distance is better than the current best, it is marked as such. Based on the precision, if a potentially better solution is covered by the cell, it is divided into four offspring cells that are subsequently included in the queue. The algorithm stops when the queue has been exhausted and the best cell’s center is returned as the pole of inaccessibility.
In this study, in the calculation of MIC, we initially approximate the polygon’s MA by using Voronoi diagram, and subsequently, process it within a new framework in order to approximate MIC. In the literature cited above in relation to the extraction of MA, there is no direct and sole concern for the use of MA in order to calculate the polygon’s MIC. Nevertheless, it is known that the MIC must be one of the circles drawn around the MA and touching the polygon boundary. Indeed, by definition, MA can be considered as the union of centers of maximum-radius circles touching the polygon boundary in at least two points and inscribed within the polygon (Amenta et al. 1998; Ramamurthy and Farouki 1999). As remarked above, these maximum-radius circles, also known as maximal disks or maximal balls (for 3D objects), can be approximated by using the vertices of Voronoi diagram located inside the polygon (Attali and Montanvert 1997; Amenta et al. 1998). In the approximation of the MA with the Voronoi vertices, it is known that the higher the number of input points, the better the approximation (Amenta et al. 1998, 2001; Siddiqi et al. 2002). In connection with these concerns, consequently, Gass et al. (1998) and Chin et al. (1999) suggest that MA constructed by using Voronoi diagrams can also be used to find MIC. Parallel to this suggestion, it is observed that in various studies (Petrík et al. 2009; Tsygankov et al. 2014; Shen et al. 2015; Sun 2016; Alonso et al. 2018), the Voronoi diagrams are used for the calculation of MIC.
In line with these studies, in MICGIS algorithm (Fig. 1) developed in this study, Voronoi diagrams are effectively used (see also Fig. 7 in Appendix for an extended version of the algorithm). Thanks to the employment of Voronoi diagrams and FOSS for GIS, MICGIS also works successfully for polygons with holes. If it is assumed that MIC should be tangent to at least three edges of a polygon (though under certain conditions it can be tangent to only two edges), it follows that analytical and geometrical properties of these edges and vertices of the Voronoi diagram inside the polygon in conjunction with their spatial configuration can also be effectively used for the calculation of MIC. This is particularly important and practical when it is considered that an infinite set of input points are needed for an exact approximation of MA. Thus, in the algorithm formulated in this study, the basic motivation is to provide a practical and sound solution to MIC by developing a new framework. It is a practical solution in the sense that MICGIS algorithm does not draw on a huge set of input points that is not very practical to deal with. It is also a sound solution as it is further elaborated in the third section by comparing the performance of the algorithm with the alternative solutions to the problem.
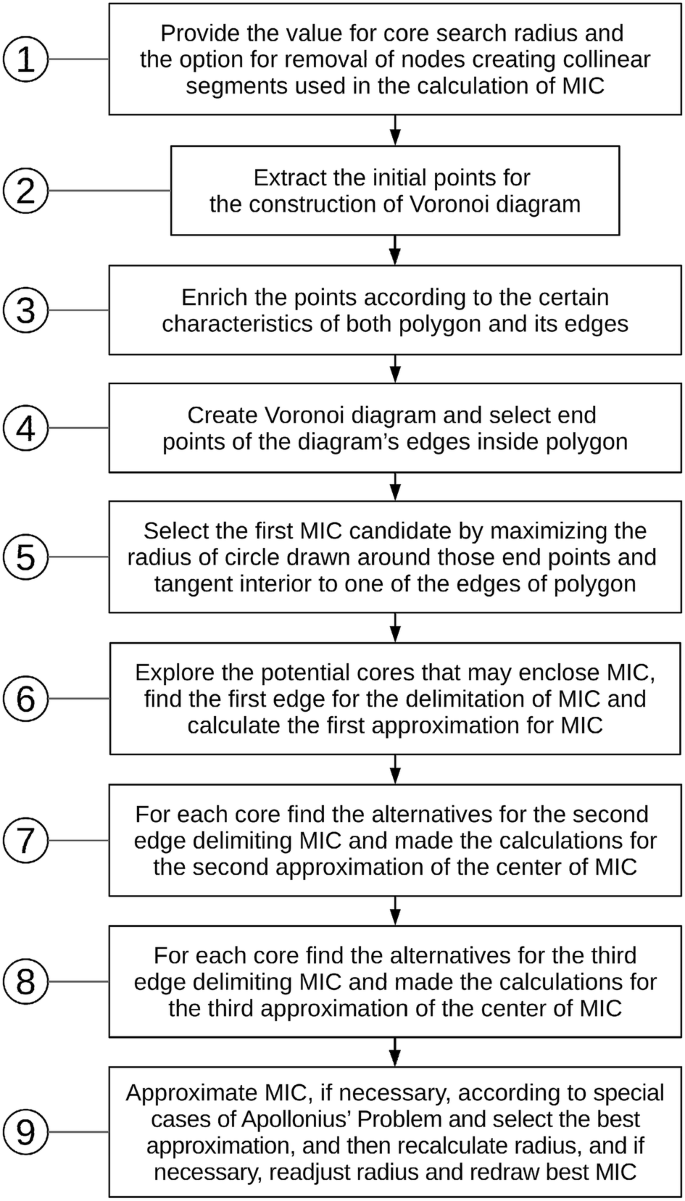
A simplified conceptual flowchart of MICGIS algorithm developed in the study
Within this context, the algorithm developed for this study is composed of a number of sub-components; (1) extraction of the points that are located along the approximate MA and candidates for being center of MIC by using Voronoi diagrams; (2) calculation of the first candidate point that can be used as the center of MIC; (3) detection of the centers of the cores that may be used for the approximation of the center of MIC; (4) processing each core in order to approximate MIC of polygon by using analytical geometrical properties and under the light of the solutions proposed for the special cases of Apollonius’ Problem; and (5) selection of the best circle calculated by using all possible cores and stages of analytical geometrical properties in order to approximate MIC. Each of these sub-components is elaborated in the subsequent parts of this section.
2.1 Extraction of the points having potential for being the center of MIC
For the extraction of the points that are candidates for being the center of MIC, first polygon’s approximate MA is constructed. For the approximation of the MA, Voronoi diagrams are created for the set of points located along polygon subject to the calculation. For this purpose, in the algorithm first, polygon vertices are extracted and stored in an array list (points) by creating a mid-point (ME) between starting point (SP) and finishing point (FP) of each edge (Step 2 in Fig. 1 and Part 2 in Fig. 7). Furthermore, if it is necessary, long edges are densified (Step 3 in Fig. 1 and Part 3 in Fig. 7). Addition of MEs and, if necessary, extra points to points stems from the fact that, as explained above, a better approximation of MA can be achieved with the increase in the number of input points (Amenta et al. 1998, 2001; Siddiqi et al. 2002). This is also a typical process in the studies using Voronoi diagrams in the calculation of MIC (see, e.g., Sun (2016) remarking this as a necessary process in order to generate near continuous results in a polygon having long edges).
Although the sample points can be enriched by considering the length of polygon’s edges, in practice, the vector data available for a polygon may already have more than one segment for an edge, albeit they may not have a balanced distribution along the polygon’s edges. Thus, in MICGIS algorithm, if necessary, there is an option for the removal of the points creating collinear segments along polygon edges. Within this context, placement of extra points between the couple of points forming an edge is based on a simple criterion defined in relation to the average length (AL) of edges in a polygon. Accordingly, if the length of an edge is above AL, for this edge mid points are added to points. For this purpose, the ratio of the length of the edge concerned to AL is rounded to the closest integer number (bolen), and the length of the edge is divided by bolen in order to obtain length of interval that will be used in the addition of extra points along the respective edge. The basic idea for the use of AL is the fact that instead of placing arbitrary points between the end points of edges, it is considered that it would be wiser to divide only relatively long polygon edges for the creation of Voronoi diagrams that can provide us with better approximations for MA and, subsequently, MIC. This idea owes to the fact that when the number of input points is increased, the speed of the calculation decreases. That’s why it is important to keep the number of input points at an optimum level without increasing the burden of calculation on microprocessor in terms of the time required for calculation.
Another option for the enrichment of the number of points can be the use of a standard length between subsequent points based on the shortest edge or a fixed length. Since, in the case of the shortest edge, an arbitrarily and closely located two points forming an edge may unnecessarily slow down the calculation process of MIC, and it is also very difficult to define a fixed length between subsequent points owing to the variety of the fields in which the plugin produced on the base of MICGIS algorithm can be used; it would be more practical to break long segments and to enrich input points on the base of AL in a polygon. Accordingly, after the creation of points, for the construction of Voronoi edges, existing software libraries in Java Topology Suite (JTS) of OpenJUMP are used (Step 4 in Fig. 1 and Part 4 in Fig. 7). For this purpose, more particularly VoronoiDiagramBuilder developed by Davis (2012) for OpenJUMP is used. As each point located along the approximate MA of a polygon can actually be considered as a candidate for the center of MIC, in the algorithm the points (points1) that are both located along the Voronoi edges and covered by polygon are considered as candidates for the center of MIC. If at least one of the ending points of a Voronoi edge is located inside the polygon, the mid-point of the edge concerned is also added to points1 provided that it is within the polygon boundaries. If the centroid of polygon is within polygon, it is also added into points1. If there are less than four points in points1 or the ratio of polygon’s area to the area of its convex hull is less than a predefined value, a series of interior points of polygon is calculated and added into points1 in order to create an adequate number of candidate points that will be used in the calculation of MIC.
2.2 Finding the first candidate point that can be taken as the center of MIC
Finding the first candidate point that can be taken as the center of MIC is actually a max–min problem of maximizing the minimum distance from an unknown point located along the polygon’s MA to all the edges of polygon (Shen et al. 2015; Sun 2016). Thus, in the subsequent part of the algorithm (Step 5 in Fig. 1, and Part 5 in Fig. 7), firstly, the minimum distance (R) between each point in points1 and the edges of the polygon is calculated and stored in another array (mindist1). Parallel to this calculation, the index number for the edges closest to the points in points1 is also stored in another array (segment1) for further calculations that will be required to find the center of MIC. Consequently, the index number for the point having the maximum value in mindist1 is revealed by iterating over mindist1 in order to approximate the center (n1) of MIC (Fig. 2). In this process, the objective function used to find n1 maximizes the radius (R) of circle tangent interior to one of the edges of polygon (Eq. 1):

Sample polygon and first candidate for MIC (n1) based on the points located along the medial axis
Parallel to this, the index information for the edge (a) closest to the point represented by n1 is also calculated. At this stage, the point represented by n1 is actually a good candidate for the center of MIC. In the case of a perfect approximation of MA, if the distance between a Voronoi vertex and an edge of polygon is smaller than the already found maximum radius, the algorithm can move to the next edge in order to speed up the process. In such an algorithm, if the minimum distance is larger than the already found maximum radius, maximum radius is updated with the new radius. Shen et al. (2015) employ such an algorithm in their study. However, in this study it is assumed that a perfect approximation of MA is not possible. Thus, for a better approximation of MIC, it will be useful to draw on the analytical and geometrical properties of the polygon, its edges and also vertices of the Voronoi diagram inside the polygon in conjunction with their spatial configuration. In this respect, one of the crucial concepts in relation to the geometrical properties of the polygon is the concept of core that will be elaborated in the next subsection.
2.3 Finding the potential cores that may cover the center of MIC
For particularly concave polygons, more precisely in lobulated polygons, there may be more than one core that should be used in the approximation of the center of MIC (Fig. 3). Hence, in the algorithm all remarkable cores lying along the MA should be considered in the calculation of MIC (Step 6 in Fig. 1).

An illustrative example for multiple core problem (a lobulated polygon having three remarkable cores)
As it can be followed from the algorithm (Part 6 in Fig. 7), for this purpose, first the closest point (n2) in points1 (empty points in Fig. 2 along MA) to n1 is found among the points having a distance to edge a (the closest edge to n1) more than the radius (mr) of first MIC candidate. The objective function for the respective point can be given in Eq. (2) as follows:
where \({\mathop d\nolimits_{{\mathop {i,n}\nolimits_{1} }} }\) stands for the distance between the point concerned in points1 and n1, and di,a stands for the distance between the respective point and the closest edge to n1.
Subsequently, all the points in points1 are checked against whether the distance (\(R_{od_{i}}\)) between them and the edge closest to them is more than the multiplication of the distance (\(R_{n_{2}}\)) between n2 and the edge closest to it with the square root of csr (core search radius). The only external parameter defined by the user in the delimitation of MIC in MICGIS is related to this parameter. The default value for this parameter is set to 0.75. Although higher values for this parameter increase the speed of the script, the overall accuracy of the results for MICs decreases. Those set of points fulfilling the condition defined above are stored in an array (canodak) and considered to have the potential to represent the centers of the cores. The points in canodak are further processed in order to find the centers of the cores. For this purpose, the points (od) in canodak are iterated, and the points that are not included within the circle drawn around n1 with a radius defined according to the multiplication of mr with csr, and subsequently other core candidates are found. These points are stored in a new array (cod) representing centers of possible cores (see Eq. 3):
where s stands for the total number of cores.
2.4 Processing candidate points in order to approximate best MIC
In addition to the employment of Voronoi diagrams and subsequently polygon’s MA, for each core, analytical geometrical properties of the polygon’s edges and the vertices of Voronoi diagram are also used in conjunction with their spatial configuration for the approximation of the best center for MIC that must be tangent to at least three edges of polygon. Because it is known that on a 2D plane three non-collinear points define a circle (though under certain conditions it can be tangent to only two edges). Thus, if the circle drawn around n1 is tangent to only one of the edges of the polygon, it means that it is not the maximum inscribed circle (Fig. 2).
2.4.1 Second approximation for the center of MIC
This is actually a natural outcome of the fact that, for a perfect approximation of MA, we need a sampling density going to infinity. However, in practice, this is not possible. Thus, further considerations are required in order to find the actual MIC that should be tangent to at least another edge of polygon concerned (Fig. 4).

Sample polygon and second candidate for MIC based on the intersection of line b and the angle bisector of the angle formed by the extensions of lines a and c
Assume that in Fig. 4, n1 is the point identified as the center for the first MIC candidate of the core concerned and a is the closest edge of the polygon to n1. If n2 is the closest point to n1 compared with the other points located along the MA and c (Type 1 for the 2nd edge) is the closest edge of the polygon to n2, a better candidate for the center of MIC should lie between n1 and n2, and the circle drawn around it (with a radius d1) should be tangent to both a and c (Fig. 4). The condition for being tangent to both a and c reveals that the respective point (x1, y1) lies at the intersection of b and the angle bisector of the angle formed by the extensions of lines a and c. By using the formula for a line, the intersection point (x1, y1) can be easily calculated.
As it is seen, n2 provides us with the possible direction to the polygon’s edges located roughly at the opposite side of the edge (a) tangent to the first MIC candidate drawn around n1. This is critical for the proper delimitation of the biggest circle that can be placed in the polygon. Thus, several alternatives are considered in the algorithm for the identification of n2 that will be used for the selection of the 2nd edge for the delimitation of MIC (Step 7 in Fig. 1 and Part 7 in Fig. 7). Accordingly, a point located along the line perpendicular to line a and passing through n1 is positioned at the reverse side of line a and at a certain distance from n1. The distance between this point and n1 is defined by dividing mr (radius of first MIC candidate) by π. Subsequently, the closest edge to the point concerned is designated as the 2nd edge (Type 2).
Another option for the selection of the 2nd edge for the delimitation of MIC is the designation of the second closest edge to n1 as the 2nd edge (Type 3). Alternatively, in addition to the closest point to n1 in points1, among the MA points located within the first MIC candidate the furthest point in points1 from edge a with a distance of at least mr can also be declared as n2. Then the closest edge to this n2 is designated as the 2nd edge (Type 4). After identification of those edges framing MIC at roughly reverse direction of edge a, if they correspond to different edges, for all possible cases of the 2nd edge, the intersection point of a and c (xi, yi) is calculated by constructing the required equation. After calculating the slope of the line going through the angle bisector of the angle formed by the extensions of lines a and c, the intersection point [(x1, y1) in Fig. 4] of the respective line and line b is calculated for the second approximation of the center of MIC. At this stage, an adjustment is made in the algorithm in relation to the designation of the 2nd edge. If the line perpendicular to the 2nd edge does not pass through the second approximation of the center of MIC (xl, yl), the edge crossed by the respective line and contiguous to the 2nd edge is also considered as an alternative for the 2nd edge (Type 5).
2.4.2 Third approximation for the center of MIC
If the circle drawn around (x1, y1) is tangent to only two edges of the polygon, it may not be tangent to a 3rd edge of polygon and it may actually overflow the boundaries of the polygons (a typical example given in Fig. 4). Thus, for a proper delimitation of MIC, if possible, there is a need for the 3rd edge (Fig. 5). The 3rd edge for the third approximation of MIC can be selected on the base of a number of considerations (Step 8 in Fig. 1 and Part 8 in Fig. 7). In this respect, firstly, the spatial configuration of n1, the first (a) and second (c) edges are used for the identification of the 3rd edge. For this purpose, two points located along the angle bisector of the angle formed by the extensions of lines a and c are positioned at a distance from (x1, y1). The distance between these points and (x1, y1) is defined by dividing mr by π. The point further from the circle beam connecting edge a and edge c is selected and, afterward, the closest edge to the point concerned is designated as the 3rd edge (Type 1 for the 3rd edge). Nevertheless, if the angle between the 1st and 2nd edges is above a certain limit implying that both points can be used in the designation of the 3rd edge, both of them are used for the selection of alternatives for the 3rd edge (Type 2).

Sample polygon and third candidate for MIC based on the intersection of the angle bisector of the angle formed by the extensions of lines a and c with the angle bisector of the angle formed by the extensions of lines d and c
Another option for the selection of the 3rd edge for the delimitation of MIC is the designation of the third closest edge to n1 as the third (Type 3). Alternatively, the 3rd edge is also designated by finding the third closest edge to (x1, y1) that is defined on the base of the first two edges (Type 4). After identification of all possible alternatives of 3rd edge, if they correspond to different edges, it is assumed that they can be used for the delimitation of the MIC. In this respect, assume that in Fig. 5, a, c and d is the first three closest edges of the polygon to the point (x1, y1). A better candidate (x2, y2) for the center of MIC should lie at the intersection of the angle bisector of the angle formed by the extensions of lines a and c, and the angle bisector of the angle formed by the extensions of lines d and c. For those polygons where the third approximation for the MIC overflow the polygon boundaries, the edge closest to (x2, y2) and different from 1st, 2nd and 3rd edges is also designated as the 3rd edge in order to better approximate MIC (Type 5). As it is unveiled in the next section, this improves the approximation of better MICs.
2.4.3 Approximation of the center of MIC according to special cases of Apollonius’ Problem and other adjustments
For concave polygons, given the fact that MIC may not be tangent to a, c or d because of the polygons’ geometric properties, some further consideration is actually required in the algorithm. Indeed, sometimes MIC may not be tangent to edges but touches their ending nodes. As Shen et al. (2015) remark, this can also be observed for the other maximal disks located along the MA. In these particular cases, either the node itself or the line passing through the respective node and tangent to MIC should be considered in the calculations made for the approximation of the possible centers of MIC (Step 9 in Fig. 1 and Part 9 in Fig. 7).
Similar kinds of problems are addressed in the literature as the special cases of Apollonius’ Problem, named after Apollonius of Perga, 3rd century BC. The original problem formulated by Apollonius is to construct a circle tangent to three given circles. The special cases of Apollonius’ Problem can be stated as following; to draw a circle passing through or touching three given entities that may be a point or a straight line (Court 1961). As Court (1961, p. 445) remarks, François Viète (1540–1603) was the first mathematician to consider ‘a number of special cases in which some or all of the given circles are replaced by points or straight lines.’ Actually, if these three entities are exactly known beforehand, the best MIC can easily be drawn by using the solutions proposed for the special cases of Apollonius’ Problem. Nevertheless, neither the main characteristics of the entities nor the second and third entities are known beforehand for the problem specifically addressed in this paper. Second entity is calculated on the base of the proposals for the first entity, and third entity is calculated on the base of the proposals for the first and second entities.
Thus, in the algorithm, the 1st edge has a critical importance as an entity. Owing to this, some further adjustments are made in the algorithm in order to better approximate MIC. Accordingly, two other edges are iteratively designated as the 1st edge. The first one is chosen among from the first 2nd edge candidate or the second closest edges to n1 according to their distance to n1. If the distance between the second closest edges to n1 and n1 is less than the distance between the first 2nd edge candidate and n1, in the second iteration of the 1st edge, it is designated as the 1st edge. Otherwise, in the second iteration, the first 2nd edge candidate is designated as the 1st edge. In the third iteration of the 1st edge, the third closest edges to n1 is designated as the 1st edge. In order to fasten the process, at the beginning of calculation of the minimum distance between each point in points1 and the edges of the polygon, two other arrays (mindist2 and mindist3) are created to store distance information for the second and third closest edges to n1. Parallel to this calculation, the index number for the edges concerned is also stored in two other arrays (segment2 and segment3).
In addition to these, for each core another inner loop is created in the calculations of MIC. This loop iterates over the possible configurations of the 1st and 2nd edges in relation to whether MIC is tangent to these edges or touching their ending nodes. Accordingly, it is first assumed that MIC is tangent to the 1st and 2nd edges without any exception. However, if the distance between n1 and one of the ending nodes of these edges is equal to the distance between n1 and the edges concerned, these edges are marked with a possibility of being touched by the MIC at one of their ending nodes. Although the distance between n1 and one of the ending nodes of these edges is not equal to the distance between n1 and the edge concerned, if the line passing through n2 and perpendicular to the 1st edge is not crossing the 1st edge or the line passing through n1 and perpendicular to the 2nd edge is not crossing the 2nd edge, the edges concerned are again marked with a possibility of being touched by the MIC at one of its ending nodes. Within this context, if necessary, the inner loop iterates over all these possible combinations. Further, if the distance between the second approximation for the center of MIC (xl, yl) and one of the ending nodes of the 3rd edge is equal to the distance between this center and the 3rd edge, it is assumed that MIC may not be tangent to the 3rd edge, but passing through the ending node concerned. In this context, if the third entity found is again a point, it is marked as such.
Accordingly, all MIC alternatives are delimited by making use of these combinations and the solutions proposed for the special cases of Apollonius’ Problem according to the spatial qualities and configuration of the first, second and third entities. As it is discussed in the next section, overall, the results of implementation of the proposed algorithm have revealed that MICs found by using the solutions proposed for the special cases of Apollonius’ Problem are quite satisfactory for all of the entity configurations. The only exceptions are related to the cases of entity configurations in which a MIC is either enclosed by two parallel edges without a need for a 3rd edge or delimited by the ending nodes of edges. Since the first MIC approximation obtained from the Voronoi diagram automatically produces the best center for the entity configurations in which all entities are points, the result of the first stage of the algorithm gives the best result for the polygons imprinted with this characteristic. However, for the entity configurations in which there are two lines and one point, or there are two points and one line, the solutions proposed in the algorithm in relation to the special cases of Apollonius’ Problem work as expected.
2.5 Selection of best MIC on the base of potential cores and the geometrical properties of spatial configuration of edges of the polygon and vertices of Voronoi diagram
In both the second and third approximation for the center of MIC, the resulting MIC should be checked against whether or not it is fully covered by the polygon and it is the biggest one compared with the first one already calculated. This comparison should also be done for the set of cores subject to the analysis. The script produced for the calculation of MIC based on MICGIS algorithm takes all these considerations into account together with the assumptions and special cases of Apollonius’ Problem solution of which may provide us with better MICs that may not be tangent to edges of polygon but touches their ending nodes.
For the selection of the best MIC, built-in-functions (particularly spatial predicates such as ‘within’) available in JTS have been actively used. If all the MIC candidates are within polygon, the one having the largest radius is designated as MIC. Those candidates not covered by polygon are omitted from the comparison operation. Another important aspect of MICGIS is the auto re-adjustments required in the extraction of MIC. The decimal precision used by the software in the calculations made in the operating system may result in some MICs whose reconstruction from the given radius around the center calculated by the script within the given limits of precision may very slightly overflow the polygon boundaries at the margin. Original MICs produced by the algorithm may actually be entirely within polygons. However, irrespective of this, the resulting MICs are reconstructed and checked again, against whether or not they are inside the polygon.
In this respect, it is important to remark that in addition to the figures used in the paper, two sets of data are used in this study in order to test the performance of algorithm. One of them covers regular polygons (such as triangles, squares, rectangles, pentagons, hexagons, circles, and ellipses with different orientations and scales) and the other one includes mainly concave irregular and complex polygons that amount to 491. Some statistics regarding the selection of the best MIC on the base of potential cores and the geometrical properties of the spatial configuration of edges of the polygon and vertices of Voronoi diagram for those datasets are given in Table 1.
2.5.1 Consideration of cores and stages of MIC approximation procedure
It is interesting to notice that although in regular polygons all MICs are found in the first core (Type 1 for FC), in irregular and complex polygons, for only a total of 17 polygons (total of Types 2, 3, 4, 6 and 7), MIC concerned is not found in the first core, which actually reveals the importance of the proper construction of the MA. In other words, for 96.54% of complex polygons, MIC is found in the first core. If the MA is well constructed, there will be little room for the calculations made for the other cores. Nevertheless, the possibility of finding better MICs in other cores deserves attention and confirms the relevance of the concept of core in the proper delimitation of MIC. In this respect, it is remarkable that within the given limits of csr, majority of the complex polygons is found to have more than one core. The highest ratio belongs to the complex polygons having two cores (Type 2) with 24.64% of polygons. This ratio decreases for complex polygons with the increasing number of the cores in polygons. It is noticeable that core concept is also relevant for some regular and convex polygons. Within the given limits of csr, it is possible for MICGIS to find more than one core for eight regular and convex polygons (total of Types 2, 3, 4 and 5).
In contrast to the low number of observations for MICs found in other than the first core, employment of MIC approximation procedure developed on the base of analytical and geometrical properties of the polygon and the Voronoi diagram vertices inside the polygon reveals that for 75.00% of the regular polygons and 98.37% of the complex polygons, all stages (Type 3) of the approximation procedure are required in order to approximate the best MIC. For complex polygons in only 1.22% of polygons MIC is actually found in the first stage of approximation (Type 1). Although this ratio increases to 10.71% for the regular polygons, for the majority of regular polygons there is a need for either the second or the third approximation in order to find best MIC. Further, in the case of complex polygons, in those polygons whose MICs are delimited in the first stage, it is remarkable that MICs concerned are not tangent to the edges of the polygon, but passing through one of the ending nodes of at least three edges of the polygon. In a similar fashion, it is observed that for both complex and regular polygons, MICs found in the second stage are delimited by two parallel edges without a need for a 3rd edge.
2.5.2 Consideration of special cases of Apollonius’ Problem and alternatives for 1st, 2nd and 3rd edges
The consideration devoted to the possible cases of Apollonius Problem also exposes that it greatly improves the approximation of better MICs for complex polygons. For different combinations of the edges as entities delimiting MIC, there are samples illustrating the fact that the solutions proposed in the algorithm in relation to the special cases of Apollonius’ Problem work as expected. Accordingly, the number of cases (Type 1) in which MIC is tangent to three edges of the polygon overwhelms the number of other cases (70.06% of the complex polygons). Type 2 (001) and Type 3 (010) rank after Type 1 (000) with a share of 15.07% and 6.52% of the polygons, respectively. Although the sequential spatial configuration of the edges as entities results in the types listed in Table 1, overall there are four unique combinations of the entities if the sequence of the edges is not taken into account. Accordingly, in a configuration there may be (1) three edges (000), (2) three points (111), (3) two edges and one point (001, 010, or 100), or (4) two points and one edge (011, 101, or 110). The number of cases in these categories decreases with the increasing number of point entities. If all entities are points, the first MIC approximation achieved by the Voronoi diagram inevitably produces the best center for the respective entity configuration and leaves no room for further calculations. This can also be observed for the dataset used in this study. In this respect, it is remarkable that those polygons whose MICs are found in the first stage are all imprinted with this characteristic.
Since the approximation of the center of MIC is done on the base of different alternatives for the 1st, 2nd and 3rd edges, the incidences of MICs for each of these alternatives are also counted and recorded in Table 1 together with the fact that these alternatives may correspond to the same edge or, if applicable, the same point along points1. What is evident from these counts is that, as expected, designation of the first closest edge to the center of the core concerned as the 1st edge (Type 1) results in the approximation of the best MIC for 53.16% of complex polygons and 60.71% of regular polygons. This ratio decreases with the decreasing closeness rank of the edge to the center of the core. Among the alternatives for the 2nd edge, the most successful one corresponds to Type 8 with a share of 38.09% of the complex and 53.57% of the regular polygons. As explained in the note part of Table 1, Type 8 stands for the fact that the 2nd edges found in Type 2 and Type 3 are the same. The second and third most successful alternatives for the 2nd edge correspond to different types for the complex and regular polygons. While for the complex polygons the second most successful alternative is Type 3 (designation of the 2nd closest edge to n1 as the 2nd edge), for the regular polygons it is Type 2 described in the previous section. Conversely, while for the complex polygons the third most successful alternative is Type 2, for the regular polygons it is Type 3.
Designation of the closest edge to the closest point to n1 in points1 as the 2nd edge (Type 1) ranks after these alternatives for both complex and regular polygons. It is followed by Type 4 described in the previous section. For the 2nd edge, there are no cases of Types 5, 6 and 7 for regular polygons. The frequency of these types for the 2nd edge is also very low for complex polygons. In this respect, it is important to remark that although Type 5 stands for a different alternative, Types 6 and 7 actually refer to the overlaps either between MA points used in Type 1 (the closest point to n1 in points1) and Type 4 (among the MA points located within the first MIC candidate, the furthest point in points1 from edge a with a distance of at least mr) or between the 3rd edges found on the base of these points, if they are different points.
For both complex and regular polygons, the most successful alternative for the 3rd edge is Type 6 with a share of 39.31% and 35.71% of the polygons, respectively. As explained before, Type 6 stands for the overlap between Type 1 described in the previous section and Type 3 (the designation of the third closest edge to n1 as the third). It is followed by Type 1 and Type 7 with a share of 32.99% and 10.59% for complex polygons and with a share of 28.57% and 17.86% for regular polygons, respectively. As explained before, Type 7 stands for the overlap between Type 3 and Type 4 (the third closest edge to (x1, y1) defined on the base of the first two edges). Although the share of other alternatives is smaller than 10% of the polygons, it is remarkable that they proved to be useful in the delimitation of MIC. For the 3rd edge, there are no cases of Types 2, 3 and 8 for regular polygons. The frequency of these types for the 3rd edge is also very low for complex polygons. In this respect, it is important to emphasize that Types 2 and 8 are very exceptional cases, and the 3rd edge found in Type 3 may actually be the same with the one found in Type 1 or Type 4 (Types 6 and 7 stand for these overlaps).
Overall, employment of all these alternatives for the designation of the 1st, 2nd and 3rd edges in the delimitation of the MIC reveals that they are fulfilling what is expected from them, which justify their existence and usefulness in the algorithm. Thus, employment of the routines for the search of these alternatives together with the routines created for the search of alternative cores, the stages of the delimitation of MIC and the treatment of the special cases of Apollonius’ Problem remarkably improves the approximation of better MICs for both regular and complex polygons.
3 Results of the running the script created to implement MICGIS in comparison with the alternative software programs
As remarked above, the script created for the implementation of the algorithm has been run in OpenJUMP (2019) for a set of a regular (a) and irregular and complex (b) polygons. Some of the results obtained after running the plugin can be seen in Fig. 6. As the actual spatial database used for irregular and complex shapes cover 491 polygons (mostly concave), only a limited set of them is given in Fig. 6. Nevertheless, in Table 2 created for the comparison of performance of the script produced for MICGIS algorithm with some other software scripts having capability to calculate MIC by using vector data, the statistics are based on the whole set of irregular and complex polygons.

Various runs of MICGIS script for a set of regular (a), and irregular and complex (b) polygons
MIC function is called with various names in the respective software programs. In LayoutEditor (Thies 2018) originally created in order to edit designs for MEMS (Micro-Electro-Mechanical Systems) and IC (Integrated Circuit) fabrication, it is called as ‘Biggest Inner Circle’ (BIC). In Flowmap (2013) produced for the analysis of spatial relationships, it is called as ‘Largest Inscribed Circle’ (LIC). In SAGA (2018), it can be calculated via ‘Largest Circles in Polygons’ (LCP) tool. In GeoWizard (2018) extension for ArcGIS Desktop, it is called ‘Maximum Inscribed Circle’ (MIC). Finally, in Quantum GIS (QGIS) the center and radius of MICs can be calculated by using ‘Pole of inaccessibility’ (POI) tool. The hardware configuration and operating system of the computer used for performance test is as following; a quad-core processor with 2.66 GHz frequency and 16 GB of RAM on 64-bit Windows 10 operating system.
It is important to remark that in some software tools there is an option to draw MICs and in some others there is only an option to obtain the center and radius of the MICs concerned. In some of the software programs, both options are available. This is also the case for MICGIS. In connection with this, it is also important to note that in some of the software programs providing both options, if MICs are reproduced by using the coordinates and radius provided for the MICs extracted by them, it is observed that some of those MICs slightly overflow the boundaries of the polygon as opposed to the original MICs drawn by the respective software program. Since this is an important issue in the comparison process, if possible and there is an option, physical comparison of the MICs calculated by these software programs is made on the base of the MICs drawn by the software programs concerned.
As it is evident from Table 2, MIC script produced for OpenJUMP is more successful in finding MICs compared with the other software programs. All MICs extracted by MICGIS are within the polygons’ boundaries. ‘Pole of inaccessibility’ tool in QGIS and MIC tool available in ET GeoWizards are also successful. For only 3 and 7 polygons, calculated MICs slightly overflow the boundaries of polygons concerned, respectively, in ‘Pole of inaccessibility’ and ET GeoWizard. Overall, for all the MICs calculated by using the respective plugins, more than 99.99% of area of the MICs concerned are contained within the boundaries of the polygons. Nevertheless, in the case of Flowmap, calculated MICs overflow the boundaries of the polygons concerned for more than 370 polygons even though the script was also run in ‘Slow & Accurate’ mode [in Flowmap there are different options for the calculation of MIC; (1) Quick & Dirty, (2) Intermediate (default option), (3) Slow & Accurate, and (4) Super Slow & Perfect (almost)]. In Flowmap, at most for only 33% of the polygons, more than 99.99% of area of the MICs concerned are contained within the boundaries of the polygons, if it is run in Intermediate or Slow & Accurate modes.
Actually, POI tool in QGIS and LCP tool in SAGA also require a tolerance or resolution value to be specified for the precision of the calculation. Since there is no such limitation in MICGIS for the precision of calculation, all the calculations are made in POI by particularly using the highest possible precision (i.e., the lowest possible tolerance value that is equal to 0.000001) allowed by the script. Although for the default tolerance value (equal to 1) POI runs very fast, lower tolerance values make it run very slow in QGIS. In a similar fashion, LCP tool in SAGA runs very slowly for lower resolution values. When it is set to 1 m, it takes more than 10 h to obtain the results. However, for higher resolution values no result is obtained for small polygons. In this respect, compared with the other software programs, BIC utility in LayoutEditor has the best performance in speed. The accuracy of MICs calculated by LayoutEditor is also satisfactory. Nevertheless, it could not properly read and write GIS data formats generally used in GIS software. In order to test the performance of the software concerned, files have been saved in SVG format. Other options (such as DXF) did not work in LayoutEditor. In order to compare the results of BIC utility in LayoutEditor with the results of other software scripts, the results concerned are rescaled to their original coordinates.
For the comparison of performances of MICGIS algorithm developed in this study with both POI tool in QGIS and MIC tool in ET GeoWizard, another table is prepared. With this intention, for each polygon, the radius of the MIC computed by the script created for this study (rmicoj) is compared with the ones calculated by POI tool (rpoi) and ET GeoWizard (rmicet) in order to obtain a comparison parameter (comp). Subsequently, if rmicoj is greater than rpoi or rmicet, value of comp is set to, respectively, (rmicoj−rpoi)*100/rpoi or (rmicoj−rmicet)*100/rmicet. If rmicoj is smaller than rpoi or rmicet, value of comp is set to, respectively, (rpoi−rmicoj)*100/rmicoj or (rmicet−rmicoj)*100/rmicoj. Lastly, the number of polygons is counted according to the intervals defined for the value of comp and shown in Table 3. What is evident from Table 3 is that, for all (100%) of the convex and regular polygons, the MIC calculated by the script created for MICGIS algorithm is larger than the one calculated by MIC tool in ET GeoWizard. In the case of comparison of MICGIS with POI tool in QGIS, it is observed that this ratio decreases to 99.19% and 67.86%, respectively, for complex and regular polygons. Overall, these statistics reveal that MICGIS algorithm is not only faster but also more successful in finding MIC compared with the alternative algorithms and software. In the case of POI in QGIS, it should be remarked that it took 7 min for the tool to complete calculation of MICs for regular polygons, which seems to stem from the fact that it is based on an iterative grid-based algorithm. For one of the regular polygons, MIC calculated by POI also, though very slightly, overflow the boundaries of the polygon concerned. This is also the case for ET GeoWizards’ MIC tool in 5 out of 28 polygons.
4 Concluding remarks
Compared with other software programs, GIS software packages seem to have a higher potential to be used in the calculation of MIC owing to their applicability in a wide range of fields. Furthermore, built-in functions available in many GIS software environments facilitate the calculation of morphological properties of polygons. That’s why in this study MIC tool is developed by building on top of a FOSS for GIS. Among the alternative approaches for the extraction of MIC, MICGIS, the algorithm developed in this study, is designated to be based on the approximation of the medial axis. In this respect, although it is known that the quality of approximation of the MA is positively correlated with the number of input points, as a contribution to the delimitation of MIC, MICGIS illustrates the fact that better approximation of MIC can be made without drastically increasing the input points by using the analytical and geometrical properties of the polygon’s edges and the vertices of Voronoi diagram inside the polygon in conjunction with their general spatial configuration.
Even, in the algorithm an option is created for the removal of the pregiven points creating collinear segments along polygons’ edges because of the fact that the segments formed by these points cannot be treated as edges of polygon. Accordingly, it has been shown that average length of edges can be used in order to densify the input points. Furthermore, particularly for lobulated polygons, another important improvement is introduced on the base of the concept of multiple core. Although the number of polygons benefiting from this improvement is relatively low, the results shows that it works as expected and finds MICs that cannot be delimited by using the single core concept. Systematization of the three edges delimiting MIC, and subsequently, employment of the solutions proposed for the special cases of Apollonius’ Problem are also other important contributions of the study for the extraction of MIC in a polygon. Overall, for both regular and complex polygons, it has been shown that the employment of these properties as formulated in the algorithm improves the approximation of MIC.
In sum, what is evident from the various runs of the script produced on the base of MICGIS algorithm developed in this study for a set of regular and irregular complex polygons is that it is successful in finding MIC compared with the existing scripts and software programs produced for this purpose or having functionality for the calculation of MIC. Particularly, compared with the other scripts and software programs integrated into a GIS environment or having capability to read and write geographic data, the algorithm created for the calculation of MIC in this study is both faster and more accurate. Thanks to the existing libraries in FOSS for GIS, MICGIS algorithm could easily be implemented in OpenJUMP as a plugin by benefiting from the libraries concerned (such as the ones for the creation of Voronoi diagrams and spatial predicates in JTS). Without the availability of the libraries created by FOSS community, it would not be possible for this study to solely focus on the perfection of the algorithm developed to delimit MICs of polygons.
MICGIS algorithm will be available as a plugin in OpenJUMP. Yet, some further adjustments are required for the systematization of the code produced in order to make it more compact and faster. The algorithm can also be further improved by observing the characteristics of more complex polygons having huge number of edges. This is particularly designated as one of the topics that can be addressed by the future studies aiming at finding MIC. Parallel to this, development of morphometric parameters for polygons is another important topic for future research trying to understand the nature of spatial configurations at different scales.
References
Agafonkin V (2016) A new algorithm for finding a visual center of a polygon. Available: https://blog.mapbox.com/a-new-algorithm-for-finding-a-visual-center-of-a-polygon-7c77e6492fbc Accessed 15 Dec 2019
Alonso R, Ojeda J, Hitschfeld N, Hervías C, Campusano LE (2018) Delaunay based algorithm for finding polygonal voids in planar point sets. Astron Comput 22:48–62
Amenta N, Bern M, Eppstein D (1998) The Crust and the beta-skeleton: combinatorial curve reconstruction. Gr Models Image Process 60:125–135
Amenta N, Choi S, Kolluri RK (2001) The power crust, unions of balls, and the medial axis transform. Comput Geom 19(2–3):127–153
Arcelli C, Frucci M (1992) Reversible skeletonization by (5, 7, 11)-erosion. In: Arcelli C, Cordella LP, di Sanniti Baja G (eds) Visual form, analysis and recognition. Springer, Boston, pp 21–28
Aschoff T, Spiecker H (2004) Algorithms for the automatic detection of trees in laser scanner data. In: Thies M, Koch B, Spiecker H, Weinacker H (eds) WG VIII/2 laser–scanners for forest and landscape assessment, 3–6 October 2004 Freiburg, Germany. Albert Ludwigs University, Freiburg, pp 71–75
Attali D, Montanvert A (1997) Computing and simplifying 2D and 3D continuous skeletons. Comput Vis Image Underst 67(3):261–273
Birdal T (2011) Maximum inscribed circle using distance transform. Available: https://www.mathworks.com/matlabcentral/fileexchange/30805-maximum-inscribed-circle-using-distance-transform Accessed 29 Jan 2019
Birdal T (2013) Maximum inscribed circle using voronoi diagram. Available: https://www.mathworks.com/matlabcentral/fileexchange/32543-maximum-inscribed-circle-using-voronoi-diagram Accessed 15 Dec 2019
Blum H (1967) A transformation for extracting new descriptors of shape. In: Walthen-Dunn W (ed) Models for the perception of speech and visual form. MIT Press, Boston, pp 362–380
Boissonnat JD, Wormser C, Yvinec M (2006) Curved voronoi diagrams. In: Boissonnat JD, Teillaud M (eds) Effective computational geometry for curves and surfaces. Springer, Berlin, pp 67–116
Borgefors G (1993) Centres of maximal discs in the 5-7-11 distance transform. In: Proceedings of the Scandinavian conference on image analysis, vol 1, p 105
Brezina T, Graser A, Leth U (2017) Geometric methods for estimating representative sidewalk widths applied to Vienna’s streetscape surfaces database. J Geogr Syst 19(2):157–174
Brune C, Vogt S, Peiper C, Brinker K, Trzewik J (2018) A new universal pore measurement and clustering approach for surgical meshes. bioRxiv: 446450. Available: http://biorxiv.org/content/early/2018/10/17/446450.abstract
Burri O, Guiet R (2016) Max inscribed circles. Available: https://imagej.net/Max_Inscribed_Circles Accessed 30 Jan 2019
Butsch A (2016) Districting problems—new geometrically motivated approaches. Karlsruhe: Doctoral dissertation, Karlsruhe Institut für Technologie
Cavic L, Šileryte R, Beirão JN (2017) 3D-informed convex spaces: the automated generation of convex representation for open public space analysis. In: Heitor et al. (eds) Proceedings of the 11th international space syntax symposium, Instituto Superior Técnico, Departamento de Engenharia Civil, Arquitetura e Georrecursos, Portugal, pp 2433–2447
Cheng T, Li P, Zhu S (2012) An algorithm for jammer localization in wireless sensor networks. In: Barolli L, Enokido T, Xhafa F, Takizawa M (eds) 26th IEEE international conference on advanced information networking and applications, 26–29 Mar 2012 Fukuoka-shi, Japan. IEEE Computer Society Conference Publishing Services (CPS), Tokyo, pp 724–731
Chin F, Snoeyink J, Wang CA (1999) Finding the medial axis of a simple polygon in linear time. Discre Comput Geom 21(3):405–420
Court NA (1961) The problem of Apollonius. Math Teach 54(6):444–452
Davis M (2012) JTS topology suite. Available: http://www.tsusiatsoftware.net/jts/main.html Accessed 30 Jan 2019
Davis LG, Bean DW, Nyers AJ, Brauner DR (2015) GLiMR: a GIS-based method for the geometric morphometric analysis of artifacts. Lithic Technol 40(3):199–217
ESRI (Environmental Systems Research Institute) (2015) ArcMap Version 10.3.1. 380 New York Street, Redlands, 92373-8100, USA
Fanwu M, Chunguang X, Haiming L, Juan H, Dingguo X (2011) A quick algorithm of maximum inscribed circle method for roundness evaluation. In: 2011 international conference on system science, engineering design and manufacturing informatization, Guiyang, The Institute of Electrical and Electronics Engineers, 22–23 Oct 2011, vol 2, pp 348–351
Flowmap (2013) Educational Flowmap Release 7.4.2. Available: http://flowmap.geo.uu.nl/ Accessed 30 Jan 2019
Garcia-Castellanos D, Lombardo U (2007) Poles of inaccessibility: a calculation algorithm for the remotest places on Earth. Scott Geogr J 123(3):227–233
Gass SI, Witzgall C, Harary HH (1998) Fitting circles and spheres to coordinate measuring machine data. Int J Flex Manuf Syst 10(1):5–25
ET GeoWizards (2018) ET GeoWizards Version 12.1. Available: https://www.ian-ko.com/ETGeoWizards.html Accessed 10 Feb 2018
Hadaś E (2015) An overview of methods for tree geometric parameter estimation from ALS data in the context of their application for agricultural trees. Acta Sci Pol Geodesia et Descriptio Terr 14(3–4):5–28
Jones DR (2014) A fully general, exact algorithm for nesting irregular shapes. J Global Optim 59(2):367–404
Karimipour F, Ghandehari M (2013) Voronoi-based medial axis approximation from samples: issues and solutions. In: Gavrilova ML, Tan CJK, Kalantari B (eds) Transactions on computational science XX, vol 8110. Lecture notes in computer science. Springer, Berlin
Kimmel R, Shaked D, Kiryati N, Bruckstein AM (1995) Skeletonization via distance maps and level sets. Comput Vis Image Underst 62(3):382–391
Koch B, Heyder U, Weinacker H (2006) Detection of individual tree crowns in airborne Lidar Data. Photogramm Eng Remote Sens 72(4):357–363
Lam L, Lee SW, Suen CY (1992) Thinning methodologies—a comprehensive survey. IEEE Trans Pattern Anal Mach Intell 14(9):869–885
Lee DT (1982) Medial axis transformation of a planar shape. IEEE Trans Pattern Anal Mach Intell 4:363–369
Li W, Goodchild MF, Church R (2013) An efficient measure of compactness for two-dimensional shapes and its application in regionalization problems. Int J Geogr Inf Sci 27(6):1227–1250
Li YH, Feng QG, Hou ZS (2017) Classification of Diospyros Lotus seeds based on MLP neural network. In: 2nd international conference on software, multimedia and communication engineering (SMCE 2017), DEStech Publications, Pennsylvania, Shanghai, 23–24 Apr 2017, pp 498–503
Liu F, Xu G, Liang L, Zhang Q, Liu D (2016) Minimum circumscribed circle and maximum inscribed circle of roundness deviation evaluation with intersecting chord method. IEEE Trans Instrum Meas 65(12):2787–2796
MacEachren AM (1985) Compactness of geographic shape: comparison and evaluation of measures. Geogr Ann Ser B Hum Geogr 67(1):53–67
Masset L (2002) Cvoronoi version 1.0.00. Computes the best approaching circle of a set of 2D points. Available: https://uk.mathworks.com/matlabcentral/fileexchange/2794-cvoronoi Accessed 30 Jan 2019
OpenJUMP (2019) Version 1.14.1 release rev.6147. Available: http://www.openjump.org/ Accessed 2 Aug 2019
Petrík M, Kováč J, Kaťuch P, Bednarčíková L, Hudák R, Živčák J (2009) Roundness: determining the reference circle for MCCI and MICI system. In: Tyšler M, Maňka J, Witkovský V (eds) Proceedings of the 7th international conference measurement 2009, Smolenice, Slovakia. Komprint, Bratislava, 20–23 May 2009, pp 352–355
Powers MC (1953) A new roundness scale for sedimentary particles. J Sediment Res 23(2):117–119
QGIS (2019) QGIS version 3.8.3-Zanzibar. Available: https://qgis.org/tr/site/ Accessed 15 Aug 2019
Ramamurthy R, Farouki RT (1999) Voronoi diagram and medial axis algorithm for planar domains with curved boundaries-I: theoretical foundations. J Comput Appl Math 102(1):119–141
Reddy JM, Turkiyyah GM (1995) Computation of 3D skeletons using a generalized Delaunay triangulation technique. Comput Aided Des 27(9):677–694
SAGA (2018) SAGA Version 6.3.0. Available: http://www.saga-gis.org/en/index.html Accessed 25 Feb 2018
Saxon J (2020) Reviving legislative avenues for gerrymandering reform with a flexible, automated tool. Political Analysis, pp 1–23
Shen Z, Yu X, Sheng Y, Li J, Luo J (2015) A fast algorithm to estimate the deepest points of lakes for regional lake registration. PLoS ONE 10(12):e0144700. https://doi.org/10.1371/journal.pone.0144700
Siddiqi K, Bouix S, Tannenbaum A, Zucker SW (2002) Hamilton-jacobi skeletons. Int J Comput Vision 48(3):215–231
Sun S (2016) Symbolize map distortion with inscribed circles in polygons. Int J Cartogr 2(2):166–185
Sun Y, Che R (2003) Novel method for solving maximum inscribed circle. Opt Precis Eng 11(2):181–187
Taghanaki SA, Liu Y, Miles B, Hamarneh G (2017) Geometry-based pectoral muscle segmentation from mlo mammogram views. IEEE Trans Biomed Eng 64(11):2662–2671
Talbot H, Vincent LM (1992) Euclidean skeletons and conditional bisectors. In: Visual communications and image processing’ 92, vol 1818, pp 862–876
Tauscher S, Neumann K (2016) A displacement method for maps showing dense sets of points of interest. In: Gartner G, Jobst M, Huang H (eds) Progress in cartography. Lecture notes in geoinformation and cartography. Springer, Cham, pp 3–16. https://doi.org/10.1007/978-3-319-19602-2_1
Thies J (2018) LayoutEditor Free Version. Available: http://www.layouteditor.net/ Accessed 10 Jan 2018
Tsygankov D, Bilancia CG, Vitriol EA, Hahn KM, Peifer M, Elston TC (2014) Cell Geo: a computational platform for the analysis of shape changes in cells with complex geometries. J Cell Biol 204(3):443–460. https://doi.org/10.1083/jcb.201306067
Vogt S, Ritter C, Trzewik J, Brinker K (2017) Measuring, clustering and classifying pores of surgical meshes with an ImageJ plug-in. In: 2nd YRA MedTech symposium, Hochschule Ruhr-West, Germany. DuEPublico online, 8–9 June 2017, pp 5–8. http://dx.doi.org/10.17185/duepublico/43984
Wadell H (1932) Volume, shape and roundness of rock particles. J Geol 40(5):443–451
Wadell H (1933) Sphericity and roundness of rock particles. J Geol 41(3):310–331
Wadell H (1935) Volume, shape, and roundness of quartz particles. J Geol 43(3):250–280
Walz U, Schumacher U (2005) Landscape fragmentation in the Free State of Saxony and the surrounding border areas. In: Hřebíček J, Ráček J (eds) Proceedings of the 19th international conference on informatics for environmental protection networking environmental information, Brno, Czech Republic. Masaryk University, Brno, 7–9 September 2005, pp 754–758
Weinacker H, Koch B, Heyder U, Weinacker R (2004) Development of filtering, segmentation and modelling modules for LIDAR and multispectral data as a fundament of an automatic forest inventory system. In: Thies M, Koch B, Spiecker H, Weinacker H (eds) WG VIII/2 laser-scanners for forest and landscape assessment. Albert Ludwigs University, Freiburg, pp 50–55
Zheng J, Hryciw RD (2015) Traditional soil particle sphericity, roundness and surface roughness by computational geometry. Géotechnique 65(6):494–506
Acknowledgements
Birsen F. Biçgel is thanked for her assistance in preparation of technical drawings of the first benchmark dataset (named Regular_Geopolys.shp) composed of 28 regular geometric shapes. Whereas, the second benchmark dataset (named Complex_Geopolys.shp) is composed of 491 complex polygon features representing a real-world dataset adapted from Güler et al. (2012) [https://doi.org/10.1016/j.jhydrol.2011.11.021]. The authors would like to thank them for sharing this dataset with us. The authors are also grateful to anonymous referees for their useful comments, suggestions and constructive critiques. This manuscript in draft was presented at the 7th International Conference on Cartography & GIS (7 ICC&GIS 2018) held by Bulgarian Cartographic Association in Sozopol, Bulgaria (June 18–23, 2018). The authors would like to acknowledge the participants who made insightful comments and suggestions at the presentation. This work received no specific grant from any funding agency in the public, commercial, or not-for-profit sectors.
Author information
Authors and Affiliations
Corresponding author
Ethics declarations
Conflict of interest
The authors declare that there are no conflicts of interest regarding the publication of this paper.
Additional information
Publisher's Note
Springer Nature remains neutral with regard to jurisdictional claims in published maps and institutional affiliations.
Electronic supplementary material
Below is the link to the electronic supplementary material.
Appendix

Rights and permissions
About this article

Cite this article
Beyhan, B., Güler, C. & Tağa, H. An algorithm for maximum inscribed circle based on Voronoi diagrams and geometrical properties. J Geogr Syst 22, 391–418 (2020). https://doi.org/10.1007/s10109-020-00325-3
Received:
Accepted:
Published:
Issue Date:
DOI: https://doi.org/10.1007/s10109-020-00325-3