
Abstract
Tunneling through weakness zones under deep seawater involves significant risks and may have disastrous consequences. This paper presents a case study of geological investigation and excavation aspects of subsea tunnels in major weakness zones. The subject is the Xiang’an subsea tunnels, the first subsea tunnel project in mainland China. The Xiang’an subsea tunnels passed through four major weakness zones, mainly consisting of highly to completely weathered rock mass. The weakness zones were characterized by a combination of long-distance and short-distance, destructive and nondestructive methods, which supplement and verify information with each other. The weakness zones were treated by full-face curtain grouting, using both cementitious and chemical grouts. The interrelationship between the settlement at tunnel crown and ground surface, as well as the interrelationship between ground settlement and ground cracking, were explored based on instrumentation data recorded during tunneling on land. The pre-warning, warning, and limiting values of tunnel crown settlement during excavation of each heading of subsea sections were established to protect the seabed against cracking. Engineering means and methods were developed to control the ground deformation during excavation.
1 Introduction
Recent decades have seen a growing interest in subsea tunnels worldwide, driven by the advancement of tunneling techniques and demands for rapid cross-strait transportation. After completion of the first subsea tunnel, the Kanmon Railway Tunnel in Japan in 1944 (Hanamura 1990), dozens of subsea tunnels were constructed. Examples of such well-known tunnels include the Seikan Tunnel in Japan (Kitamura 1986), the Channel Tunnel connecting the UK with France (Anderson and Roskrow 2003), and the Eurasia Tunnel connecting Asia with Europe (Bäppler 2016). Compared with mountainous tunnels, the construction of subsea tunnels involves more uncertainties because of the difficulty of deep-water site investigation and is more technically challenging under the impacts of high pore water pressure and seepage gradients (Eisenstein 1994).
Subsea tunnels are either immersed in soils on the seabed or, more often, excavated in bedrock by drilling and blasting or a tunnel boring machine. The bedrock, if of good quality, can create a strong self-supporting and virtually impervious barrier to water infiltration. It is, however, a discontinuous medium that often includes a variety of weakness zones created during long geologic history. Kim et al. (2012) summarized four different types of weakness zone, including (1) depressions due to erosion of bedrock, (2) fault or weakness zones formed by tectonic activity, (3) fractured zones in the contact area between intrusive dyke and rock mass, and (4) flat and weak sedimentary rock mass.
Tunneling through an unexpected, or expected but inadequately treated, weakness zone involves high risks of water ingress and excavation instability, which in turn may cause grave casualties and long construction schedule delays. For example, water ingress occurred at four sections in weakness zones during construction of the Seikan Tunnel in Japan (Tsuji et al. 1996). These accidents caused 34 fatalities and delayed the construction schedule by over a year. Another example is the cave-in occurred within a crushed zone during construction of the Atlanterhav subsea tunnel in Norway during February 2008 (Nilsen 2011). That accident delayed the construction schedule by 5.5 weeks.
The Xiang’an subsea tunnel project is the first subsea tunnel project in mainland China. The tunnels passed through four major weakness zones. Although Chinese engineers have tunneled through over 10,000 km of mountainous tunnels with different subsurface conditions, undersea tunneling was a new task. Applying construction experience accumulated during mountainous tunneling, engineering means and methods were developed for water ingress and excavation stability control during construction of the Xiang’an tunnels. After a brief introduction to the Xiang’an tunnel project in Sect. 2, the remainder of the paper presents a detailed discussion of the engineering means and methods including: pre-excavation site investigation (pre-investigation) in Sect. 3, pre-excavation grouting (pre-grouting) in Sect. 4, and detailed ground deformation control during excavation in Sect. 5. Section 6 presents the conclusions.
2 Project Description
Figure 1 shows the general location of the Xiang’an tunnel project, which connects Xiamen Island with Xiang’an District in Fujian Province of southeastern China. The roadway project includes a twin tunnel with three lanes in each direction. Each tunnel has an approximate alignment length of 6.0 km, of which 4.2 km is buried within the sea channel. Figure 2 shows a cross section of the subsea section, which consists of two main tunnels and one small diameter service tunnel. The main tunnels have an excavation height of 12.55 m, width of 17.04 m, and cross-sectional area of 170 m2. The service tunnel has a diameter of 6.0 m. The net distance between the two main tunnels is 48 m, and the net distance between the main and service tunnels is 21 m. The tunnels were excavated by drilling and blasting, begun in September 2005 and completed in April 2010.

General location of Xiang’an tunnel project

Cross section of subsea tunnels
Figure 3 shows the subsurface profile along the alignment of the north main tunnel. The alignment follows a typical “V” shape vertically, with maximum inclination of 0.3 %. The tunnel crown at the deepest section is about 37 m below the seabed, which was covered by approximately 30 m of seawater. The subsurface strata in the middle of the channel include a few meters of marine deposits underlain by bedrock, which mainly consists of granite with varying degrees of weathering. Figure 3 shows that there are four major weakness zones, labeled F1, F4, F2, and F3, along the alignment. The weakness zones mainly consist of highly to completely weathered rock mass. Among the four zones, F1 has the poorest ground conditions with an approximate width of 136 m. The tunnels directly traversed the core of the F1 zone. The following of the paper focuses on techniques for excavation stability and water ingress control during tunneling through F1.

Subsurface profile along north tunnel alignment
3 Site Investigation
Construction experience from previous subsea tunnels indicates that most water ingress and excavation instability accidents occurred in unexpected, or expected but inadequately treated, weakness zones. Detailed site investigation is a key to reduce construction risk. The main purposes of site investigation are to (1) identify the locations of weakness zones and (2) characterize the properties of weakness zones for the preparation of ground improvement. Site investigation for subsea tunnels is more difficult and costly than mountainous tunnels. Nilsen (2014) reported that the cost of site investigation for Norway subsea tunnels typically constituted 6–10 % of total construction cost, compared with 1–2 % for onshore tunnels.
During the Xiang’an tunnel project, site investigation was performed in multiple phases during design and construction. In particular, significant efforts were made on the site investigation at the tunnel face during excavation. The cost of site investigation during the design phase was about 6 million USD, and that during the construction phase was about 5 million USD. The total cost of site investigation of was about 11 million USD, accounting for 1.6 % of the total construction cost (0.7 billion USD). Although the relative cost of site investigation for the Xiang’an tunnels was much lower than that of the Norway subsea tunnels, it was much higher than that of site investigation (typically 0.2–0.3 % of the total construction cost) for mountainous tunnels in China.
3.1 Site Investigation During Design Phase
During the design phase, three rounds of site investigation were conducted, mainly using seismic refraction tests and core drilling. During the preliminary design phase, 24 seismic tests were carried out to select the tunnel alignments and provide information related to soil and rock cover above the tunnels. Fourteen vertical borings, including 10 water borings and 4 land borings, were then drilled to obtain soil and rock samples for verifying information from seismic tests. The preliminary site investigation reported three major weakness zones, F1, F2, and F3 (Fig. 3), along the selected alignments.
After the preliminary design phase, a site investigation program was specifically designed to investigate the weakness zones along the alignments. An additional 24 seismic tests were conducted at susceptible locations, and 13 vertical borings were drilled. Laboratory and in situ tests were performed to characterize the mechanical and hydraulic properties of the weakness zones. This round of site investigation turned out to be very beneficial. It identified the fourth major weakness zone, F4 (Fig. 3).
In the final design phase, 84 vertical borings were drilled, with an average spacing of 200 m along the alignments. These borings were drilled to fill gaps between borings drilled during the previous two rounds. Borings were also drilled to obtain ground information related to specific structures, such as shafts, tunnel portals and cross-passages, and weakness zones. No further weakness zones were revealed during this round of investigation.
3.2 Site Investigation During Construction
Site investigation during the design phase identified the approximate locations of the weakness zones. For the preparation of ground improvement, more detailed information related to the location, interface, and material properties of the weakness zones was required. For a linear structure such as a tunnel, horizontal site investigation conducted at the excavation face acquires continuous ground information in front of the excavation. This is more cost-effective than vertical investigation performed above water. Significant efforts were made during the pre-investigation at the tunnel face during construction.
The pre-investigation applied a combination of long-distance and short-distance, destructive and nondestructive exploration methods, which supplement and verify information with each other (Pan 2015). The destructive methods include percussion drilling and core drilling. The nondestructive methods include tunnel seismic prediction (TSP), ground penetrating radar (GPR), and infrared thermal (IRT) testing. The long-distance methods, including long-distance drilling (LDD) and TSP, explore the general ground conditions 50–100 m in front of the excavation. The short-distance methods, including short-distance drilling (SDD), GPR, and IRT, obtain detailed ground information 10–25 m ahead of the excavation.
Table 1 lists the major features of each exploration method. The TSP is based on propagation and reflection of seismic waves through the ground in front of an excavation face (Shi et al. 2014). The seismic waves are generated by a number (typically <24) of small blasting shots installed along the tunnel sidewalls closely behind the excavation face, with a specific pattern. Direct waves from the shots and reflected waves from subsurface strata are received by a system of receivers installed in the tunnel and are then analyzed using a classical wave propagation analysis which applies compressional and shear wave velocities to interpret ground conditions (Alimoradi et al. 2008).
The GPR sends high-frequency electromagnetic waves into the ground and records reflected signals in real time (Davis and Annan 1989). The electromagnetic wave propagation depends mainly on the relative electrical permittivity and the electrical conductivity of the medium. If the dielectric properties of the geomaterial change, for example in composition, bulk density or moisture content (Collins 2008), parts of the transmitted radar signals are reflected and recorded. Because water has a much higher dielectric constant than air or soil skeleton, the GPR is particularly useful to identify water-bearing voids or fissures in the ground.
The IRT scanner provides data for comparative, nondestructive analysis of thermal differences between detected objects and the surrounding environment (Friedli et al. 1998). It acquires the thermal radiation pattern of a surface, depending on temperature, material emissivity, atmospheric absorption, and reflection of the radiation on the observed surface, attributable to surrounding bodies. The IRT scanning is mainly used to detect water-bearing crevasses and voids (because water temperature inside the void is substantially different from external conditions), as well as discontinuities or fracturing (because the thermal inertia of a sound rock is greater than that of a highly fractured rock) (Squarzoni et al. 2008).
The geophysical methods provide quick and inexpensive means for obtaining qualitative information related to the composition, density, and water content of the ground. The accuracy and reliability of those methods are strongly dependent on experience in data interpretation. Compared with the geophysical methods, field drilling is more time-consuming and expensive. However, it can obtain core samples for visual inspection and laboratory testing, as well as quantitative information related to groundwater flow. Field drilling is mainly used at susceptible locations of weakness zones identified by the geophysical methods, to further verify and support information from those methods.
Figure 4 shows a schematic drawing for the application of the various exploration methods. Figure 5 presents a flow diagram of the general sequence of the pre-investigation, which has two major sequential steps, namely the long-distance and short-distance explorations. The long-distance exploration began with TSP testing, which was conducted continuously within subsea sections with a round length between 150 and 200 m. After reaching the susceptible weakness zones as indicated by existing site investigation data, the TSP testing round length was shortened to 120 m, with 20 m overlap between two sequential rounds. If the TSP testing confirmed a weakness zone, long-distance borings were drilled starting 30 m ahead of the susceptible weakness zone to verify the TSP test information. Typically, two to four borings, including one core drilling and one to three percussion drillings, were drilled at the tunnel face. In some areas, long-distance borings were also drilled in the service tunnel to define the boundaries of the weakness zones.

Application of site investigation methods

Flow diagram of site investigation sequence
The short-distance exploration started 20 m ahead of the weakness zones as defined by the long-distance exploration. The GPR and IRT tests were conducted first, mainly to determine rock mass fracturing and water-bearing conditions. The SDD was then conducted using a drilling jumbo equipped with extended rods. Blow-out preventers were installed at the tunnel face for drilling in the water-bearing zones indicated by the GPR and IRT testing. Core samples were recovered from selected boreholes. Groundwater flow conditions and core recovery from the SDD were used to determine the parameters for pre-grouting, which is discussed in detail in Sect. 4.
3.3 Characterization of F1 Zone
Figure 6 shows the ground condition of the F1 zone characterized by the pre-investigation. The weakness zone starts at Sta. YK8+324 and ends at Sta. YK8+460, with a total length of 136 m. Materials in the weakness zone varied significantly from soft to medium stiff clay and silt to hard, fractured granite. Based on the composition, the weakness zone was divided into four subzones:

Ground conditions of F1 zone
-
1.
From Sta. YK8+324 to YK8+330: a transition zone, with a transition of slightly to moderately weathered rock mass.
-
2.
From Sta. YK8+330 to YK8+415: a completely weathered zone, consisting of a mixture of clay, silt, and sand. The P-wave velocity of the completely weathered rock mass was between 1330 and 1846 m/s, with an average of 1722 m/s (Pan 2015). The materials gradually transitioned along the alignment from clayey soils to sandy soils. From Sta. YK8+330 to YK8+375, the soil was mainly composed of silt and clay, with little to some sand (Fig. 7). The permeability of the soil was relatively low, in the range of 10−4–10−5 cm/s. From Sta. YK8+375 to YK8+415, the soil was mainly composed of fine to coarse sand with little to some clay and silt (Fig. 8). The permeability of the soil was 10−3–10−4 cm/s.
Fig. 7 
Silty and clayey soil samples from Sta. YK8+330 to YK8+375
Fig. 8 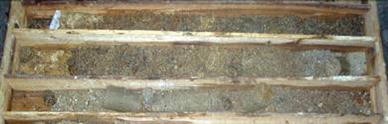
Sandy soil samples from Sta. YK8+375 to YK8+415
-
3.
From Sta. YK8+415 to YK8+450: a highly weathered zone, mainly consisting of highly fractured rock mass with P-wave velocity between 1918 and 2172 m/s and an average of 1997 m/s. The permeability of this zone was high, in the range of 10−2–10−3 cm/s. Figure 9 shows the core recovered from field drilling.
Fig. 9 
Fractured rock samples from Sta. YK8+415 to YK8+450
-
4.
From Sta. YK8+450 to YK8+460: a transition zone, with a transition from moderately to slightly weathered rock mass.


4 Pre-excavation Grouting
The materials in weakness zones are not strong enough to provide a self-support or tight enough to provide a barrier to water infiltration during excavation. To ensure construction safety, ground improvement is required before excavation. Among the varieties of ground improvement methods, pre-grouting is the most widely used one in tunneling.
4.1 Grouting Mechanism
Depending on ground conditions, grouting can be classified into permeation, fracturing, and compaction. If the original permeability of the rock mass is high, such as the fractured rock mass shown in Fig. 9, the main grouting type is permeation, by which the grout permeates into the rock fractures to bind rock fragments together after hardening. The main purpose of permeation grouting is to control groundwater infiltration; the strengthening effect is secondary. For clayey and silty soil, such as the completely weathered rock mass shown in Fig. 7, it has relatively low permeability and the grout is difficult to permeate into the porosity. The main grouting type in this case is fracturing, by which the grout fractures soil under high pressure to form interconnected stiff veins therein. Under high pressure, the density of the soil adjacent to the grout veins increases. The main purpose of fracturing grouting is to strengthen the soil for excavation stability, and the water control effect is secondary. For sandy soils such as the completely weathered rock mass shown in Fig. 8, both permeation and fracturing play a role. Under high pressure, the grout expands in the sands and at the same time compacts them. For relatively dense sands, the main effect is permeation. For relatively loose sand, the compaction effect may be stronger than the permeation effect. For such soils, both strength increase and water control are important.
4.2 Material Selection
Cementitious grouts are the most widely used grout materials and were selected as the principal grouts in the Xiang’an tunnel project because of their low cost, high strength, good penetrability, and environmental friendliness. Depending on the permeability of the rock mass, both ordinary Portland cement (OPC) and micro-fine cement (MFC) were selected. The OPC has a Blaine value of 300 m2/kg, D 50 of 40 μm, and D 90 of 80 μm and is able to penetrate into 0.5-mm-diameter porosity. The MFC has a Blaine value of 850 m2/kg, D 50 of 2 μm, and D 90 of 20 μm and can penetrate into 0.05-mm-diameter porosity. The major drawback of cementitious grouts used in undersea grouting is their long initial setting time. The fluctuation of seawater may wash the grouts away if they do not set quickly. To reduce the setting time, sodium silicate (SS) is mixed into the cementitious grouts to make dual-component grouts. Table 2 lists the laboratory test results of the initial setting time and uniaxial compressive strength (UCS) of the OPC, MFC, OPC–SS, and MFC–SS grouts.
Table 2 shows that the dual-component grouts have much shorter initial setting times (<10 min) compared with the single-component cementitious grouts (4–8 h), depending on the water/cement (W/C) ratio. In general, with the decrease in the W/C ratio, the initial setting time decreases and the UCS increases. With increases in the cement-to-SS (C/S) volume ratio, both the initial setting time and UCS increase. Based on the test results, a W/C weight ratio of 0.6 and C/S ratio of 1 were selected. The dual-component MFC–SS grout was mainly used to treat the completely weathered rock mass from Sta. YK8+330 to YK8+375, where the silt and clay had relatively low permeability. The dual-component OPC–SS grout was largely used to treat the completely weathered rock mass from Sta. YK8+375 to YK8+415, where the sandy soil had relatively high permeability.
From Sta. YK8+415 to 8+460, the weakness zone mainly consists of highly fractured rock mass with high permeability (10−2–10−3 cm/s). To improve the grouting results, a two-stage combination chemical and cement grouting was used. A chemical grout called Marithan was first used to seal water seepage along the excavation boundary. Marithan is a type of plural component polyurethane that has low toxicity, low viscosity, high strength, and a high expansion ratio (Zhang et al. 2014). When it is injected into the ground, it remains liquid for several seconds and penetrates into fractures, where it reacts with water and expands, and seals the fractures. Owing to its relatively high cost, Marithan was used to grout 6-m-thick rock mass along the excavation boundary to form a water-tight ring. The rock mass inside the excavation was then grouted with OPC to strengthen it and further control groundwater.
Figure 10 shows the sequence of the combination grouting. The Marithan and OPC were transported through two different PVC pipes of diameter 20 mm. The lower part of the borehole was first filled with OPC grouts, and the Marithan was pumped into the end of the borehole to grout the zone outside the excavation. The purpose of filling the lower part of the borehole with OPC was to prevent the Marithan permeating back to jam the grouting pipes. The OPC grouts were then pressured into the PVC pipe to grout the zone inside the excavation.

(Modified after Zhang et al. 2014)
Sequence of combination grouting.
4.3 Grouting Parameters
The grouting zone was designed to extend 6 m outside the excavation boundary. The determination of this zone was mainly based on experience. In typical Chinese tunneling practices, the grouting zone is taken as half the tunnel diameter. With improvement of the grouting technique, current practices tend to use smaller grouting zones and longer round length. The maximum grouting round length has reached 50 m in mountainous tunnels in China. For the F1 zone, four rounds of grouting were conducted, with round lengths between 25 and 47 m and overlap lengths of 2–4 m. Table 3 lists the lengths, hole series, number of grout holes, and materials used in each round. Dependent on the round length, three-hole or four-hole grouting series were used. The grout holes were drilled from the upper headings of the tunnel face in rounds 1, 3, and 4, and from both upper and lower headings in round 2. Figures 11 and 12 show the longitudinal and front views of the grout holes in the first round.

Longitudinal profile of first round grout holes (unit: m)

Grout hole arrangement at tunnel face for first round of grouting
Grouting pressure was taken between 2.5 and 3.5 MPa, depending on the ground conditions. For fracturing grouting used in the clayey and silty soils in rounds 1 and 2, the grouting pressure was approximately equal to the effective soil overburden plus 2 MPa. The soil depths were between 30 and 50 m, with vertical effective overburden pressure of approximately 0.75–1.25 MPa. Considering pressure loss from the gauge to pipe end, maximum gauge pressure was capped at 3.5 MPa. For the permeation grouting in the sandy soils and fractured rock mass in rounds 3 and 4, grouting pressure was approximated as the hydrostatic pressure plus 1.5 MPa. The hydrostatic pressure was between 0.4 and 0.65 MPa, and maximum gauge pressure was capped at 2.5 MPa.
4.4 Grouting Results
The grouting results were inspected through drilling inspection holes. A series of 100-mm-diameter inspection boreholes were drilled after each round of grouting. The number of inspection holes was about 10 % the number of grouting holes. The water outflow rate from inspection holes, core recovery, and strength increase in the rock mass after grouting were used as indices to evaluate the grouting results.
The inspection showed that the average flow rate from boreholes was reduced from 1.6 to 41.7 L/min/m before grouting to 0 to 0.2 L/min/m after grouting. Average core recovery was about 76 %. The average undrained shear strength of the clayey and silty soils increased from 33 kPa before grouting to 75 kPa afterward. The effective frictional angle of the sandy soils increased from 32° before grouting to 34° after it, and effective cohesion increased from nearly 0 to 70 kPa. Figures 13 and 14 show rock surface conditions before and after grouting, respectively. These figures show that rock surface conditions were improved significantly. Fractures in the rock mass were well sealed, and the rock surface after grouting was largely dry.

Rock surface before grouting

Rock surface after grouting
5 Stability Control During Excavation
The pre-grouting improved the strength and reduced the permeability of the rock mass in the weakness zones. The risk of water ingress and excavation instability remained because of the limited strength of the rock mass after grouting and uncertainties associated with the ground conditions and grouting. Excavation-induced ground deformation may generate cracks in the ground and sliding movement at the interface between the weakness zone and surrounding competent rock mass.
A common technique for ground deformation control is partial face excavation, in which the tunnel is driven in stages such that the area of each face is sufficiently small to control. Two excavation alternatives, the central cross diaphragm (CRD) and twin sidewall drift (TSD) methods, were proposed in the Xiang’an tunnel project. Figures 15 and 16 show the excavation headings and internal supports of the CRD and TSD methods, respectively. The CRD excavation consists of four sequential headings. The TSD excavation consists of six headings, with side headings I’s and II’s, excavated simultaneously. Steel plates were installed inside the tunnel as internal support after each heading excavation. Steel meshes, shotcrete, and lattice girders were installed at the tunnel excavations for temporary support.

CRD excavation

TSD excavation
A key feature of the New Austrian Tunneling Method (NATM) is the use of instrumentation data of the stress, strain, and deformation of ground and tunnel structures as feedback to guide construction. In subsea tunneling, the major risk is the generation of ground cracks that, if interconnected, will cause seawater inflow to the excavation. Ground deformation and cracking, however, are difficult to observe and monitor because of seawater above the tunnel. Instrumentation is generally installed inside the tunnel to monitor the tunnel deformation and use the tunnel deformation data to direct construction.
A detailed instrumentation program was executed for the tunnel sections on land, with the aims of (1) determining which excavation method (TSD or CRD) could better control the generation of ground cracks and which should be used to excavate the weakness zones, and (2) determining interrelationships between the deformation at the tunnel crown and ground surface, as well as interrelationships between ground settling and cracking, so that a criterion could be established to use monitored tunnel crown movement for controlling seabed deformation and crack generation during subsea tunneling.
5.1 Ground Deformation Instrumentation
Three land sections, A, B, and C, were monitored during tunneling on the Xiamen Island side. Detailed locations and ground conditions of the three sections are shown in Fig. 17. The tunnels were excavated mostly within completely weathered rock mass, similar to the ground conditions in the weakness zones. Because the three sections were located below wasteland without adjacent structures on the surface, there was no ground improvement before excavation. Among the three sections, A and B were excavated using the TSD method and C using the CRD method. Sections A and C were closely next to each other, and instrumentation data were compared to determine which method should be used for tunneling in weakness zones.

Locations of Sections A, B, and C
Figure 18 is a schematic drawing of the instruments. Ground settlement above the tunnel at various depths was measured by extensometers. Horizontal ground movement at various depths was measured by inclinometers. To prevent damage to the instruments during excavation, the extensometers and inclinometers were installed 2–2.5 m off the excavation boundaries. Data were collected and processed electronically.

Arrangement of instruments
Figures 19 and 20 show settlement above the tunnel crown and at the ground surface during different excavation stages in Sections A and C, respectively. Table 4 lists settlement values and relative percentages. Figure 21 shows horizontal ground movement versus depth at the end of excavation for Sections A and C. The data show the following.

Ground surface and tunnel crown settlement in Section A (TSD excavation)

Ground surface and tunnel crown settlement in Section C (CRD excavation)

Lateral ground movement vs. depth at end of excavation
-
Settlement was substantial in both Sections A and C, owing to the poor ground conditions. Total settlement above the tunnel crown was 300 mm in Section A and 314 mm in Section C. Total settlement at the ground surface was 250 mm in Section A and 265 mm in Section C. The settlement at the ground surface constituted 80–85 % of the settlement above the tunnel crown. Such large settlement proves that pre-grouting is required during tunneling through weakness zones.
-
Ground settlement in Section A was slightly less than that in Section C. This indicates that the ground settlement can be better controlled by TSD excavation than CRD excavation, because the former has stronger internal vertical supports than the latter.
-
Horizontal ground movement in Section A was much greater than that in Section C. This indicates that the horizontal ground movement can be better controlled by CRD excavation than TSD excavation, because there is no lateral support inside the tunnel when using the TSD excavation.
-
Ground settlement develops with each excavation stage. In Section A (TSD excavation), settlement induced by the side pilots accounted for roughly 70 % of the total settlement. In Section C (CRD excavation), excavation of the top two headings made up about 65 % of the total settlement. Therefore, it is critical to control ground movement during excavation of the first two headings.
Figure 22 shows the settlement trough at the ground surface. This figure shows that with the progress of tunneling, the ground settlement trough pushed forward with an approximate elliptical shape. With the development of ground settlement, the ground cracks developed because of shear and tensile forces induced in the ground. Figure 23 shows a picture of the ground crack.

Ground settlement trough

Ground crack
Figure 24 shows the interrelationship between maximum ground surface settlement and ground crack width. This figure indicates that the maximum crack width was about 1.2 cm for CRD excavation and 2.5 cm for TSD excavation. Because the CRD excavation can much better control ground cracking than the TSD excavation, it was used to excavate weakness zones. For both types of excavation, ground crack width increased almost linearly with increasing ground settlement. Figures 25 and 26 show the interrelationship between lateral movement at the ground surface and ground crack width for the TSD and CRD methods, respectively. These figures show that the ground crack width increased almost linearly with ground lateral movement.

Relationship between ground surface settlement and ground crack width

Relationship between ground surface horizontal movement and ground crack width for TSD excavation

Relationship between ground surface horizontal movement and ground crack width for CRD excavation
Figures 24, 25, and 26 indicate that in both CRD and TSD excavations, settlement at the ground surface, settlement at the tunnel crown, and ground crack width were all interrelated and developed with each excavation stage. Therefore, tunnel crown settlement was used as an index, which can be easily determined through instrumentation to control seabed deformation and cracking during subsea tunneling.
5.2 Ground Deformation Control Criteria
Figure 24 shows that when ground surface settlement reached about 30–40 mm, ground cracks start to generate. To prevent crack generation, ground surface settlement should be limited to 30–40 mm. Based on the instrumentation data shown in Figs. 19 and 20, when settlement at the tunnel crown was about 40–50 mm, settlement at the ground surface reached 30–40 mm. Because rock mass cover above the tunnel in the weakness zones was generally 10–20 m thicker than the cover on land, and pre-grouting used in the weakness zones increases the rock mass strength and modulus, the limiting value of tunnel crown settlement was relaxed to 70 mm for CRD excavation. That value was validated by three-dimensional (3D) numerical simulations and supported by construction experience from mountainous tunneling. The 3D numerical simulations were performed using FLAC3D version 5.0 software, with consideration of fluid–mechanical interaction (FLAC3D User Manual 2012). Ground deformation and tunnel deformation in the F1 zone during the excavation of each tunnel heading were simulated after rock mass grouting. The detailed simulation methodology and results can be found in Pan (2015).
Table 5 lists pre-warning, warning, and limiting values of tunnel crown settlement during the CRD excavation of each heading. The pre-warning and warning values were taken as 60 and 80 % of the limiting value, respectively. The deformation control criteria in Table 5 were used during tunneling through the weakness zones. Different action levels were implemented when the pre-warning, warning, and limiting values were reached. By using the ground deformation control criteria, the tunnels were excavated through the weakness zones without major water ingress and excavation instability accidents.
5.3 Ground Deformation Control
General rules for controlling ground deformation during Xiang’an subsea tunneling were to (1) limit the exposed area of each heading (particularly the top headings), (2) install timely, adequate temporary supports, (3) conduct high-quality backfill grouting behind the temporary supports, and (4) seal small water leakages on time. The following section presents a short discussion of optimization of the excavation sequence and the installation of temporary supports.
The instrumentation data show that roughly 65 % of the ground settlement occurred during the excavation of the top two headings when using the CRD excavation. To control the settlement, excavation of the two top headings was optimized during tunneling through the weakness zones. Figure 27 shows the optimized excavation sequence. Each of the top headings was divided into two small headings with heights of 3 and 4.6 m, respectively. These two headings were 3 m apart longitudinally, and the other headings were 10 m apart. After the excavation of each small heading, internal and temporary supports were installed. By optimizing the top heading excavation, tunnel settlement was reduced by about 10–20 % (Pan 2015).

Optimized excavation sequence for F1 zone
During excavation of each heading, steel girders were installed 1–2.5 m behind the excavation as temporary supports. During construction, it was found that these girders typically settled 2–3 cm, driven by their own weight. To prevent this settlement, toe anchors were installed to fix the girders. Figure 28 shows the toe anchor installation. The construction experience showed that tunnel settlement was reduced by 15–20 %, and horizontal convergence of the tunnel was reduced by 10–15 % by installing the toe anchors (Pan 2015).

Installation of toe anchors
6 Conclusions
This paper presents a case study of geological investigation and tunnel excavation aspects of the weakness zones of the Xiang’an subsea tunnels. Valuable lessons were learned related to subsea tunneling through weakness zones.
Pre-investigation is key to minimizing ground uncertainties. A combination of long-distance and short-distance, destructive and nondestructive methods, which furnishes supplementary and verification information between themselves, was used to characterize the weakness zones in the Xiang’an tunnel project. The multistage and multi-means ground characterization significantly reduced the ground uncertainties. Pre-grouting is a key measure to reduce the risk of groundwater ingress and excavation instability. Full-face curtain grouting with both cementitious and chemical grouts was used for ground improvement in the project. The combination grouting substantially reduced the permeability and increased the strength of the rock mass. Detailed ground deformation control during excavation is critical to prevent ground cracking and ensure construction safety. A ground deformation criterion based on tunnel crown settlement, which can be easily monitored during tunneling, was established to prevent seabed cracking. Pre-warning, warning, and limiting values of the tunnel crown settlement during excavation of each heading of subsea sections were established. Engineering means and methods were used to control the ground deformation.
The construction of the Xiang’an subsea tunnels was completed in April 2010 without major accidents. The engineering means and methods developed during the Xiang’an subsea tunnels for the water ingress and excavation instability control provided valuable case history experience for the construction of the subsequent subsea tunnels in China.
References
Alimoradi A, Moradzadeh A, Naderi R, Salehi M, Etemadi A (2008) Prediction of geological hazardous zones in front of a tunnel face using TSP-203 and artificial neural networks. Tunn Undergr Space Technol 23(6):711–717
Anderson G, Roskrow B (eds) (2003) The channel tunnel story. CRC Press, New York
Bäppler K (2016) New developments in TBM tunneling for changing grounds. Tunn Undergr Space Technol 57:18–26
Collins M (2008) History of ground-penetrating radar applications in agriculture. CRC Press, New York, pp 45–55
Davis J, Annan A (1989) Ground-penetrating radar for high-resolution mapping of soil and rock stratigraphy. Geophys Prospect 37(5):531–551
Eisenstein Z (1994) Large undersea tunnels and the progress of tunneling technology. Tunn Undergr Space Technol 9(3):283–292
FLAC3D User’s Manual (2012) Itasca Consulting Group Inc., Minneapolis, Minnesota, USA
Friedli B, Tobias S, Fritsch M (1998) Quality assessment of restored soils: combination of classical soil science methods with ground penetrating radar and near infrared aerial photography? Soil Tillage Res 46(1):103–115
Hanamura T (1990) Japan’s new frontier strategy: underground space development. Tunn Undergr Space Technol 5(1):13–21
Kim H, Jeon S, Park E (2012) Evaluation of monitoring items for adverse ground conditions in subsea tunneling. Tunn Undergr Space Technol 32:19–33
Kitamura A (1986) Technical development for the Seikan tunnel. Tunn Undergr Space Technol 1(3):341–349
Nilsen B (2011) Cases of instability caused by weakness zones in Norwegian tunnels. Bull Eng Geol Environ 70:7–13
Nilsen B (2014) Characteristics of water ingress in Norwegian subsea tunnels. Rock Mech Rock Eng 47:933–945
Pan J (2015) Stability analysis and control of rock mass during subsea tunneling in unfavorable geological conditions. Ph.D. thesis, Beijing Jiaotong University. (in Chinese)
Shi S, Li S, Li L, Zhou Z, Wang J (2014) Advance optimized classification and application of surrounding rock based on fuzzy analytic hierarchy process and tunnel seismic prediction. Autom Constr 37:217–222
Squarzoni C, Galgaro A, Teza G, Acosta C, Pernito M, Bucceri N (2008) Terrestrial laser scanner and infrared thermography in rock fall prone slope analysis. Geophysical Research Abstracts 10, EGU2008-A-09254, EGU General Assembly
Tsuji H, Sawada T, Takizawa M (1996) Extraordinary inundation accidents in the Seikan undersea tunnel. Proc Inst Civ Eng Geotech Eng 119(1):1–14
Zhang D, Fang Q, Lou H (2014) Grouting techniques for the unfavorable geological conditions of Xiang’an subsea tunnel in China. J Rock Mech Geotech Eng 6:438–446
Acknowledgments
The research was supported by the State Key Program of the National Science Foundation of China (NSF, Grant No. 51134001) and Soochow University of China (Grant No. Q41330014). Special thanks are extended to the NSF of China and Soochow University for their financial support.
Author information
Authors and Affiliations
Corresponding author
Rights and permissions
About this article

Cite this article
Shi, P., Zhang, D., Pan, J. et al. Geological Investigation and Tunnel Excavation Aspects of the Weakness Zones of Xiang’an Subsea Tunnels in China. Rock Mech Rock Eng 49, 4853–4867 (2016). https://doi.org/10.1007/s00603-016-1076-z
Received:
Accepted:
Published:
Issue Date:
DOI: https://doi.org/10.1007/s00603-016-1076-z